INTRODUCTION
Plans for responses to an influenza pandemic have relied on mathematical models to assess the potential impact of various intervention or mitigation strategies. Given the variability of influenza and the uncertainties surrounding the characteristics of a future pandemic, mathematical models allow assessments of a variety of scenarios, including the effectiveness of various non-pharmaceutical interventions, such as social distancing. Of necessity, assumptions have to be made about various model parameters. One critical parameter is the estimate of the transmissibility of the possible pandemic strain.
Transmissibility is characterized by the basic reproductive number, R 0, which represents the average number of secondary infections caused by a single infected individual in a susceptible population. Under the simplest Susceptible–Infectious–Removed model in a population with random mixing, R 0 is proportional to the contact rate. Thus, models of outbreaks of influenza are highly sensitive to assumptions about the susceptibility of individuals to the virus and the frequency of contacts between individuals [Reference Germann1–Reference Haber3].
Results of simulated outbreaks of influenza and other infectious diseases [Reference Del Valle4] are sensitive to changes in the average contact rates between individuals, but the number of contacts between individuals in different settings (i.e. household, school, workplace, community) is not well known. A few small studies based on convenience samples have been reported [Reference Edmunds, O'Callaghan and Nokes5–Reference Mikolajczyk7], and two European studies have provided the few population-based estimates of contact rates [Reference Wallinga, Teunis and Kretzschmar8, Reference Mossong9], but no studies have been reported for a US population. Acquiring more quantitative data about transmission in different social contexts has been determined to be a priority [Reference Ferguson10]. Quantitative data on social interactions between individuals are especially important for developing more robust models [Reference Carrat2, Reference Haber3, Reference Halloran11, Reference Cauchemez12].
We conducted population-based surveys in North Carolina to provide data on the number of social contacts between individuals according to location, age, and day of the week, as well as spontaneous social distancing behaviour related to influenza-like illness (ILI) or community influenza activity.
METHODS
Study design
We conducted a population-based telephone survey during the 2007–2008 influenza season in four counties in North Carolina. Household telephone surveys were conducted daily throughout the study period in all four counties. The counties are rural to suburban, with populations ranging from 145 000 to 202 000 residents (http://quickfacts.census.gov/qfd/maps/north_carolina_map.html).
The study included a community influenza surveillance component to monitor the level of influenza activity in the four counties. In each county, 2–4 primary-care practices volunteered to record the weekly number of patients with ILI during the influenza season. Each practice was provided with rapid influenza tests (QuickVue®, Quidel Corporation, USA) in order to determine if patients with ILI were infected with influenza. Each week, practices reported the total number of patients, the number with ILI, the number tested, and the number positive for influenza.
The study was approved by the institutional review boards of RTI International, the North Carolina Department of Health and Human Services, and the Centers for Disease Control and Prevention (CDC).
Procedures
Individuals in the four counties were sampled from directories of listed landline telephone numbers. Telephone surveys were conducted each day from 14 September 2007 to 18 May 2008. All residents of the four counties residing in households with listed telephone numbers were eligible for selection. A maximum of 15 calls was made to attempt to contact a household and complete the interview. These calls included at least one attempt during a weekend, one attempt during a weekday, and one attempt during a weekday evening.
A total of 19 085 households were sampled in the four counties, with a goal of 4000 completed interviews. The samples were stratified by county to provide proportionate distribution across all four counties. Sampled phone numbers were prescreened to ensure that the associated households were in the target county. We determined survey response rates by using the Council of Survey Research Organizations (CASRO) method [13]. The response rate was calculated using the number of complete and partial interviews in the numerator and an estimate of the number of eligible units in the sample in the denominator. The calculation assumes that unresolved telephone numbers contain the same percentage of eligible households as the households whose eligibility or ineligibility were determined.
A randomly selected person in each household was selected for the survey. The survey questionnaire contained a module on social interactions for adults and children. Parents responded on behalf of children aged <18 years if a child happened to be randomly selected for the social interactions module. Survey respondents were interviewed by using a survey instrument administered by trained interviewers using a computer-assisted telephone interview (CATI) system. To facilitate recall, we asked participants to report their number of social contacts during the day preceding the telephone interview, by time of day and location, for which we provided prompts of specific locations. The specific locations that were included in the questionnaire are listed in Tables 1 and 2.
Table 1. Locations outside the household frequented by adults for weekdays and weekends
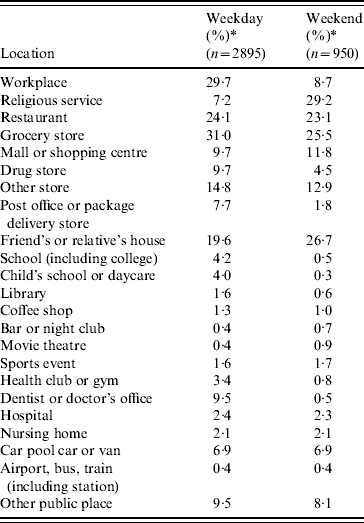
* Crude frequencies, not weighted to the census population characteristics of the four counties.
Table 2. Locations outside the household frequented by children for weekdays and weekends
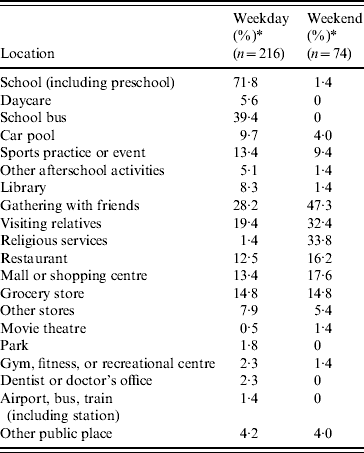
* Crude frequencies, not weighted to the census population characteristics of the four counties.
Variable definitions
Social interactions
The dependent variable was the ‘number of social interactions in a day’. We used different definitions for social interactions for adults and children, including two definitions for adults' interactions.
Adults
Speaking interactions represent the total number of people with whom a survey respondent had a face-to-face conversation lasting ⩾1 min during the day before the interview.
Close-proximity contacts were defined as the total number of people who were within 6 feet of the survey respondent for ⩾15 min during the day before the interview.
Children
Potential social contacts represent an estimate of other children and adults who the child was potentially in close proximity to during the previous day; calculated as the sum of the number of people that the responding parent estimated were present at various locations or activities that the child attended, including household, school, daycare, and various other specified locations. The number of potential contacts at school included the number of other people in all the child's classes, the school bus or car pool, and the school cafeteria.
ILI
The questionnaire asked about recent respiratory and febrile illnesses. From the questionnaire responses, we defined ILI as a self-reported febrile illness accompanied by cough or sore throat.
Peak influenza activity
We adapted criteria based on ILI from CDC's Sentinel Providers system [14] to define periods of peak influenza activity. An ILI proportion above a predetermined threshold correlates well with influenza illness during times when influenza is known to be circulating in a community. Thus, we included data on positive quick tests for influenza infections in our definition of peak influenza activity. The period of peak influenza activity in three of the counties was defined as a period of ⩾2 contiguous weeks during which sentinel physicians reported that >2% of patient visits were for ILI and ⩾2 influenza quick tests were positive, allowing 1-week gaps in contiguous positive weeks. The 2% threshold was based on region-specific CDC criteria.
The sentinel providers in the fourth county had predominantly paediatric practices, with ILI rates substantially higher than those in the other counties. In this county, we estimated a county-specific baseline as the mean proportion of ILI visits plus two standard deviations during weeks outside the peak period of ILI visits, when few influenza quick tests were positive. Thus, in the fourth county, the period of peak influenza activity was defined as ⩾2 contiguous weeks during which sentinel physicians reported >4·1% ILI and ⩾2 influenza quick tests were positive, allowing 1-week gaps in contiguous positive weeks.
School breaks
Dates of winter holidays and spring breaks were determined from the public school calendars in the four counties.
Statistical analysis
For statistical analyses, we used negative binomial regression models with a log-link function. We used US census data for each of the four counties (http://censtats.census.gov/cgi-bin/usac/usatable.pl) to weight the regression model results to account for the deviations of the respondents' distribution by age and gender from the population distribution of the four counties. Separate analyses were conducted for children (<18 years) and adults (⩾18 years) because of the different definitions of ‘social interactions’ in these age groups. The dependent variable was the number of daily social interactions. Independent variables included period of peak influenza activity (at the time of the interview), sex, age, day of week (weekday or weekend), periods of school breaks, county, and month of interview. For adults, we also evaluated differences in social interactions according to reported ILI by the respondent. We were not able to perform a similar analysis for children. Interaction terms were included in the initial models and then dropped if found non-significant. Goodness of fit of the models was evaluated via the deviance statistic.
RESULTS
Sentinel physician results
Peak influenza activity, as defined by the proportion of ILI visits to sentinel providers and number of positive influenza quick test results, generally occurred from mid-January to the beginning of April 2008, although the timing and duration varied by county (Fig. 1). Of the positive quick test results for which type was reported, most were type A influenza, although a few type B specimens were detected.
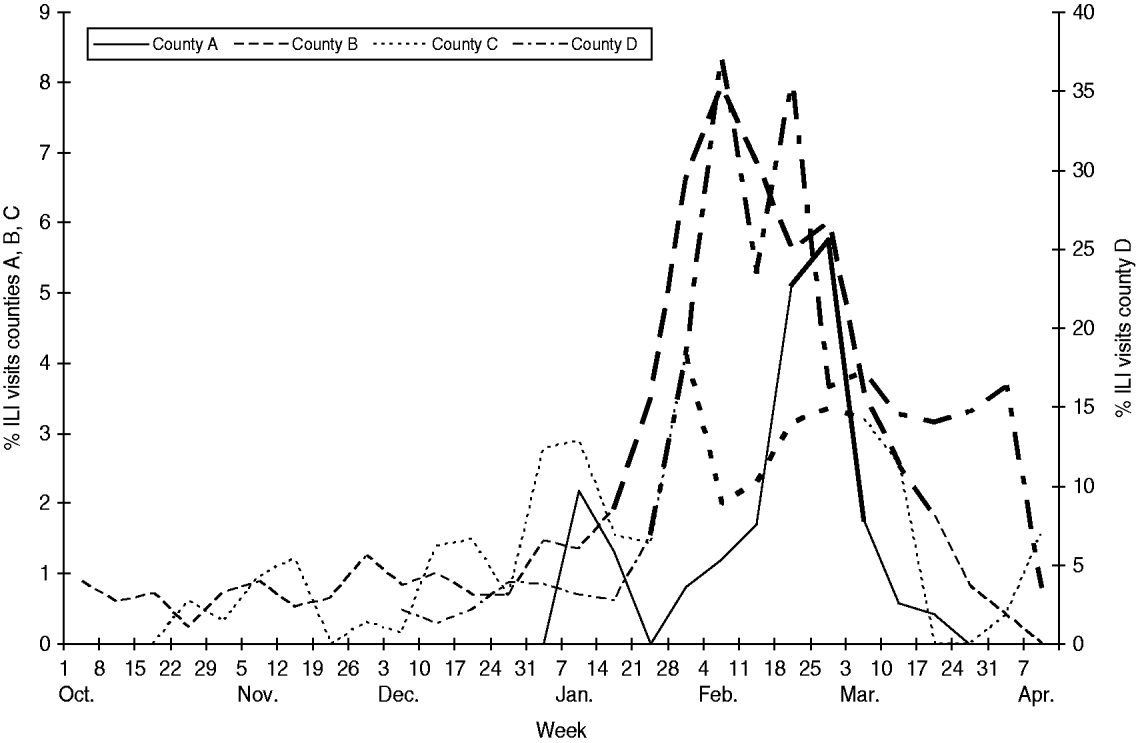
Fig. 1. Percent of visits for influenza-like illness (ILI) reported by sentinel county providers and peak influenza activity (bold line segments).
Survey participants
A total of 4135 adult respondents participated in the surveys. The overall CASRO response rate across all four counties was 35%. Seventy percent of survey respondents were women, 73% white, 13% black, 1% Hispanic; 31% were aged 18–49 years, 34% aged 50–64 years, and 35% aged ⩾65 years. Of all respondents, 3845 were selected to provide social interactions information for themselves, and 290 were selected to provide this information for a randomly selected child in the household.
Activities and locations frequented
For children and adults, the activities and locations that survey respondents reported frequenting (not weighted for census population characteristics of the four counties) during the day before the interview varied by day of the week. For adults, the locations outside the home that were most commonly frequented during weekdays, in addition to work, were grocery stores and other stores, restaurants (including fast food), and the houses of friends and relatives (Table 1). On weekends, the main locations frequented were similar, except that few adults worked and a large proportion attended religious services.
For children, the most commonly frequented location outside the home during weekdays was school, followed by journey on a school bus, gathering or visiting with friends and relatives, and going to the grocery store (Table 2). On weekends, children were reported most frequently to attend gatherings with friends, attend religious services, visit relatives, go to a shopping mall or shopping centre, and go to restaurants.
Social interactions
For adults, the mean number of speaking interactions per day was about 10, as was the number of mean close-proximity contacts. The mean number of social contacts varied by month, increasing from September to December 2007, then decreasing in January and remaining relatively stable until rising again in May 2008 (Fig. 2). Estimates of potential social contacts of children (as reported by their parents) showed more monthly variation than did adult social contacts, with the highest mean contacts in December and the lowest in February (Fig. 3). The results in Figures 2–3 were not weighted to the census population characteristics of the four counties.
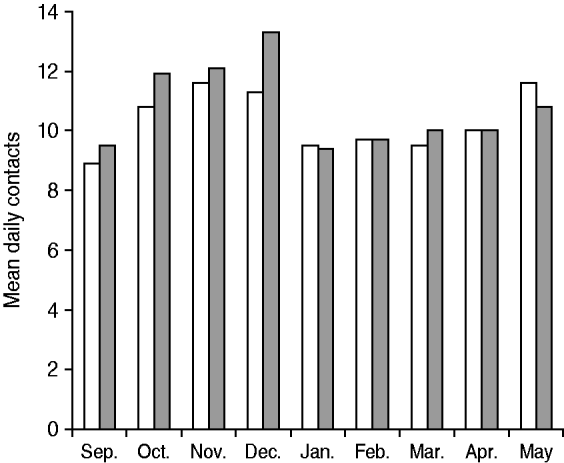
Fig. 2. Adults' daily speaking (□) and close-proximity (![]() ) contacts by month during the 2007–2008 influenza season in four North Carolina counties.
) contacts by month during the 2007–2008 influenza season in four North Carolina counties.
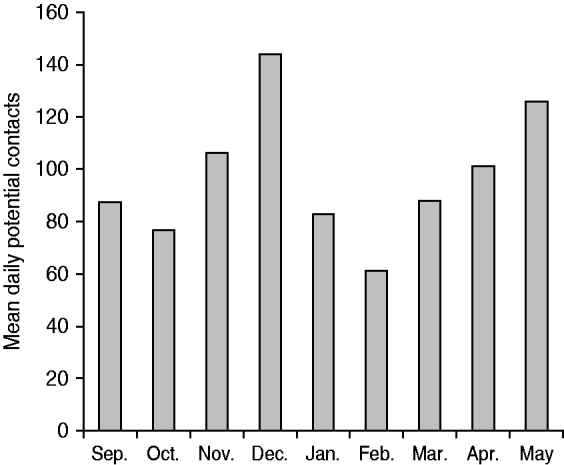
Fig. 3. Children's estimated daily potential social contacts by month during the 2007–2008 influenza season in four North Carolina counties.
The patterns of adult speaking interactions and close-proximity contacts were similar (Table 3). The adjusted model results (including weighting to the census population characteristics of the four counties) indicated that women had 13% more speaking interactions per day than men. Speaking interactions increased with increasing age until age 35–44 years and decreased thereafter. During weekend days, the number of adult speaking interactions was about 22% fewer than during weekdays. Speaking interactions for adults also decreased during school breaks. There was little difference in speaking interactions between periods of peak influenza activity and other periods. Respondents who had an ILI at the time of the interview reported fewer speaking and close-proximity interactions than respondents without ILI.
Table 3. Associations of selected factors with daily adult speaking and close-proximity social contacts
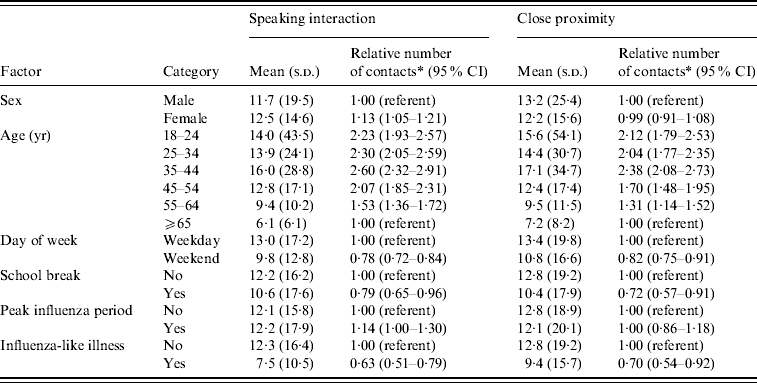
CI, Confidence interval.
* Estimated using negative-binomial regression and adjusted for county, month of interview and all factors in the table. Both the mean and relative number of contacts results were weighted to the census population age and sex distributions of the four counties.
When examined by location, adults' speaking interactions at work decreased on weekends relative to weekdays, whereas speaking interactions in community settings increased on weekends (Table 4). Workplace speaking interactions also decreased during school holidays. During periods of peak influenza activity, speaking interactions at work did not change, but increased by 20% in the community setting. Decreases in speaking interactions among respondents with ILI occurred in both community and workplace settings, but the results were statistically significant only in the community setting.
Table 4. Associations of selected factors with daily adult speaking interactions in work and community settings

CI, Confidence interval.
* Estimated using negative-binomial regression and adjusted for county, age, sex, month of interview and all factors in the table. Both the mean and relative number of contacts results were weighted to the census population age and sex distributions of the four counties.
Children aged <6 years had fewer potential contacts than older children (Table 5). Reflecting the large number of potential social contacts at school, potential contacts were much lower on weekend days than on weekdays and also decreased substantially during school breaks. The crude mean potential social contacts was substantially lower during periods of peak influenza activity than during other periods, but when the data were adjusted for potential confounding factors, including month, the difference was no longer apparent.
Table 5. Associations of selected factors with children's estimated daily potential social contacts
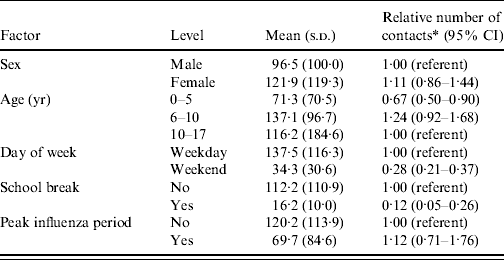
CI, Confidence interval.
* Estimated using negative-binomial regression and adjusted for month of interview, county and all factors in the table. Both the mean and relative number of contacts results were weighted to the census population age and sex distributions of the four counties.
The school setting was the main determinant of differences in children's potential social contacts, according to day of the week and periods of school breaks (Table 6). Children's potential contacts in community settings increased on weekends but not during school holidays. Crude means of children's potential social contacts at school and in the community were both lower during periods of peak influenza activity than during other periods, but the adjusted results did not indicate a significant difference during periods of peak influenza activity.
Table 6. Associations of selected factors with children's estimated daily potential social contacts in school and community settings

CI, Confidence interval.
* Estimated using negative-binomial regression and adjusted for age, sex, month of interview, county, and all factors in the table. Both the mean and relative number of contacts results were weighted to the census population age and sex distributions of the four counties.
DISCUSSION
This large population-based survey provides some of the first estimates of social contact rates in a US population that may be particularly relevant to transmission of acute respiratory infections such as influenza. We also assessed frequency of contacts in different settings or locations, which could be particularly important in mathematical models to estimate the potential effect of various intervention measures on the spread of influenza [Reference Kretzschmar and Mikolajczyk15]. For adults, we found that during weekdays the locations outside the home most commonly frequented were work, stores, restaurants, and friends' and relatives' houses. Factors that influenced the number of adults' social contacts included age and day of the week. We also found a decrease in mean number of adults' daily social contacts during school holidays, reflecting primarily a decrease in workplace contacts and probably related to concurrent workplace holidays. Although adults with ILI had fewer community contacts, we did not find evidence of spontaneous social distancing by adults during periods of peak influenza activity in their community, rather the number of community contacts tended to increase.
For children, potential social contacts outside the home during weekdays could have occurred primarily at school-related activities, followed by gatherings with friends and visiting relatives. On weekends, children were most frequently reported to attend gatherings with friends, attend religious services, visit relatives, and go to shopping malls or shopping centres and restaurants. The number of potential social contacts of children was lower among preschool-age children than school-age children, lower on weekends than during the week, and decreased during school holidays. Children's potential social contacts decreased substantially during periods of peak influenza activity, although this may have been related to some extent to temporal trends of generally fewer potential social contacts during the winter months of January–March. Thus, it is not clear if our finding of lower potential social contacts by children during periods of peak influenza activity represents spontaneous social distancing behaviour.
Our study had a number of strengths, including its population-based design, large sample size, community surveillance to monitor influenza activity, a short 1-day recall interval about the previous day's activities, and statistical control for several potential confounding factors.
The limitations of our study included relatively low participation rates, use of a new questionnaire and survey methodology that relied on respondents' recall of social contacts, and estimation of children's potential social contacts as reported by their parents and not directly ascertained from the children. Participation was higher among women and older individuals, which doubtless impacted some of our results, particularly the frequencies of activities and locations frequented that were not weighted for the census population characteristics of the four counties. This should be less of a concern for the regression model results, which were weighted to the census population characteristics.
Our study design was not completely novel. Other studies have used a design in which contact information was ascertained for a specific day [Reference Edmunds, O'Callaghan and Nokes5–Reference Mikolajczyk7, Reference Mossong9]. Speaking interactions have also been a primary measure of social contacts in other studies [Reference Edmunds, O'Callaghan and Nokes5–Reference Mossong9]. Self-reported recall of social contacts, as used in our study, has been validated against diary measures in another study that found that reporting of recalled contacts ‘yesterday’ was similar to diary recording of contacts [Reference Beutels6].
We are aware that influenza rapid tests, such as we used in our community surveillance for influenza, may have low sensitivity for influenza infections [Reference Hurt16, Reference Uyeki17]. However, reliance on rapid tests was suitable for our purposes because we used them as an indicator, along with ILI visits, that influenza was circulating in the community and not to precisely estimate influenza infection rates.
Another concern regarding our study may be that our results from four relatively small North Carolina counties may not be generalizable to other communities, particularly larger cities, in the USA or other countries. The other published study that provides the data most comparable to our study was a large survey involving 7290 participants conducted in eight European countries during 2005–2006 [Reference Mossong9]. That study found that, although the number of social contacts varied by country, mixing patterns and contact characteristics were similar across countries. Although the study used a diary method and different definitions of social contacts (i.e. two-way conversation of three or more words or direct skin-to-skin contact), the overall number of daily social contacts in adults was similar to our findings (the mean number of social contacts in adult age groups in the European survey was 7–14 compared to 6–17 speaking interactions in our study). The patterns of social contacts were also similar to ours: higher in children aged 10–19 years than in adults, a sharp decrease at age ⩾60 years, and lower on weekends than during the week.
However, the number of children's daily social contacts in the European study was much lower than our estimates. The European study also relied on parents reporting the social contacts of their children, but the parents were asked to estimate the actual number of their children's speaking interactions and skin-to-skin contacts, whereas our study asked the parents to estimate the number of other people that the child was with or who were present at the child's school activities and at other specific events or locations that the child attended. Our definition of potential school-related contacts may be overly broad. If we do not include potential contacts in the school cafeteria or on the school bus, the unadjusted total number of potential daily contacts of children would decrease from a mean of 94 to 49. A study of school children in Germany that included all classmates as part of the estimate of daily social contacts found an average of 33 contacts per day [Reference Mikolajczyk7].
While our study provides valuable information about the number of contacts made by adults and children in various settings, we do not have information about the characteristics of the persons who were contacted by our study subjects. Therefore we are unable to estimate the contact matrix. It would be valuable for future studies to collect more detailed data, such as age group, on the individuals who are contacted by each study participant.
The results from our study should be useful for mathematical models of epidemic and pandemic influenza, as well as models of other infectious diseases transmitted by close contact. Our results confirm the large role of schools on the number of children's social contacts. The results are also in line with the finding from one study that school closure can help to mitigate seasonal influenza epidemics. School closure is a commonly considered measure as an influenza epidemic or pandemic control strategy. An analysis of French influenza surveillance data and school holidays, estimated that prolonged school closure during holidays prevented 16–18% of influenza cases [Reference Cauchemez12]. Our data indicate that school holiday closures resulted in a large decrease in children's potential social contacts, as well as a decrease in adults' work-related contacts. Other analyses using survey data of social contacts have estimated that school closure could have a substantial impact on decreasing influenza transmission [Reference Glass and Glass18, Reference Hens19]. Analyses using a method linking contact data with serological data proposed by Wallinga et al. [Reference Wallinga, Teunis and Kretzschmar8] have further documented the important role of school-age children in contributing to the spread of respiratory infections such as influenza.
Our findings may be useful in influenza epidemic and pandemic preparedness in addition to response planning. The results suggest that preparedness and intervention activities or communication campaigns should include work sites, schools, stores, restaurants, and churches. Gatherings with friends and relatives are also frequent venues for contacts among people and should be considered in mitigation plans. In our survey communities, sports events, movie theatres, and other entertainment venues were infrequently attended.
In conclusion, our study provides some of the first US population-based data on social contacts and factors that influence social contacts. These data may better inform mathematical models of close-contact infectious diseases, such as influenza, although more needs to be known about the interactions between people that lead to infection.
ACKNOWLEDGEMENTS
We gratefully acknowledge the contributions of Jeffrey Engel for support in implementing the survey in North Carolina and Rodney Baxter for technical support with data analysis. Financial support for the study was provided by a cooperative agreement from the Centers for Disease Control and Prevention.
The opinions expressed by authors contributing to this article do not necessarily reflect the opinions of the Centers for Disease Control and Prevention or the institutions with which the authors are affiliated.
DECLARATION OF INTEREST
None.


