Thase et al (Reference Thase, Entsuah and Rudolph2001) provide some evidence that venlafaxine is superior to selective serotonin reuptake inhibitors in terms of relapse rates. Although the authors are honest about the limitations of this meta-analysis, these need further exploration.
All meta-analyses should be based on a systematic review of the literature, which should include an exhaustive search for trials including those unpublished (grey data). Failure to do this could result in publication bias, because studies showing negative results or no differences are less likely to be published than those showing positive results. Failing to identify these missing studies may skew the results of this meta-analysis towards favouring venlafaxine. Although the authors identified a further 12 trials (not included in their analysis), there is no description of the search technique and it is possible that other trials were missed.
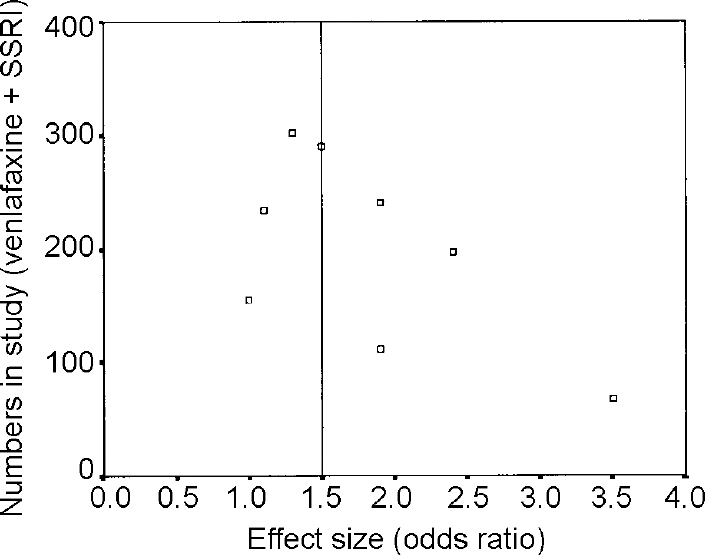
One way to identify possible publication bias is to construct a funnel plot (Fig. 1). This is a simple technique where effect size (in this case odds ratio taken from Table 3 of the paper) is plotted against the number of subjects in each study (Table 1). The principle of a funnel plot is that small studies are less precise and the precision of a study increases, approximating to the true effect, as the sample size gets larger. This produces an inverted funnel shape. Data missing from the lower left segment of the plot suggests small negative studies have not been identified.

Fig. 1 Funnel plot of data from Thase et al (Reference Thase, Entsuah and Rudolph2001). The vertical line is the pooled effect size about which a symmetrical inverted funnel shape should appear.
The authors do not include the 12 other trials they identified in their paper in the meta-analysis but go on to undertake a “qualitative review” of these trials. This ‘vote counting’ technique can be misleading as smaller trials are given as much weight as larger ones.
There would be a tendency for some evidence-based practitioners to disregard this paper completely. I think this is to miss the point of evidence-based medicine, which is not to be reductionist about evidence. Rather, we should use our skills in evidence-based medicine to decide where on a continuum between very good and very bad a particular paper lies, and use its conclusions accordingly.


eLetters
No eLetters have been published for this article.