Little and Meng (L&M) (Reference Little and Meng2023) question the prevailing narrative of widespread democratic backsliding by showing that various objective indicators of democracy are flat over time. However, because recent democratic decline is concentrated in democracies, the objective indicators can accurately test for backsliding only if they can track democratic quality within democracies. This response article shows that they cannot, for conceptual and empirical reasons. The indicators generally can distinguish democracies from autocracies but are blind to variation in quality within democracies. L&M, therefore, are showing that one form of variation in democracy is stagnant but are systematically missing the very type of variation that has most informed current warnings about backsliding.
THE STREETLIGHT OF DEMOCRACY
Is global democracy in decline or is it a political science “satanic panic” conjured up by media hype and pessimism? L&M (Reference Little and Meng2023) boldly propose that we cannot be sure and that “at least some” of the democratic backsliding narrative arises from bias. The basis for this claim is that most popular democracy ratings are heavily subjective and thus prone to bias, whereas “objective” indicators show no downward trend. This response article contends that these objective measures fail to track democratic quality within democracies and therefore cannot test whether democratic backsliding is occurring.
L&M primarily discuss global trends in democratic quality, whereas I focus exclusively on democracies. However, my analysis is relevant to the more general claim because I show that the indicators are missing not only a major source of variation but also the best-documented cases of backsliding. This is akin to the proverbial peril of looking for your keys under the streetlight because that is where the light is—the objective approach is searching for decline but cannot see where it is actually occurring.
This is akin to the proverbial peril of looking for your keys under the streetlight because that is where the light is—the objective approach is searching for decline but cannot see where it is actually occurring.
A specific focus on democracies is warranted for at least two reasons. First, the narrative of democratic decline that L&M critique always has been principally about democracies. Democratic cases have attracted the overwhelming share of press and scholarly attention—particularly Hungary, Poland, India, Brazil, Turkey, and the United States—resulting in extensive case-based, qualitative support for backsliding (Bermeo Reference Bermeo2016; Haggard and Kaufman Reference Haggard and Kaufman2021; Levitsky and Ziblatt Reference Levitsky and Ziblatt2019). Moreover, decline within democracy is almost universally what scholars mean by “democratic backsliding.”Footnote 1
Second, the clear weight of existing quantitative evidence localizes recent democratic decline to democracies. Most empirical analyses have found only a modest global shift in democracy (Levitsky and Way Reference Levitsky and Way2015; Skaaning Reference Skaaning2020).Footnote 2 Instead, the more common claim is that democratic quality is declining in the world’s democracies. Consider the three examples that L&M (Reference Little and Meng2023) cite in their introduction as emblematic of scholarly “alarm” around democratic backsliding. Of these examples, the Haggard and Kaufman (Reference Haggard and Kaufman2021) study is entirely about democracies, whereas Diamond (Reference Diamond2015) and Lührmann and Lindberg (Reference Lührmann and Lindberg2019) both emphasize that the global decline in democratic quality is minor but nonetheless worrisome because of its concentration in democracies. As Lurhmann and Lindberg (Reference Lührmann and Lindberg2019, 1107) state, “The present reverse wave…mainly affects democracies.”
As further evidence, I examine recent trends in democratic quality, dividing by regime type. The best way to capture these trends is to chart the average decline on each democracy measure from one year to the next, rather than the average level. This addresses the problem of countries moving between samples. For instance, if a democracy experiences a substantial decline in democratic quality, it might drop from the democracy sample and even raise the average quality level.
The left side of figure 1 shows the average yearly change among democracies (including the years of democratic breakdowns) on three measures of democratic quality, averaged by half-decade.Footnote 3 These measures are the V-Dem Polyarchy score (Coppedge et al. Reference Coppedge2022), an average of Freedom House’s (Reference House2022) civil liberties and political rights scores, and the Polity score (Marshall and Jaggers Reference Marshall and Jaggers2020), all scaled 0 to 1. The democracy sample is defined using the Boix, Miller, and Rosato (Reference Boix, Miller and Rosato2013) dataset, which has been updated to 2020. There is a consistent negative trend for all three measures beginning in the late 2000s.Footnote 4 Is this decline meaningful? In aggregate, the net loss since 2006 is equivalent to shifting from the average democracy to the average autocracy for about one-ninth of the world’s democracies, a sizeable decline.
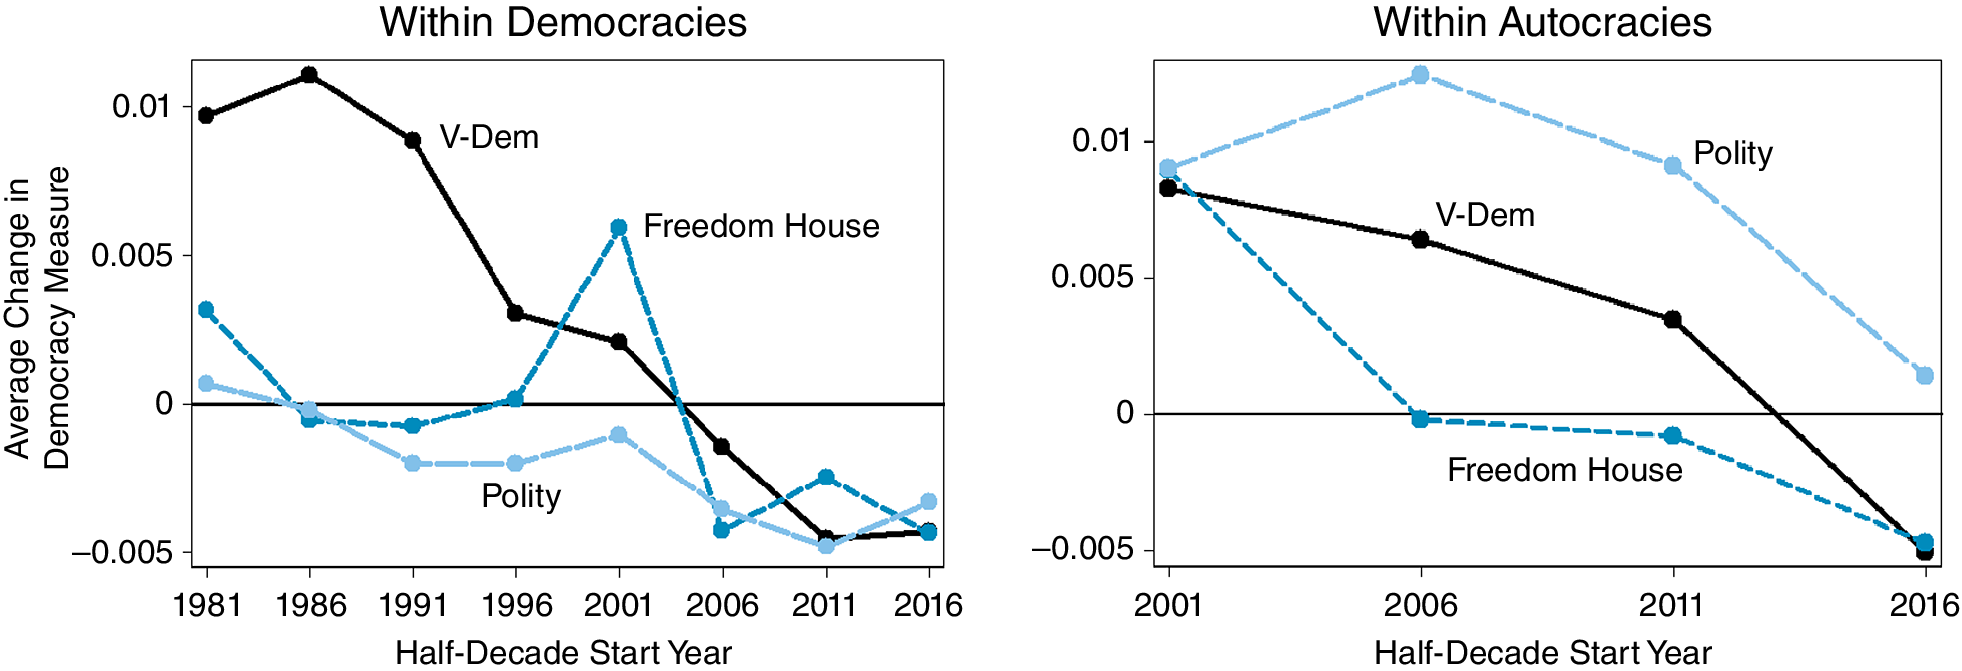
Figure 1 Trends in Democratic Quality
Average annual changes on three measures of democratic quality in samples of democracies and autocracies, averaged by half-decade. Within democracies, each measure shows a decline beginning in the late 2000s.
The right side of figure 1 shows the same changes within autocracies, beginning in 2001.Footnote 5 Now a negative trend does not appear until the late 2010s, well after observers began to warn of backsliding—and then only for V-Dem and Freedom House. In summary, these subjective measures point to a sustained democratic recession only within democracies.
In contrast, L&M show that their objective indicators have held steady globally and in a sample of democracies. It is worth emphasizing that this is their sole basis for doubting the backsliding claims. They do not dispute the coding of any cases, and they have neither direct evidence of rater bias nor a clear explanation of why collective bias would take hold beginning around 2006–10.Footnote 6 Thus, their case rises and falls with whether the objective indicators accurately track democratic quality within democracies, the focal point of recent decline. I argue that they cannot, for conceptual and empirical reasons.
THE OBJECTIVE INDICATORS: CONCEPTUAL PROBLEMS
Before scrutinizing L&M’s objective indicators, I consider the relative virtues of subjective and objective measures.
Objective and Subjective Measures of Democracy
L&M (Reference Little and Meng2023) emphasize the potential for subjective indices to suffer from rater bias, including changing standards and shifting information over time. By moving to objective measures, this rater subjectivity is eliminated. What this overlooks is that objective measures introduce other sources of bias because they ignore political features that are difficult to measure or cannot be captured concretely. Furthermore, these features can vary in importance over time. Objective measures improve reproducibility but trade off some forms of bias for others. A good example is the old tendency of many observers to count any country with contested elections as a democracy, focusing on the election’s objective existence rather than its quality.
The shortcomings of objective measures are especially severe for modern democracies and liberalized autocracies. Within democracies, ambitious leaders have embraced subtle tactics that operate within the law but steadily erode democratic quality, such as Viktor Orbán’s creeping control of Hungary’s media. Scholars have continually emphasized the gradual and subtle nature of democratic erosion, which is shaped by leaders’ desires to limit domestic pushback and international scrutiny. Objective measures will miss this fundamental shift.
Little and Meng’s Objective Indicators
Nevertheless, let’s give L&M’s chosen indicators a fair shake and ask whether they can track democratic quality within democracies. If not, then they cannot accurately capture democratic backsliding. By my count, L&M consider 14 variables, 12 of which are averaged to create an Objective Index from 1980 to 2021.
Most of the variables can distinguish democracies from the average autocracy but do not meaningfully vary within democracies. These variables include suffrage, multipartyism, two competitiveness measures from the Database of Political Institutions,Footnote 7 whether the leader can be dismissed, whether a leader-succession rule exists, and a count of major process violations (e.g., suspending elections). For each variable, 90+% of democracies received a perfect score. The presence of term limits has slightly more variation but is of unclear democratic valence given that it restricts democratic choice. A count of journalists killed is questionable because the murders were not necessarily perpetrated by the state. A count of imprisoned journalists is more valid; however, approximately 97% of democracies scored a 0.
This leaves four measures, all capturing electoral competitiveness: the ruling party’s margin for the presidency, its margin for the legislature, the duration of its rule, and whether the previous election experienced a turnover in power. These measures vary within democracies and are solid proxies for electoral dominance. However, there are several reasons why turnover and tight competition can coexist with democratic backsliding. This is discussed in further detail after the following section. For now, note that the measures’ variation within democracies is driven almost entirely by election outcomes.
THE OBJECTIVE INDICATORS: EMPIRICAL PROBLEMS
To empirically examine the objective indicators, I focus on the Objective Index, which was generously provided by L&M (Reference Little and Meng2023). This index averages all of the variables except the journalist counts, thereby providing a comprehensive picture of how well the objective indicators track democratic quality. L&M caution that the index is not meant as a substitute for existing democracy scores. However, they draw conclusions about trends in democracy by contrasting the index’s average over time with other democracy measures, both globally and within democracies. Of course, this contrast can justify their conclusions only if the index, on average, accurately measures democracy in these samples. I therefore conducted several measurement-validity checks of the Objective Index.
The index immediately fails face validity for several countries. In 2020, it rates Afghanistan, Central African Republic, the Democratic Republic of the Congo, and Burma—all autocracies by any reasonable definition—above Canada, the Netherlands, Switzerland, and Japan. China receives a perfect score in all but four years since 1980, which likely stems from a data-merging problem. Despite these cases, the Objective Index distinguishes democracies from autocracies reasonably well.
To evaluate recent democratic decline, the more relevant question is whether the Objective Index tracks democratic quality within democracies. Unfortunately, it does not perform well: it has weak correlations with other democracy measures and logical predictors of quality while failing to predict democratic breakdowns and coups. Curiously, it also positively predicts electoral fraud accusations by monitors. For the following analyses, I limit the sample to democracies as defined by Boix, Miller, and Rosato (Reference Boix, Miller and Rosato2013).
Correlations with Democracy Indices
I first compare variation in the Objective Index with other democracy indices. Figure 2 displays paired correlations between the Objective Index and four popular democracy measures. These are the three measures shown in figure 1 and the Unified Democracy Scores (UDS), which combines 10 democracy scores into one index (Pemstein, Meserve, and Melton Reference Pemstein, Meserve and Melton2010).
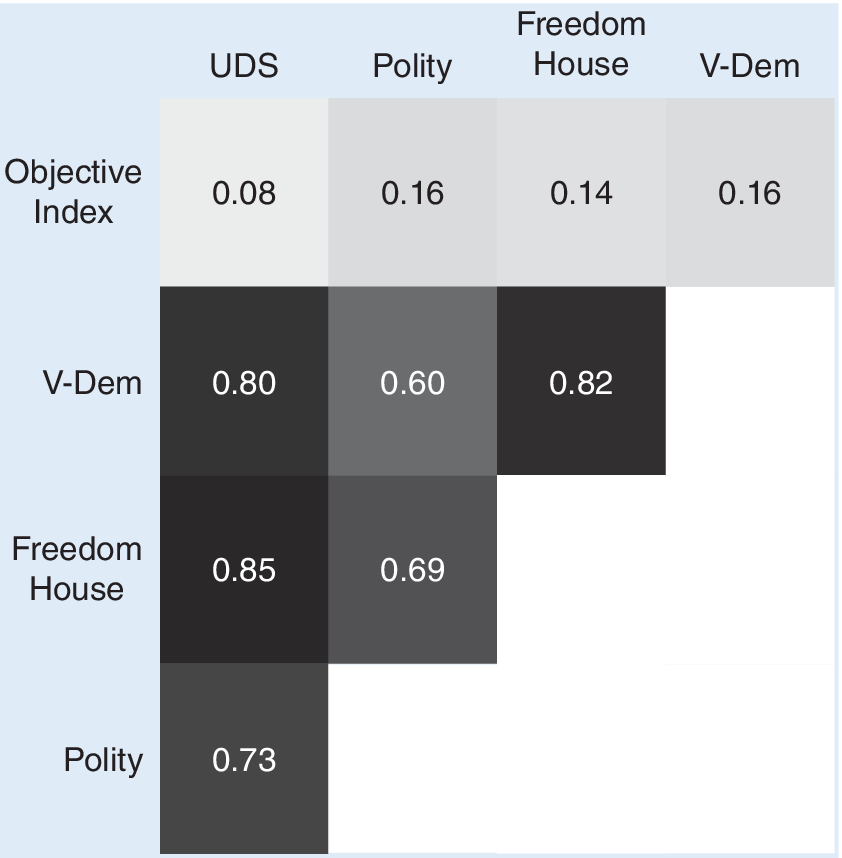
Figure 2 Correlations Across Democracy Measures
Correlations between five measures of democratic quality in a sample of democracies. The Objective Index is an outlier by having a very low correlation with the other measures.
It is immediately clear that the Objective Index is a major outlier. It has a positive but negligible correlation with the other measures, peaking at 0.16. The correlation is even smaller when compared to other V-Dem indices, including electoral quality, rule of law, and civil liberties. In contrast, the correlations among the other measures range from 0.60 to 0.85. This contrast is present for both the entire sample and only before 2006.
Correlations with Predictors of Democratic Quality
The Objective Index’s lack of correlation with other democracy measures may not carry much weight if one believes that those measures are heavily biased. Thus, I consider how the Objective Index (with V-Dem’s Polyarchy and UDS for comparison) relates to five country characteristics that should strongly track democratic quality. The results are shown in figure 3.
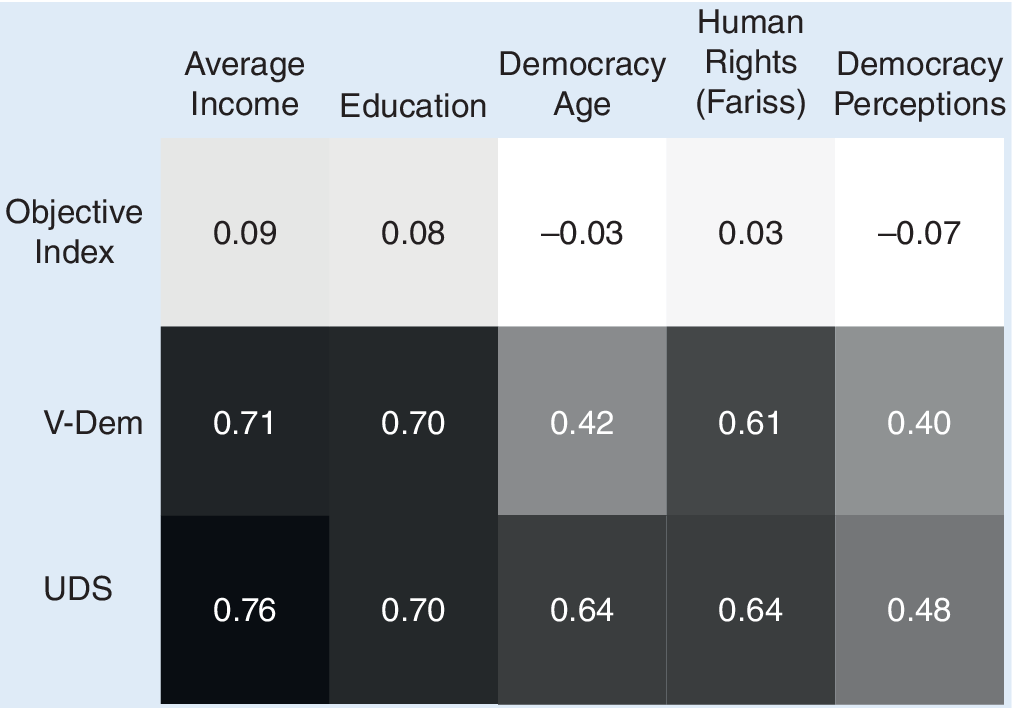
Figure 3 Correlations with Predictors of Democratic Quality
Correlations among three measures of democracy and five country characteristics that should co-vary strongly with democratic quality, using a sample of democracies. The Objective Index is an outlier by having a small or negative correlation with each measure.
Average Income (logged) and Education (average years of schooling) are widely used modernization variables that should produce, on average, higher-quality and better-resourced democracies.Footnote 8 The Objective Index weakly correlates with both, compared to the very high correlations of V-Dem and UDS.
Democracy Age is the number of years that a country has been a democracy (Boix, Miller, and Rosato Reference Boix, Miller and Rosato2013). Democratic deepening should lead longer-lived democracies to function better than newer, fledgling democracies. However, in contrast to the other democracy measures, the Objective Index is negatively correlated with age.
Human Rights (Fariss) is a measure of human rights protections designed to be consistent across time (Fariss, Kenwick, and Reuning Reference Fariss, Kenwick and Reuning2020). L&M positively reference the measure when discussing bias corrections. We should expect higher-quality democracies to have fewer human rights violations, but the Objective Index essentially is uncorrelated.
Finally, Democracy Perceptions measures how democratic a country is according to its own citizens. I use survey-weighted country averages from Waves 3–7 of the World Values Survey, spanning 1996–2020 (Haerpfer et al. Reference Haerpfer, Inglehart, Moreno, Welzel, Kizilova, Diez-Medrano, Lagos, Norris, Ponarin and Puranen2022).Footnote 9 Obviously, this is highly subjective, but we should expect citizen evaluations to be related to democratic quality. It is surprising then that the Objective Index is negatively correlated—again, in sharp contrast with the other democracy measures.
Predictions of Democratic Failure and Electoral Fraud
Defenders of the Objective Index may object that we do not know for certain that these characteristics track democratic quality and that perhaps they are influencing rater bias in the subjective measures. In response, I examine more concrete indicators of democratic failure. If democratic quality is meaningful, surely it should guard against democratic breakdown and electoral fraud.
Table 1 summarizes six models in which I pit the Objective Index against V-Dem’s Polyarchy measure in predicting democratic breakdown (Boix, Miller, and Rosato Reference Boix, Miller and Rosato2013), irregular (unconstitutional) executive turnover, and coups within democracies.Footnote 10 For each outcome, I include a basic model with the two democracy measures and an additional model controlling for the year, democracy age, and average income (logged).
Table 1 Predicting Democratic Failure

Notes: Probit models predict democratic breakdown, irregular turnover, and coups in a sample of democracies. All explanatory variables are lagged by a year. Models 2, 4, and 6 control for average income (logged), democracy age, and the year. V-Dem’s Polyarchy measure strongly predicts democratic resilience, whereas the Objective Index does not. t statistics (based on robust standard errors) are in parentheses. *p<0.05, **p<0.01, ***p<0.001.
In every model, V-Dem’s Polyarchy measure is strongly negative, indicating that higher quality insulates democracies against failure. The Objective Index is null in five models and (marginally) significantly positive for irregular turnover in one model. This strongly cautions against the index as a marker of democratic health.
A similar problem arises for electoral fraud. I use a sample of democratic election years in which National Elections Across Democracy and Autocracy (NELDA) records the presence of Western election monitors (Hyde and Marinov Reference Hyde and Marinov2012). Again, I compare V-Dem’s Polyarchy with the Objective Index to predict when the monitors declare fraud. Figure 4 shows the predicted probabilities from a probit model. Higher V-Dem scores sharply reduce fraud declarations, whereas the Objective Index is significantly positive. Moving across the index’s range within democracies raises the probability of fraud being declared by a factor of 14.
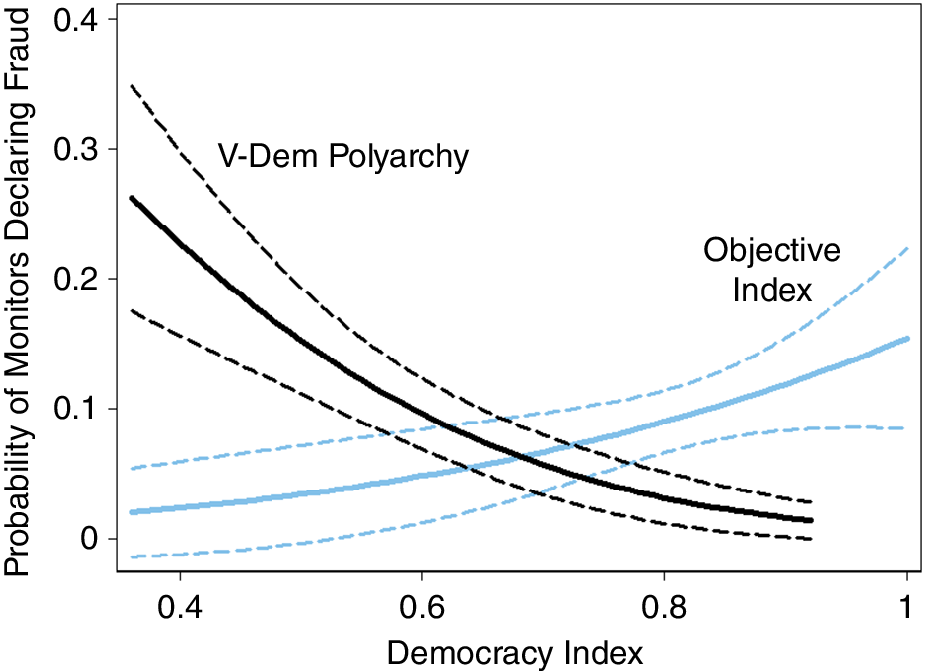
Figure 4 Democracy Measures and Electoral Fraud
The predicted likelihood of Western monitors declaring fraud given V-Dem’s Polyarchy measure and the Objective Index, using a sample of democratic elections with Western monitors present. Higher values of the Objective Index positively predict fraud declarations.
ELECTION TRENDS IN DEMOCRACIES
Because the Objective Index does not appear to track democratic quality in democracies, its flat trend over time does not challenge existing claims about democratic backsliding. Nevertheless, L&M (Reference Little and Meng2023) make an interesting observation that rates of electoral turnover are flat in democracies since about 2000. If democratic erosion is occurring, they argue, it should be reflected in less-competitive elections. However, there are several reasons why close elections and turnover can be consistent with serious democratic erosion.
First, not all turnovers are the same; in fact, some imply democracy gone awry. In the most recent presidential elections in Brazil and the United States, turnover was secured only with the defeat of violent insurrections by the losing candidates’ supporters—hardly a sign of democratic health. Figure 5 captures electoral trends in democracies after accounting for these problematic elections. The left side of the figure shows the fraction of elections in which the incumbent party loses, averaged by half-decade.Footnote 11 The top line includes all turnovers, which confirms the flat trend. The bottom line counts only “clean” turnovers, ignoring those where NELDA credits the turnover to something other than the vote (e.g., protests and coups) or where there were mass protests following the election alleging fraud or with violence. A decline is now observed beginning in the early 2010s. The right side of the figure applies the same standard to elections with any opposition gain and incumbent executives losing elections in which they were competing. Again, a notable decline is observed. Thus, democracies still experience turnovers but they increasingly are disordered and violent.
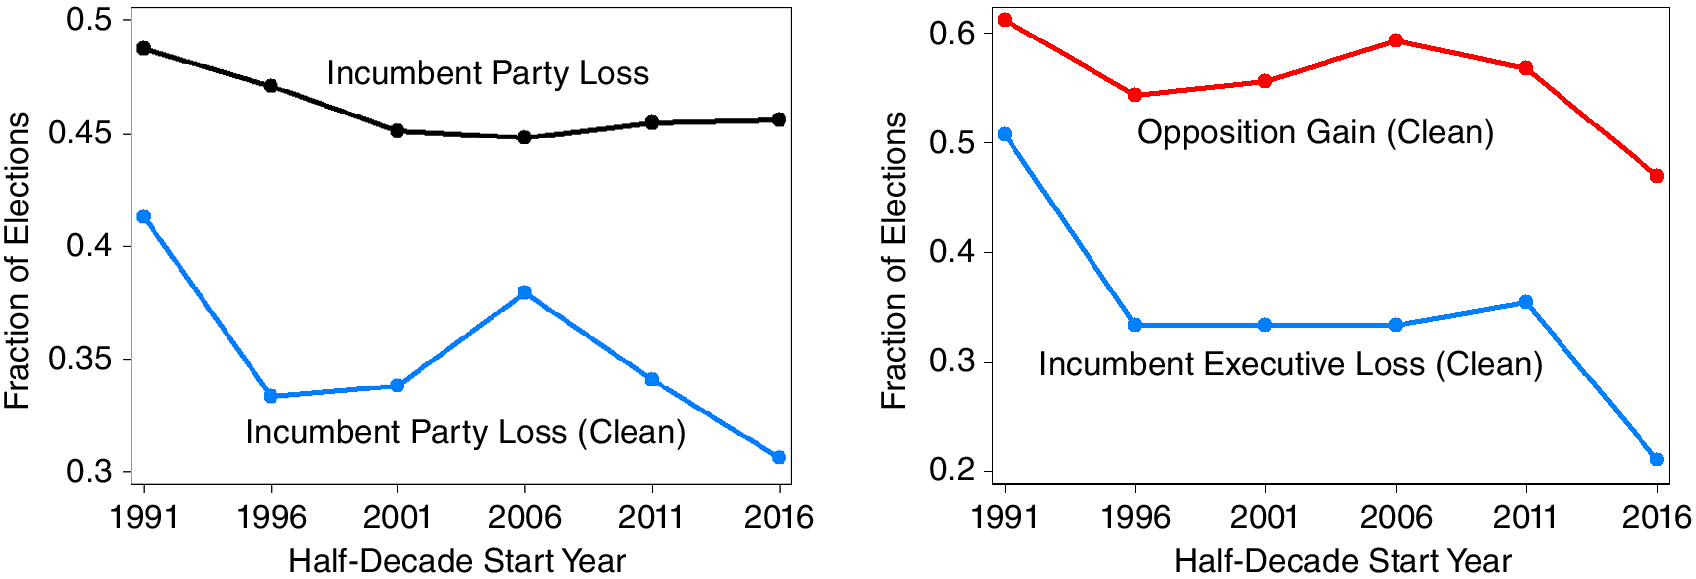
Figure 5 Election Trends in Democracies
Trends in turnover in democratic election years. Overall, incumbent parties lose at the same rate over time. However, “clean” turnovers without violent protests and other irregularities declined in the 2010s.
Second, close elections can occur because democratic erosion and abuses of power cause blowback from citizens. Ambitious leaders can erode horizontal constraints and skew the electoral system in their favor, but the resulting advantages may be balanced by increasing opposition. This does not imply leader irrationality because the abuses may be a reaction to declining support or an attempt to lock in long-term power.
Third, repeated turnover may indicate chronic instability and dissatisfaction with a country’s politics. Consider Peru, which has experienced party turnover in every presidential election since 2001, alongside constant impeachment attempts, the post-tenure arrest of every president, and a recent self-coup attempt. Fourth, it simply may be that backsliding is being engineered by the most recent victor of an executive turnover, as in El Salvador and Tunisia.
FUTURE DEBATE
It is always worthwhile to ask questions whenever there is a consensus. Unfortunately, L&M use a set of measures that are blind to variation in quality within democracies, which represents the lion’s share of recent democratic decline. Nevertheless, it is worth probing more directly for evidence of bias in democracy measures. A case-centered approach would be especially fruitful in further debate: Which cases have been falsely counted as backsliding?
Another important question raised by L&M is why election outcomes have not followed the expected pattern from backsliding. Democratic incumbents have been losing at the same rate over time. This article provides a partial answer by examining how turnover has been happening. Scholars should examine further how elections have been evolving and continue to detail the political patterns that surround backsliding.
ACKNOWLEDGMENTS
I thank the reviewers and the editors for their suggestions for improving this response article. I thank Andrew Little and Anne Meng for sharing their data and starting an important and stimulating debate.
DATA AVAILABILITY STATEMENT
Research documentation and data that support the findings of this study are openly available at the PS: Political Science & Politics Harvard Dataverse at https://dataverse.harvard.edu/dataset.xhtml?persistentId=doi:10.7910/DVN/SS5TKG.
CONFLICTS OF INTEREST
The author declares that there are no ethical issues or conflicts of interest in this research.


