1. Introduction
Many studies of laser-plasma interactions utilize gaseous targets to ensure volumetric heating rather than having the laser absorbed near a solid surface. In many of those experiments, the gas is hydrogen, or a combination of its heavier isotopes deuterium and tritium, since these elements are integral for the study of nuclear fusion processes. However, pure hydrogen fills can complicate experiments because of flammability, or the high pressure needed to generate the required density at room temperature. As a result, experimenters have chosen “surrogate” gases to facilitate experiments with minimal loss of fidelity. Those surrogates are chosen to either have high hydrogen content or to be physically (charge and mass) as close as possible to the ideal gas fill. One example is neopentane (2,2-dimethylpropane), which has been used in laser-plasma instability (LPI) studies over the years [Reference Hinkel, Callahan and Moody1] because it provides a very high number of hydrogen atoms at normal atmospheric conditions with a minimum of carbon contamination. A neopentane gas fill is mostly used to avoid the complex and costly integration of cryogenics to achieve desired densities at a certain allowable pressure. Another example is helium, which is attractive as a deuterium molecule surrogate, since it has the same mass and charge until the molecules dissociate [Reference Geissel, Harvey-Thompson and Awe2]. Identical electron densities are achieved at identical initial pressures and temperatures without the hazard of flammability, and helium is readily available in many laboratories.
Convenience, however, is gained at a cost. Hydrodynamics, laser absorption, radiation transport, LPI generation, and other parameters are influenced by the physical properties of plasma’s constituents. Table 1 compares some of the physical properties of the optional gas fills.
TABLE 1: Comparison of important physical properties for H2, D2, DT, helium, and neopentane. It shall be noted that DT is technically a two-ion component plasma, but due to the minimal difference in mass, it behaves very similarly to a plasma with unique ion species, which cannot be assumed for neopentane.

The “Magnetized Liner Inertial Fusion” program (MagLIF) at Sandia National Laboratories [Reference Slutz, Herrmann and Vesey3, Reference Slutz and Vesey4] prompted an extensive investigation of laser-plasma interactions for the applicable regime of densities and laser parameters [Reference Hinkel, Callahan and Moody1]. Many inertial confinement fusion experiments use cryogenic fuel, which makes neopentane the preferred surrogate because of the high density and low pressure at room temperature. However, MagLIF (to date) has generally used deuterium at moderate pressures and room temperature, favouring gas fills with helium as a surrogate for the initial experiments at Sandia because of the matching electron density at room temperature pressure. After obtaining a flammable gas permit for dedicated experiments that investigate laser-plasma interactions, the studies were extended to include scenarios with D2, and comparisons between the different gases were accessible. The physical properties of a gas have an influence on the dynamics in creating a plasma and in the plasma’s evolution. The following list describes a few properties that may affect laser-plasma interactions:
1.1. Multiplicity of Ion Species
Depending on density and temperature, different ion velocity distributions can lead to spatially varying ratios of ion species, affecting not only the average density but also the average median mass and nuclear charge, which in turn will affect the plasma through processes listed as follows. The formation of multispecies modes of ion-acoustic waves can also influence stimulated Brillouin scattering (SBS).
1.2. Molecular Mass
While the molecular mass is irrelevant as soon as the gas is ionized, it influences the initial pressure of a gas, and therefore, the initial conditions, since the thickness and deformation of the laser-entrance window, typically a few or submicron thick polymer film, depend on that pressure. This affects window absorption losses and the spatial distribution of the laser/plasma interface.
1.3. Ion Mass
The ion mass can affect the formation of ion-acoustic waves and therefore SBS. It also has a direct effect on sound speed, shock velocities, and rarefaction velocities. Therefore, it is essential to the density evolution of the plasma. The ion mass is also relevant for the formation of ion-acoustic waves and the magnitude of Landau damping, since the latter depends on the thermal ion velocity.
1.4. Nuclear Charge
Species with higher nuclear charge will have higher ion charge at a given temperature and density. The ion charge Z i is a linear multiplier to the absorption coefficient in inverse bremsstrahlung absorption for the laser and directly affects laser heating. It is a dominant parameter for radiation transport and losses, which scale with Z i2 and influence how quickly the plasma reaches its final, intensity-determined temperature. Since temperature is also an important parameter for LPI, the nuclear charge may also influence LPI observables, such as SBS and stimulated Raman scattering (SRS) while the temperatures are still rising. Since, for most of the plasma volume, the phase of rising temperatures is much shorter than the time that the plasma is at the final temperature, the influence of nuclear charge on temperature is expected to be a subtle effect on LPI, if observable at all.
In the following sections, we will describe the physical principles that are affecting our observables, the setup of the experiments, an analysis of the results, and finally the conclusion.
2. Observables for the Interaction of Laser Light with Plasmas
Multiple processes occur while a laser pulse heats a plasma. In the case of MagLIF targets, a prepulse first hits a polyimide window which leads to an expansion of the heated window and to backscatter caused by SRS or SBS. After the window experiences some expansion, the main pulse of the laser further heats and penetrates the window plasma. With high densities and temperatures, the pressure of the window material may allow window plasma to mix with the gas fill [Reference Harvey-Thompson, Weis and Harding5]. SBS and SRS can be generated by the main pulse both from window plasma and fuel plasma as well as filamentation in the latter [Reference Geissel, Harvey-Thompson and Awe2]. We assume that most of the LPI causes backscatter, but side scatter may occur. The fill gas is heated to plasma conditions, and with increasing density, temperature, and nuclear charge, radiation from the heated zone may heat colder regions of the gas. In the following sections, we will address individual physical processes during laser heating.
2.1. Stimulated Brillouin Scatter
SBS [Reference Labaune, Fabre, Michard and Briand6, Reference Froula, Divol and Glenzer7] occurs when incident light transfers energy to an ion-acoustic wave, and it is expected predominately as backscatter, with a finite angular distribution that exceeds the cone angle of the incident, focused laser. While some SBS can happen in forward directions as well, the laser light will still be absorbed by the target and therefore contribute to the desired preheat. Forward scatter is not observable by the diagnostic suite presented in this study. In a homogeneous plasma, the growth rate for SBS is given by [Reference Montgomery8]

where k iaw,ω iaw are the wavenumber and frequency of the ion-acoustic wave, E, the electric field of the laser, e, m e, the charge and mass of the electron, m i, Z i, the mass and charge state of the ion, and ω p, ω 0, ω s, the plasma frequency and the frequencies of the incident laser and the scattered wave. This dependency would suggest a decrease of SBS growth with the nuclear charge Z 0, since with increasing Z 0, the mass of an ion species grows faster than the charge state, particularly for relatively low temperatures resulting in partial ionization. However, the growth of SBS can be reduced by Landau damping [Reference Landau9], which is more effective for lighter ions. Here, the ion-acoustic wave transfers energy to ions, which move with velocities close to the wave’s phase velocity. In general, the dominant ion-acoustic mode is expected to have a much faster phase velocity than any species’ average thermal velocity. Therefore, plasmas with lighter ions, exhibiting a higher fraction of the Maxwell–Boltzmann velocity distribution near the wave’s phase velocity, will experience stronger damping. For fusion-relevant plasmas such as those studied in this paper, a common ion temperature in the plasma is typically a valid assumption. As a result, a multispecies plasma will have multiple normal modes corresponding to isotope-specific thermal velocities [Reference Biskamp and Welter10]. These modes can compete and reduce SBS growth. Damping is particularly efficient for adding a (small) fraction of light ions to a heavier species, but the opposite has a potential for notable damping as well, specifically under the consideration of ion trapping [Reference Williams, Berger and Drake11].
2.2. Stimulated Raman Scatter
Stimulated Raman scattering (SRS) [Reference Wilks, Kruer and Denavit12] results from light transferring energy to an electron-plasma wave. Since electrons are several magnitudes lighter than ions, energy transfer is more efficient, and a scattered photon will be significantly red-shifted. The growth rate follows a similar pattern as SBS lowers the influence of charge state and mass ratio [Reference Montgomery8]:

where k epw and ω epw denote the wavenumber and frequency of the electron plasma wave. As apparent from (2), the influence of the ion properties for SRS can only be a secondary effect, such as mass flow, where densification and rarefaction of ion density cause a modification of the electron density on grounds of charge neutrality in the plasma. SRS side scatter can also occur if the incident laser light is s-polarized with respect to a strong, oblique density gradient [Reference Drake, Turner and Lasinski13]. Side scatter would only be observed if light is s-polarized with respect to the object plane, because it is unlikely that any feature can be discriminated from primary laser interactions if it is caused by light being scattered towards or away from the detector. SRS is more prevalent at densities between 10% and 25% of the critical density, n c , for a given laser wavelength. Since the experiments discussed in this paper use fill densities below 10% n c , SRS will likely be a small contributor to energy loss1.
2.3. Laser-Target Coupling
Coupling of laser energy into the gas is the primary objective of the laser preheat studies at Sandia, and the dominant process for laser deposition is absorption through inverse bremsstrahlung, characterized by the collisional absorption coefficient K [Reference Atzeni and Meyer-Ter-Vehn14]:

where ω p is the plasma frequency, and ν e is the electron collision frequency as described by [Reference Atzeni and Meyer-Ter-Vehn14]
Equation (4) assumes that the collision frequency is much smaller than the plasma frequency, and ln λe is the weakly temperature- and density-dependant Coulomb logarithm. Z i stands for the ion charge. It becomes immediately clear that different target gases affect heating via a different ion charge state Z i as noted in the introduction. This brings up a dilemma for surrogate gases: unless you end up with an identical ion charge (such as using hydrogen instead of deuterium-tritium), it is impossible to match both electron density and absorption. As a result, either heating or LPI, or both, will not exactly reproduce the physics of the target gas to be modelled. A best-case compromise is to be found for meaningful studies.
Besides deposited energy, specific coupling details such as the total range of deposition (maximum laser propagation depth) and X-ray brightness distribution of the laser-heated channel can be used to identify similarities and differences for various experimental scenarios. In our experiments, we chose to reduce the density of helium targets by 10%, which we empirically found to preserve the propagation depth of the laser and therefore the plasma volume. Electron densities stay far below the critical density for the laser frequency when fully ionized. D2 at room temperature and 60 psi against vacuum results in 5% n e/n c for 527 nm laser wavelength, while 54 psi of He leads to 4.5% n e/n c. Accordingly, no effects such as two-plasmon-decay, reflection at critical density, or enhanced absorption are expected.
2.4. Experimental Methods
All of the experiments that have been evaluated for this study have been performed in the Pecos target area within the Z-Backlighter facility of Sandia National Laboratories. The Z-Beamlet laser [Reference Rambo, Smith and Porter15] was used to heat a gas volume in a cylindrical target through a laser entrance hole that was covered with a thin polymer foil. A bird’s eye view of the target area is depicted in Figure 1. Some experiments included additional diagnostics pictured in the figure, but this article will focus on the near-beam backscatter imaging and shadowgraphy diagnostics.
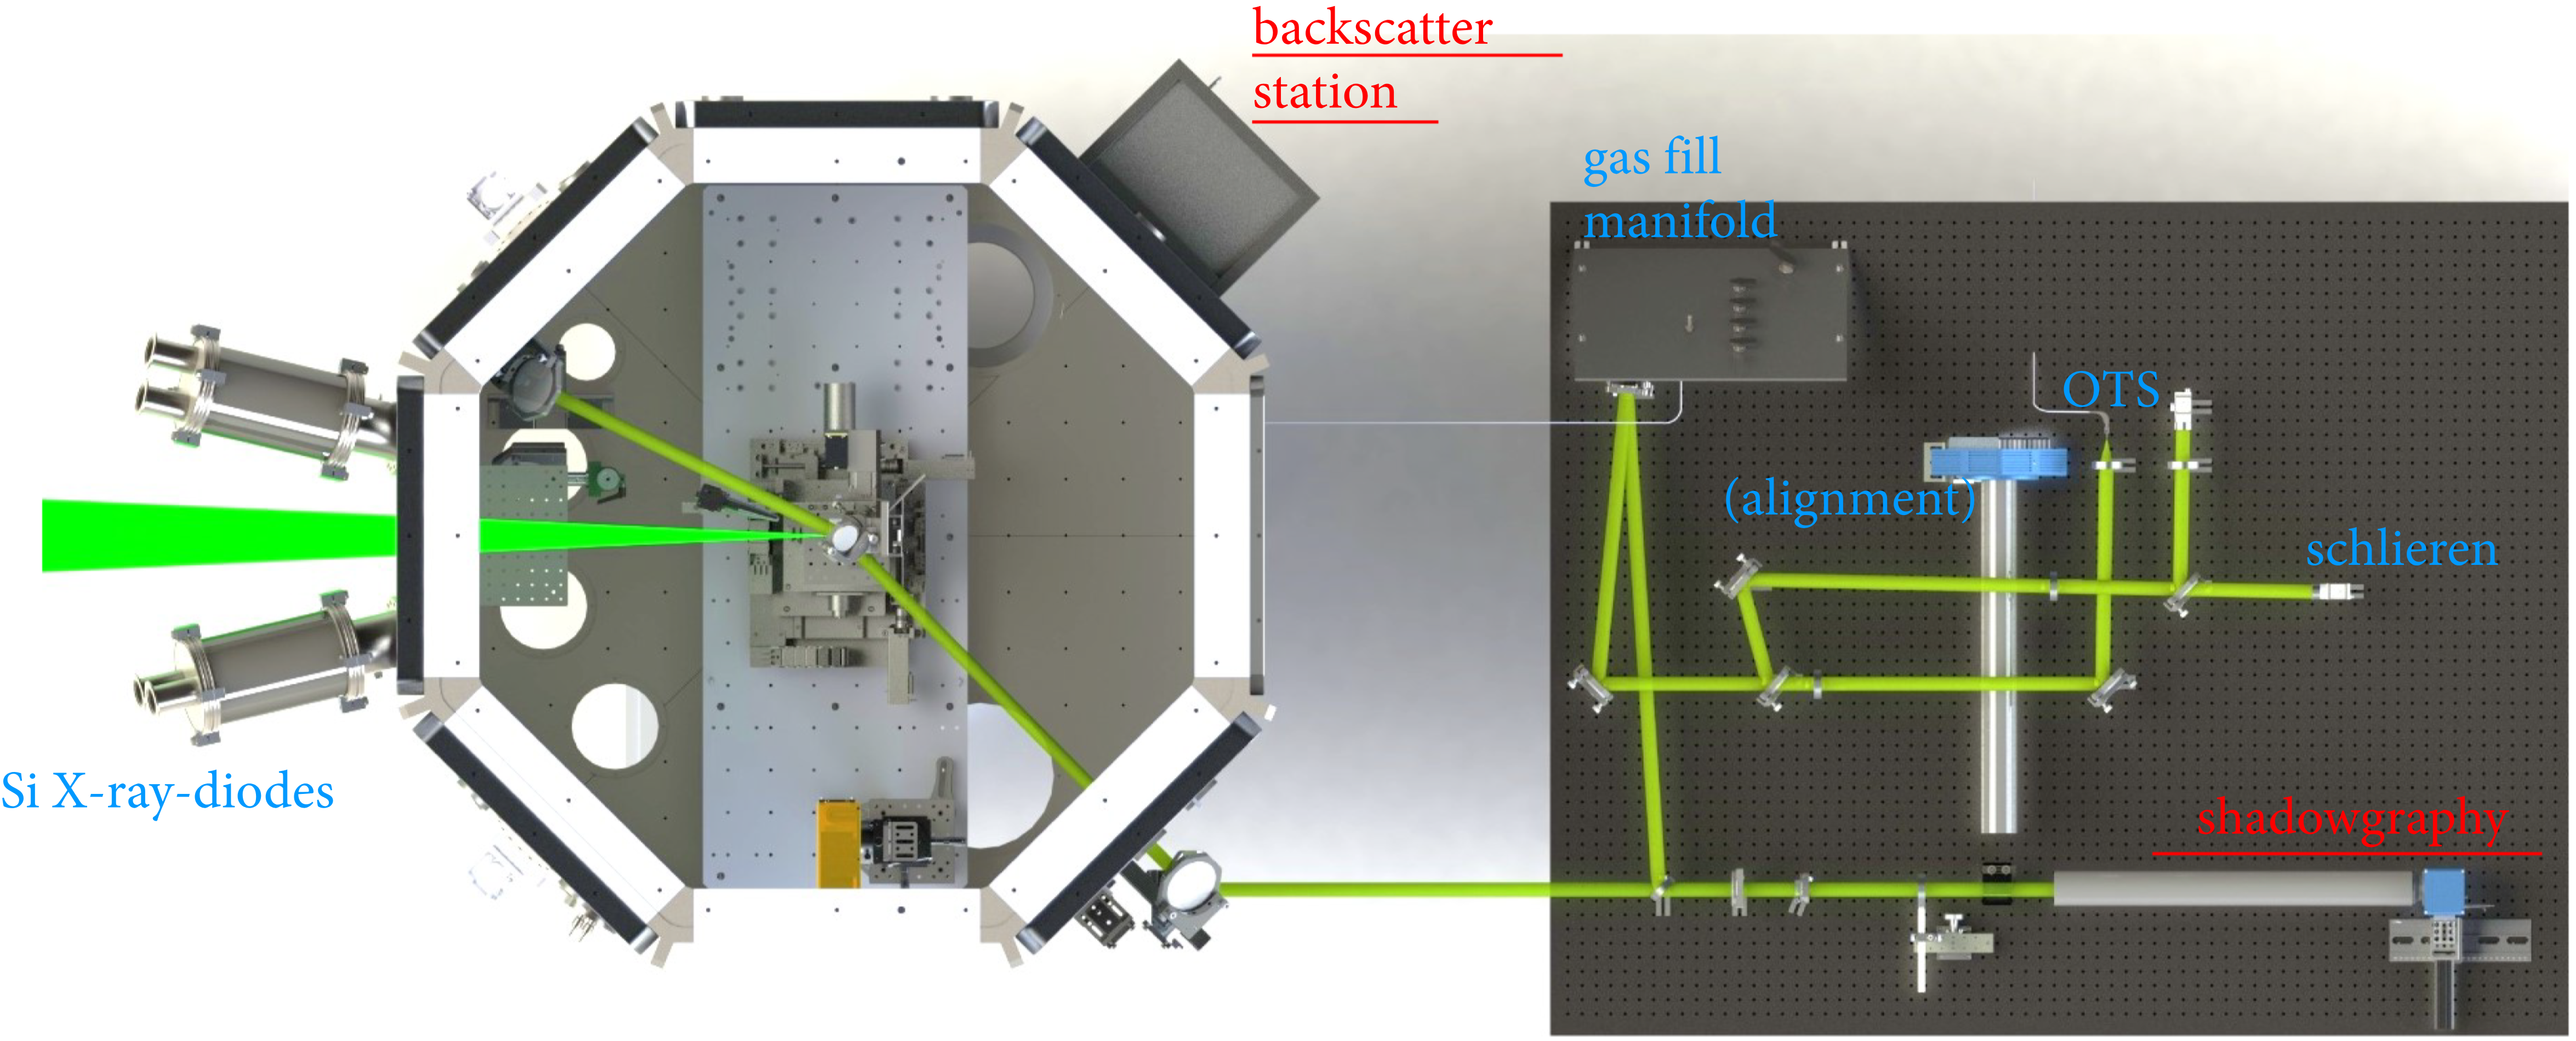
FIGURE 1: Bird’s eye view rendering of the Pecos target area. Z-Beamlet (bright green) is entering from the left (north). A probe laser (soft green) is propagating through the target and analysed on an optical table to the right (south) of the target chamber.
The targets were cylindrical polycarbonate cells with a polyimide laser entrance window of 3 mm diameter and 1.7 μm thickness, assembled at Sandia by General Atomics [Reference Paguio, Smith and Taylor16]. The targets typically had four diagnostic ports. Two opposing ports with antireflective coated acrylic windows allowed the propagation of a probe beam for optical diagnostics, and two more ports enabled X-ray diagnostics via narrow slits. These slits were covered with 13 μm of polyester or polyimide to contain the fill gas. Figure 2 shows a rendering of the target cells. To protect optics and instruments inside of the target chamber, the gas cells were enclosed in a metal debris box, allowing only for the minimum required access to X-ray diagnostics. The optical diagnostic path was protected by secondary debris windows made from Duraplex™, an impact-hardened variant of polyacrylate [17].
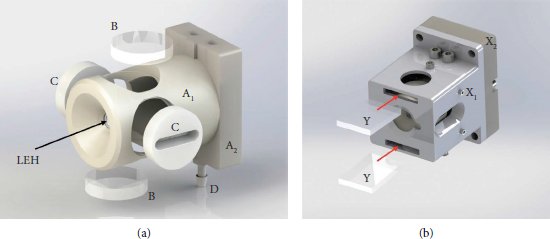
FIGURE 2: (a) Exploded rendering of the target with the main body and mounting base (A1, A2), LEH, optical windows (B), X-ray diagnostic slits (C), and gas inlet nipple (D). (b) Debris enclosure with main body and base (X1, X2), and Duraplex™ debris windows (Y).
2.5. LPI Diagnostics
The primary instruments for the observation of SBS in this paper are a photodiode filtered around the incident laser wavelength (526.6 nm) and a camera recording backscattered light with a similar filter. Both instruments measure the light that is reflected off a square polytetrafluoroethylene (PTFE) screen at the laser entrance wall of the experimental chamber, which has a central aperture that is just large enough to allow unimpeded propagation for the incident laser, as shown in Figure 3. Details for this setup without the diode, the near beam imager (NBI), were recently published by Geissel et al. [Reference Slutz, Herrmann and Vesey3] along with the calibration procedure. PTFE is commonly referred to by DuPont Corporation’s product name Teflon™. With a thickness of a few millimeters, PTFE is an ideal diffuse reflector (scatterer) with an albedo in excess of 98% throughout the visible spectrum and more than 93% when including the near-infrared spectrum (up to λ∼2.5 µm) [Reference Wiley18].
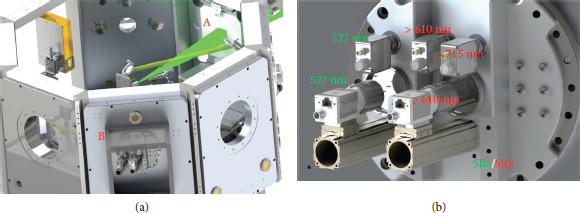
FIGURE 3: Setup of the SBS and SRS near-beam imaging diagnostics. (a) The Z-Beamlet laser enters the chamber through a hole in the PTFE screen (A). Backscattered SBS or SRS light illuminated the screen and recorded via filtered diodes and cameras in the NBI backscatter box (B). (b) Arrangement of instruments inside the NBI backscatter box.
We observe SRS backscatter in a similar setup to SBS but with two differently filtered diodes (long pass filters at 610 nm and 710 nm). Indications of side scatter can be observed on shadowgraphy images of the interaction region as described as follows. Shadowgraphy is the main diagnostic for this observable, using the radial expansion dynamics of the laser-driven blastwave as an indicator for encircled energy density. A detailed description of the measurement and evaluation of deposited laser energy in MagLIF targets has been published recently [Reference Harvey-Thompson, Geissel and Jennings19].
2.6. Shadowgraphy
A pulse train from the Chaco probe laser with a few millijoules at about 500 ps pulse length and 532 nm wavelength was used to image the propagation depth and shape of the laser-induced plasma channel. We will refer to each individual pulse as a frame to emphasize the imaging nature of the diagnostic and to distinguish it from the laser pulses of Z-Beamlet, which were the driver of the experiments. The probe propagation was orthogonal to Z-Beamlet. Two probe paths were used allowing an east-west view of the target in earlier experiments and an up-down view later. The Z-Beamlet laser was polarized horizontally and will, therefore, refer to the later setup as p-polarized view, since the laser polarization was parallel to the imaging plane. Adhering to standard optics terminology, we will refer to the earlier setup as s-polarized view. Figure 4 shows renderings of the p- and s-polarized setups including the two pinhole cameras for side-on and end-on X-ray imaging.
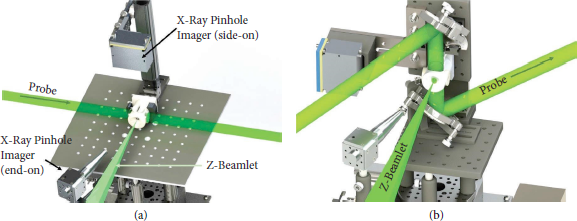
FIGURE 4: (a) Configuration of the target chamber centre for s-polarized view with only one X-ray diagnostic port. (b) Configuration for the p-polarized view. The X-ray diagnostic port opposite to the pinhole camera is used for spectroscopy. Both renderings omitted to debris enclosure for better clarity.
Up to four frames were used, with the late frames carrying blast wave expansion data for the determination of deposited energy. The earliest frame was typically within a few nanoseconds after the end of Z-Beamlet’s main pulse, thus allowing us to determine the laser propagation depth and the overall shape of the heated region in the target. Only the first frame is used in this study. Later frames occurred with 25 ns separation between frames to improve the fidelity of energy deposition measurements as reported by Harvey-Thompson et al. [Reference Harvey-Thompson, Geissel and Jennings19]. The frames were recorded with an ultrafast hybrid CMOS detector developed at Sandia National Laboratories [Reference Claus, Robertson and Fang20].
2.7. Laser Configurations
Z-Beamlet operates at the second harmonic (2ω) of Nd:YLF’s 1053 nm line, which results in a centre wavelength of 526.6 nm. Pulses of 0.3–6 ns width can reach up to 1 TW power with a maximum contained energy of about 4.5 kJ, not accounting for losses in the subsequent beam transport. The laser beam with a square cross section of 31 cm × 31 cm is focused by a 3.2 m lens onto the target with the best focus on the LEH window (with phase plate) or 3.5 mm in front of the LEH window (without phase plate). For the experiments described here, the laser energy was chosen not to exceed a total of 2.5 kJ on target. Three different laser configurations were chosen to reflect parameters that were historically relevant for MagLIF and covered different regimes of LPI generation.
Early experiments were used as a defocused spot on the LEH window without any spot smoothing by distributed phase plates (DPP [Reference Dixit, Nugent, Lawson, Manes and Powell21, Reference Lin, Lawrence and Kessler22]). This scenario also used the highest power and ultimately yielded by far the highest LPI effects as described in detail in Geissel et al. [Reference Geissel, Harvey-Thompson and Awe2]. As laid out in the same publication, two more configurations were employed by using phase plates with 750 µm and 1100 µm diameter for 95% of encircled energy in the spot, which we refer to as DPP750 and DPP1100. These two also used a longer main pulse with lower power to further reduce LPI without sacrificing laser energy. The area characterizing the peak intensity, not including the slopes of the focal spot’s edges, was well described for either phase plate by a circle enclosing 75% of the laser energy [Reference Geissel, Harvey-Thompson and Awe2] at 0.0025 cm2 (DPP750) and 0.0053 cm2 (DPP1100) but cannot be determined well for cases without phase plate. Acknowledging that concentrated areas with higher and lower intensities exist, we take the area of the smallest rectangle that encloses 75% of the energy as a substitute (0.0013 cm2). All laser configurations used a prepulse to preheat the LEH window and minimize its impact on the main pulse’s energy deposition. The peak of this prepulse was set at 3.5 ns prior to T = 0, which is defined by the half-height point of the rising edge of the main pulse. Table 2 lists a summary of the laser configurations.
TABLE 2: Comparison of laser configurations covered in this study including a plot illustrating the typical laser pulse train. T = 0 is defined as the half-height point of the rising edge of Z-Beamlet’s main pulse. For more details about the focal intensity distribution with or without the two applied phase plates, see Geissel et al. [Reference Slutz, Herrmann and Vesey3].

3. Results
Time-resolved data from the photodiodes consistently showed very different signatures for SRS versus SBS. The SBS diode shows a strong signal response for the prepulse, which most likely contains a significant contribution from laser reflection at the overdense window plasma. In contrast to SBS, the prepulse caused very little response in the SRS spectrum, and in most cases no measurable response at all. Also, the signatures in the SBS spectrum varied significantly for changing laser configurations. While shots without DPP showed the majority of the SBS in the main pulse, the shots with DPP successfully reduced SBS, mostly within the main pulse, which ended up creating less SBS than the prepulse. Figure 5 compares the diode traces of SBS and SRS for a shot without phase plate smoothing along with the SBS trace from a different shot that used a 750 µm phase plate.
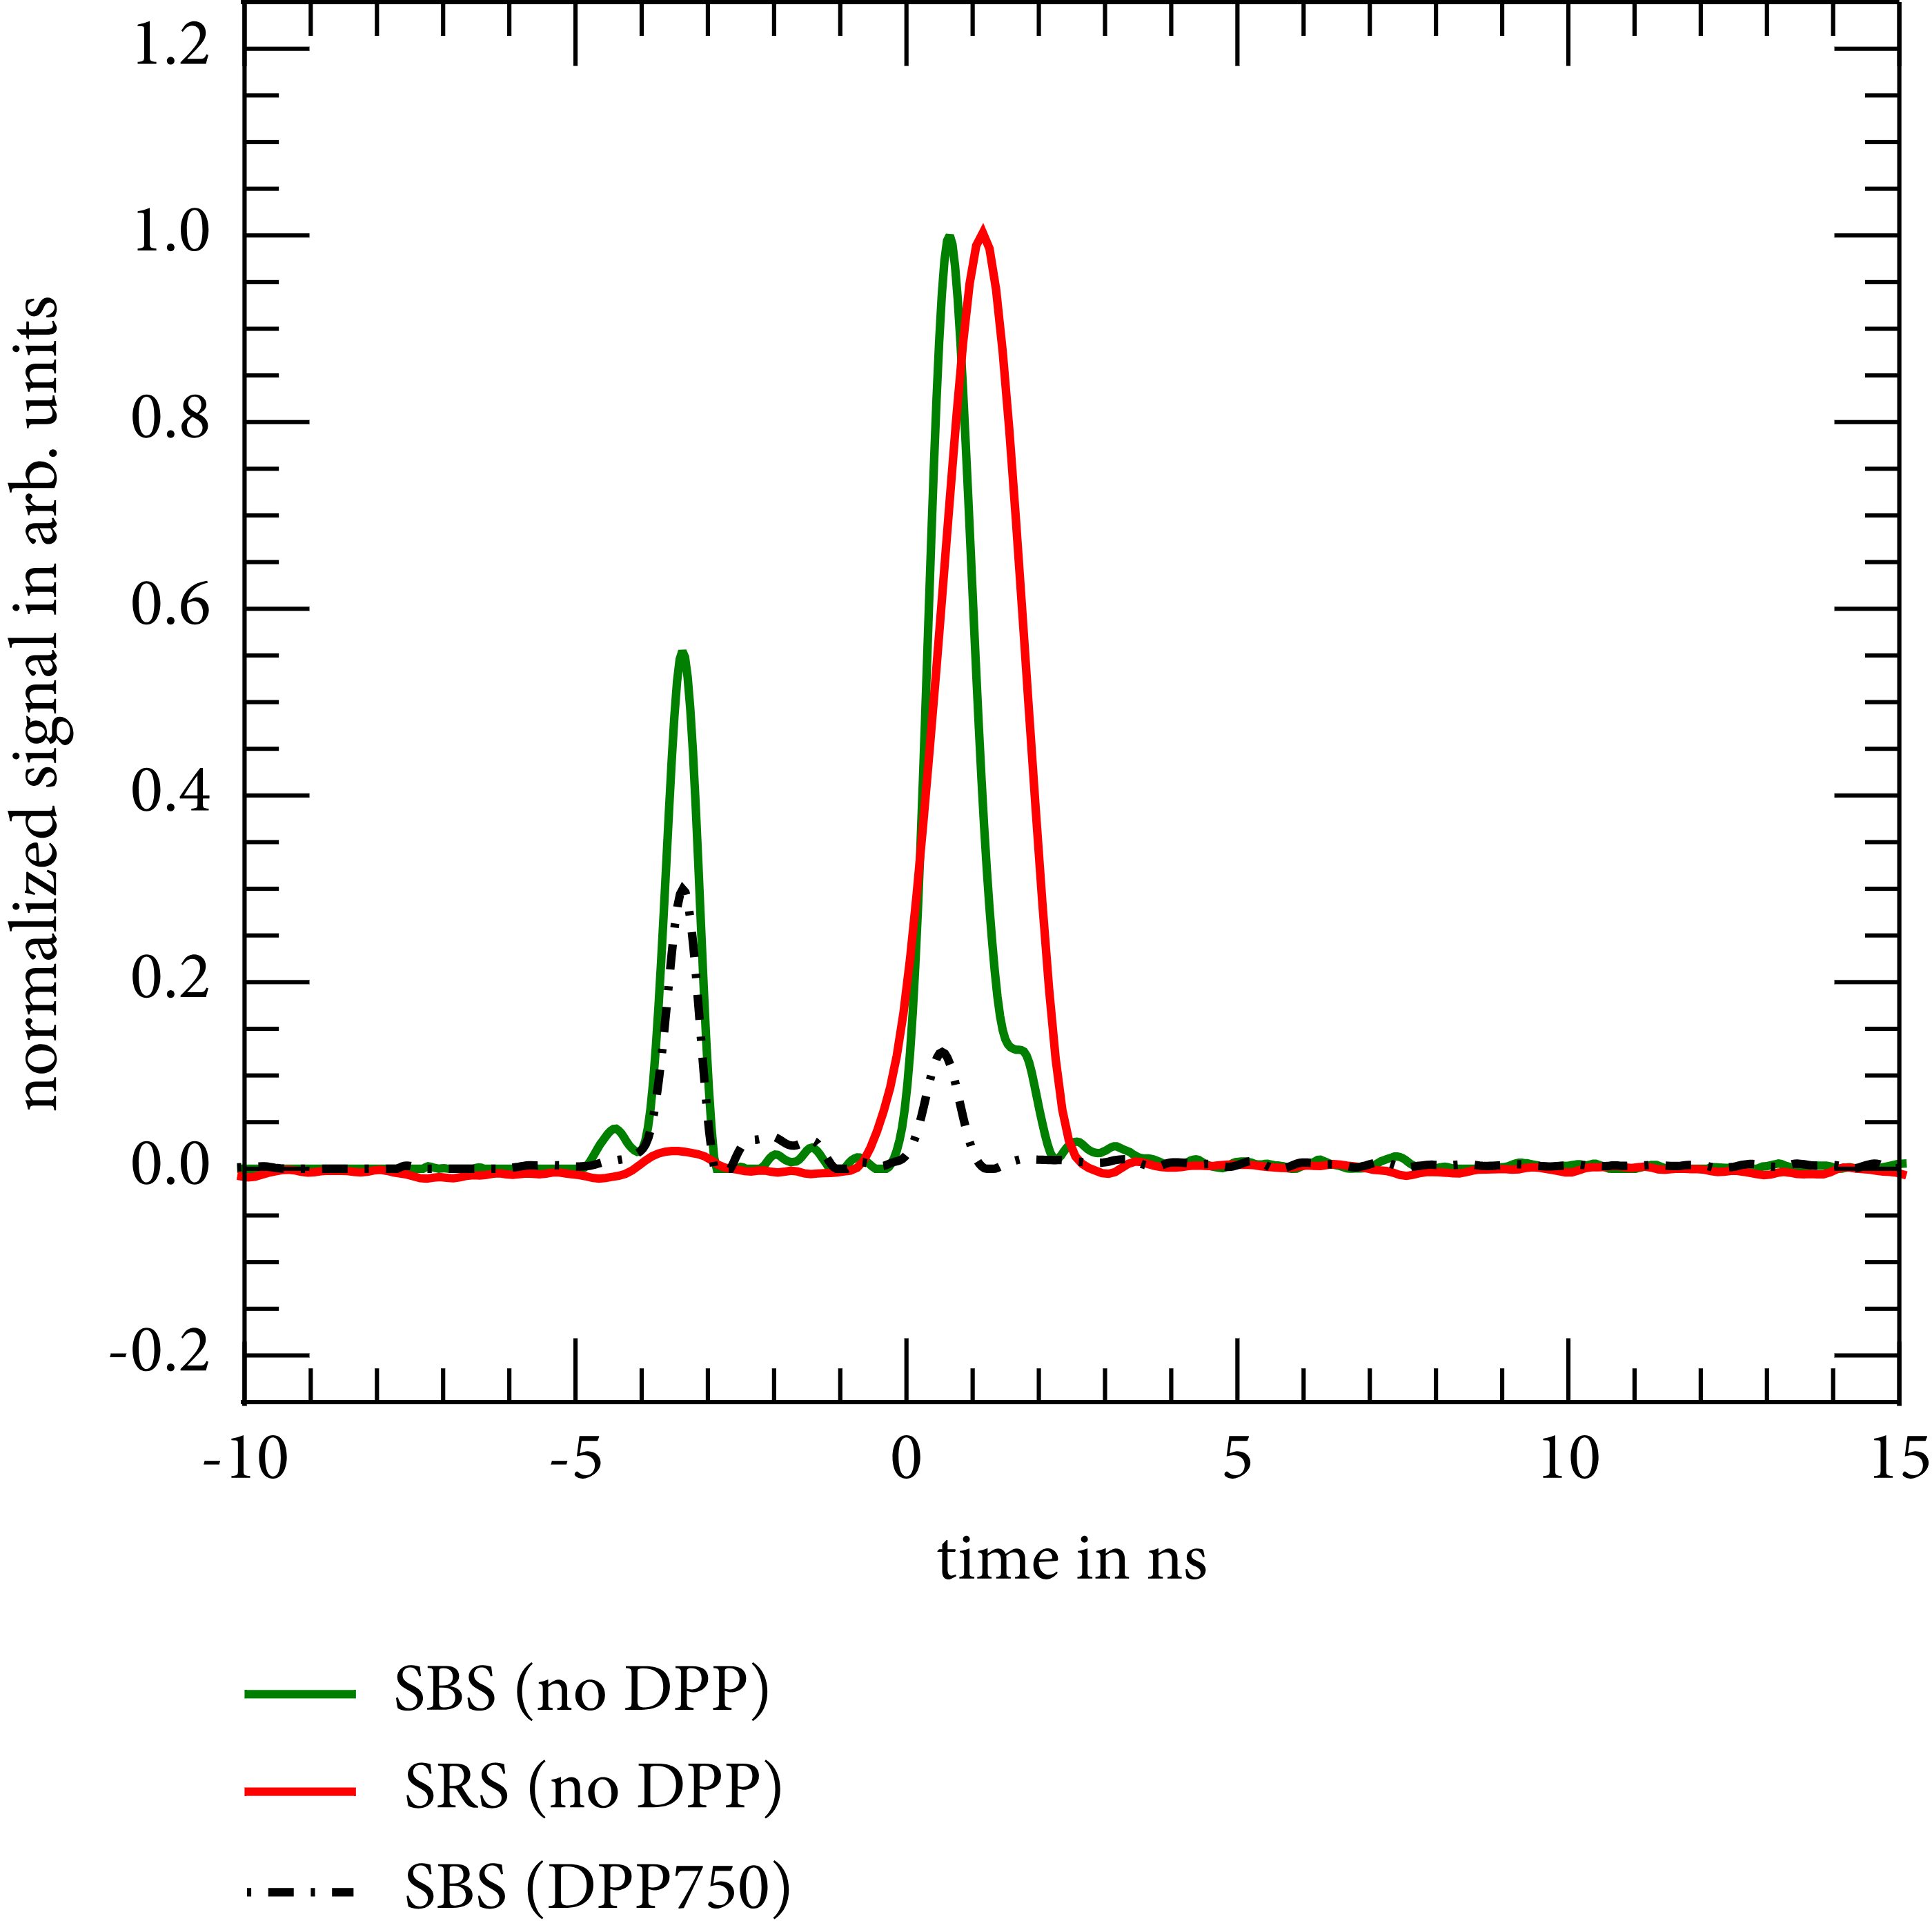
FIGURE 5: Comparison of SRS and SBS traces for a shot without phase plate next to a trace from a shot with DPP750. The signals for the no-DPP shot are normalized peak at 1.0, while the DPP750 trace is scaled in proportion to its no-DPP counterpart.
3.1. SRS Measurements
As expected from comparisons to literature and early NEWLIP simulations [Reference Geissel, Harvey-Thompson and Awe2], the laser energy that is transferred to the Raman backscatter is very low. Estimates using the sensitivity and filter attenuation of the detectors along with a calibration at 527 nm wavelength resulted in values below 10 J even for the worst cases, though there is a large uncertainty in this estimate (>100%). Typical values should stay below one joule of backscattered SRS. The measured SRS seems unaffected by the laser spot size on target or the pulse length, but the measurements imply an exponentially growing dependence on the total laser energy. Figure 6 compares a number of experiments with and without phase plates for both helium and deuterium.
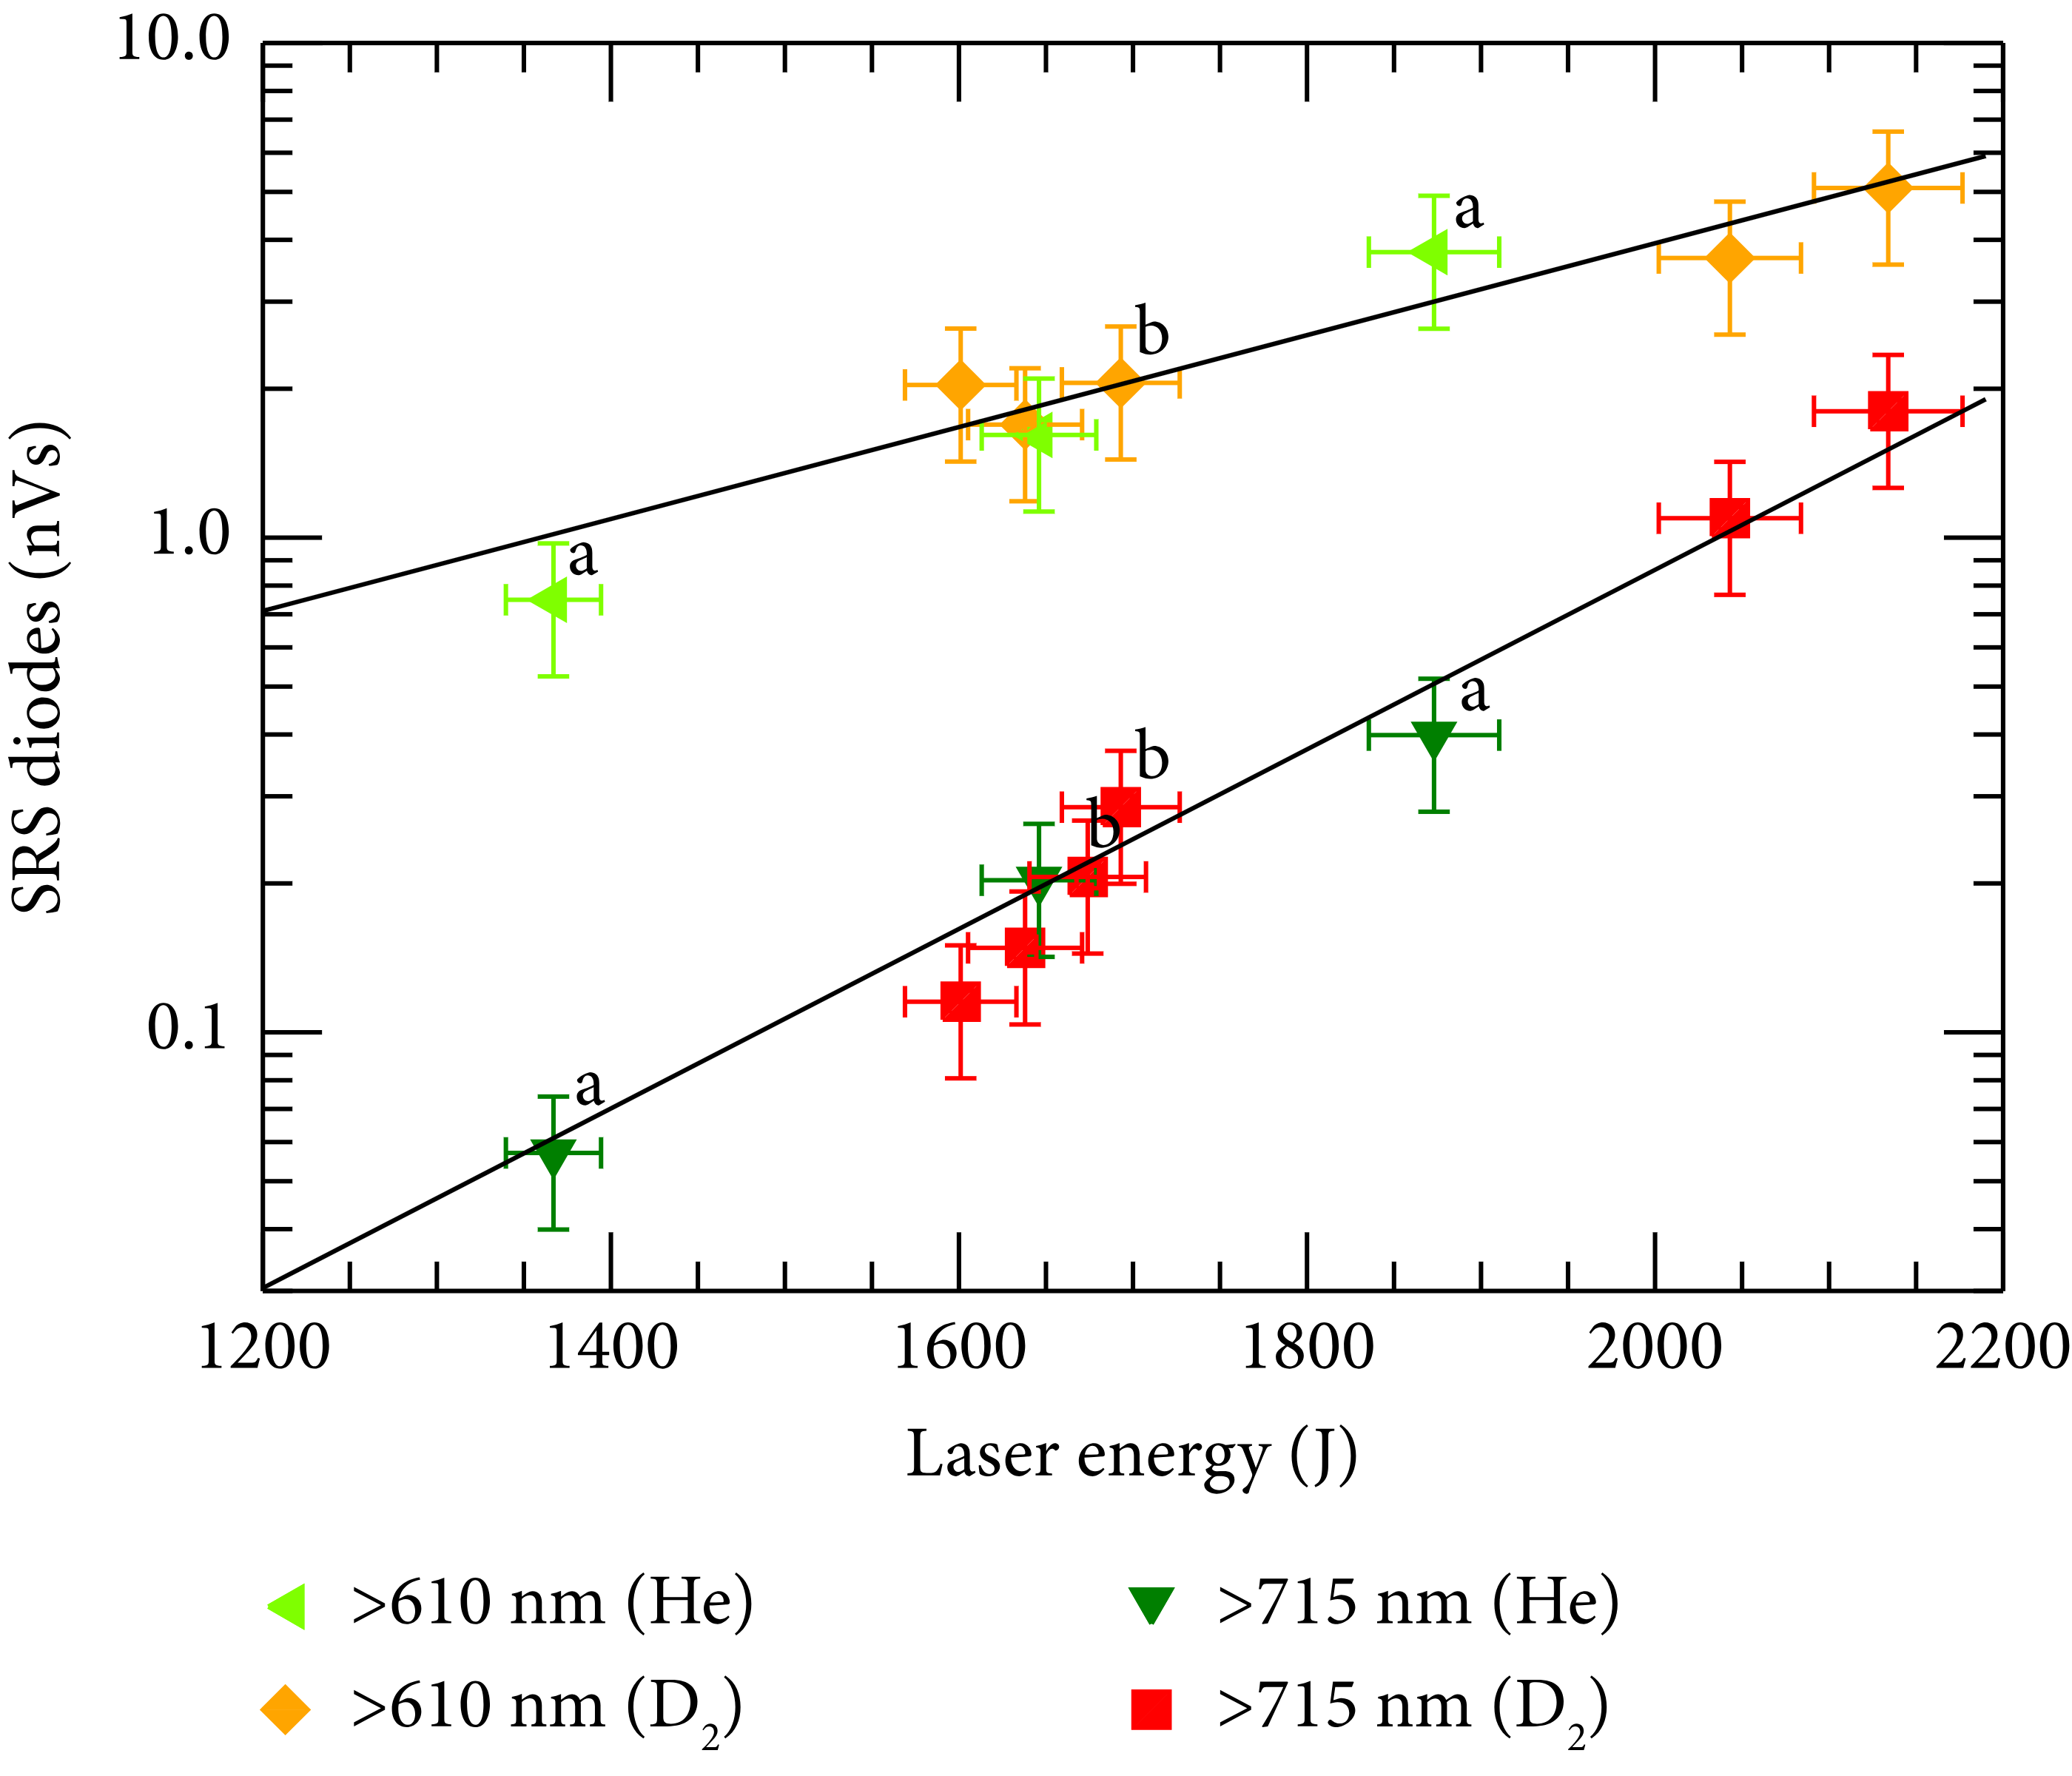
FIGURE 6: SRS backscatter data for He and D2. Experiments were performed without DPP unless marked (a: DPP750 and b: DPP1100). Pulse shapes followed the configuration recipe given in Table 2. The black lines represent exponential fits.
It is unclear why SRS would be growing nonlinearly with energy but be insensitive to intensity. A plausible explanation could be a combination of multiple effects: the strongly heated axial region of the target can create an electron density profile with focusing qualities, similar to the case of laser filamentation in dense gases [Reference Froula, Divol and Meezan23]. Therefore, the propagation of the laser will no longer follow the original envelope associated with the focusing optics, and the size of the heated channel may depend on the overall power and heat conductivity, thus reducing the relevance of the focal spot area. Additionally, high intensities yield higher temperatures, causing a loss in SRS efficiency due to increased Landau damping and lower electron density (rarefaction). It is not surprising that the measurements are insensitive to the ion species, since neither the charge nor mass of the ion directly affect SRS, and the differences in density are within the error bars.
Side-scatter studies proved ambiguous at this time. Pronounced, transversal “wings” or flares in the shadowgraphs, which protruded further into the gas than one would expect from a blast wave, appeared frequently but only in an s-polarized view (see Figure 7 details). This could imply side scatter, and it is consistent with the polarization dependence of the side-scatter mechanism, but the phenomenon could not be reproduced reliably.
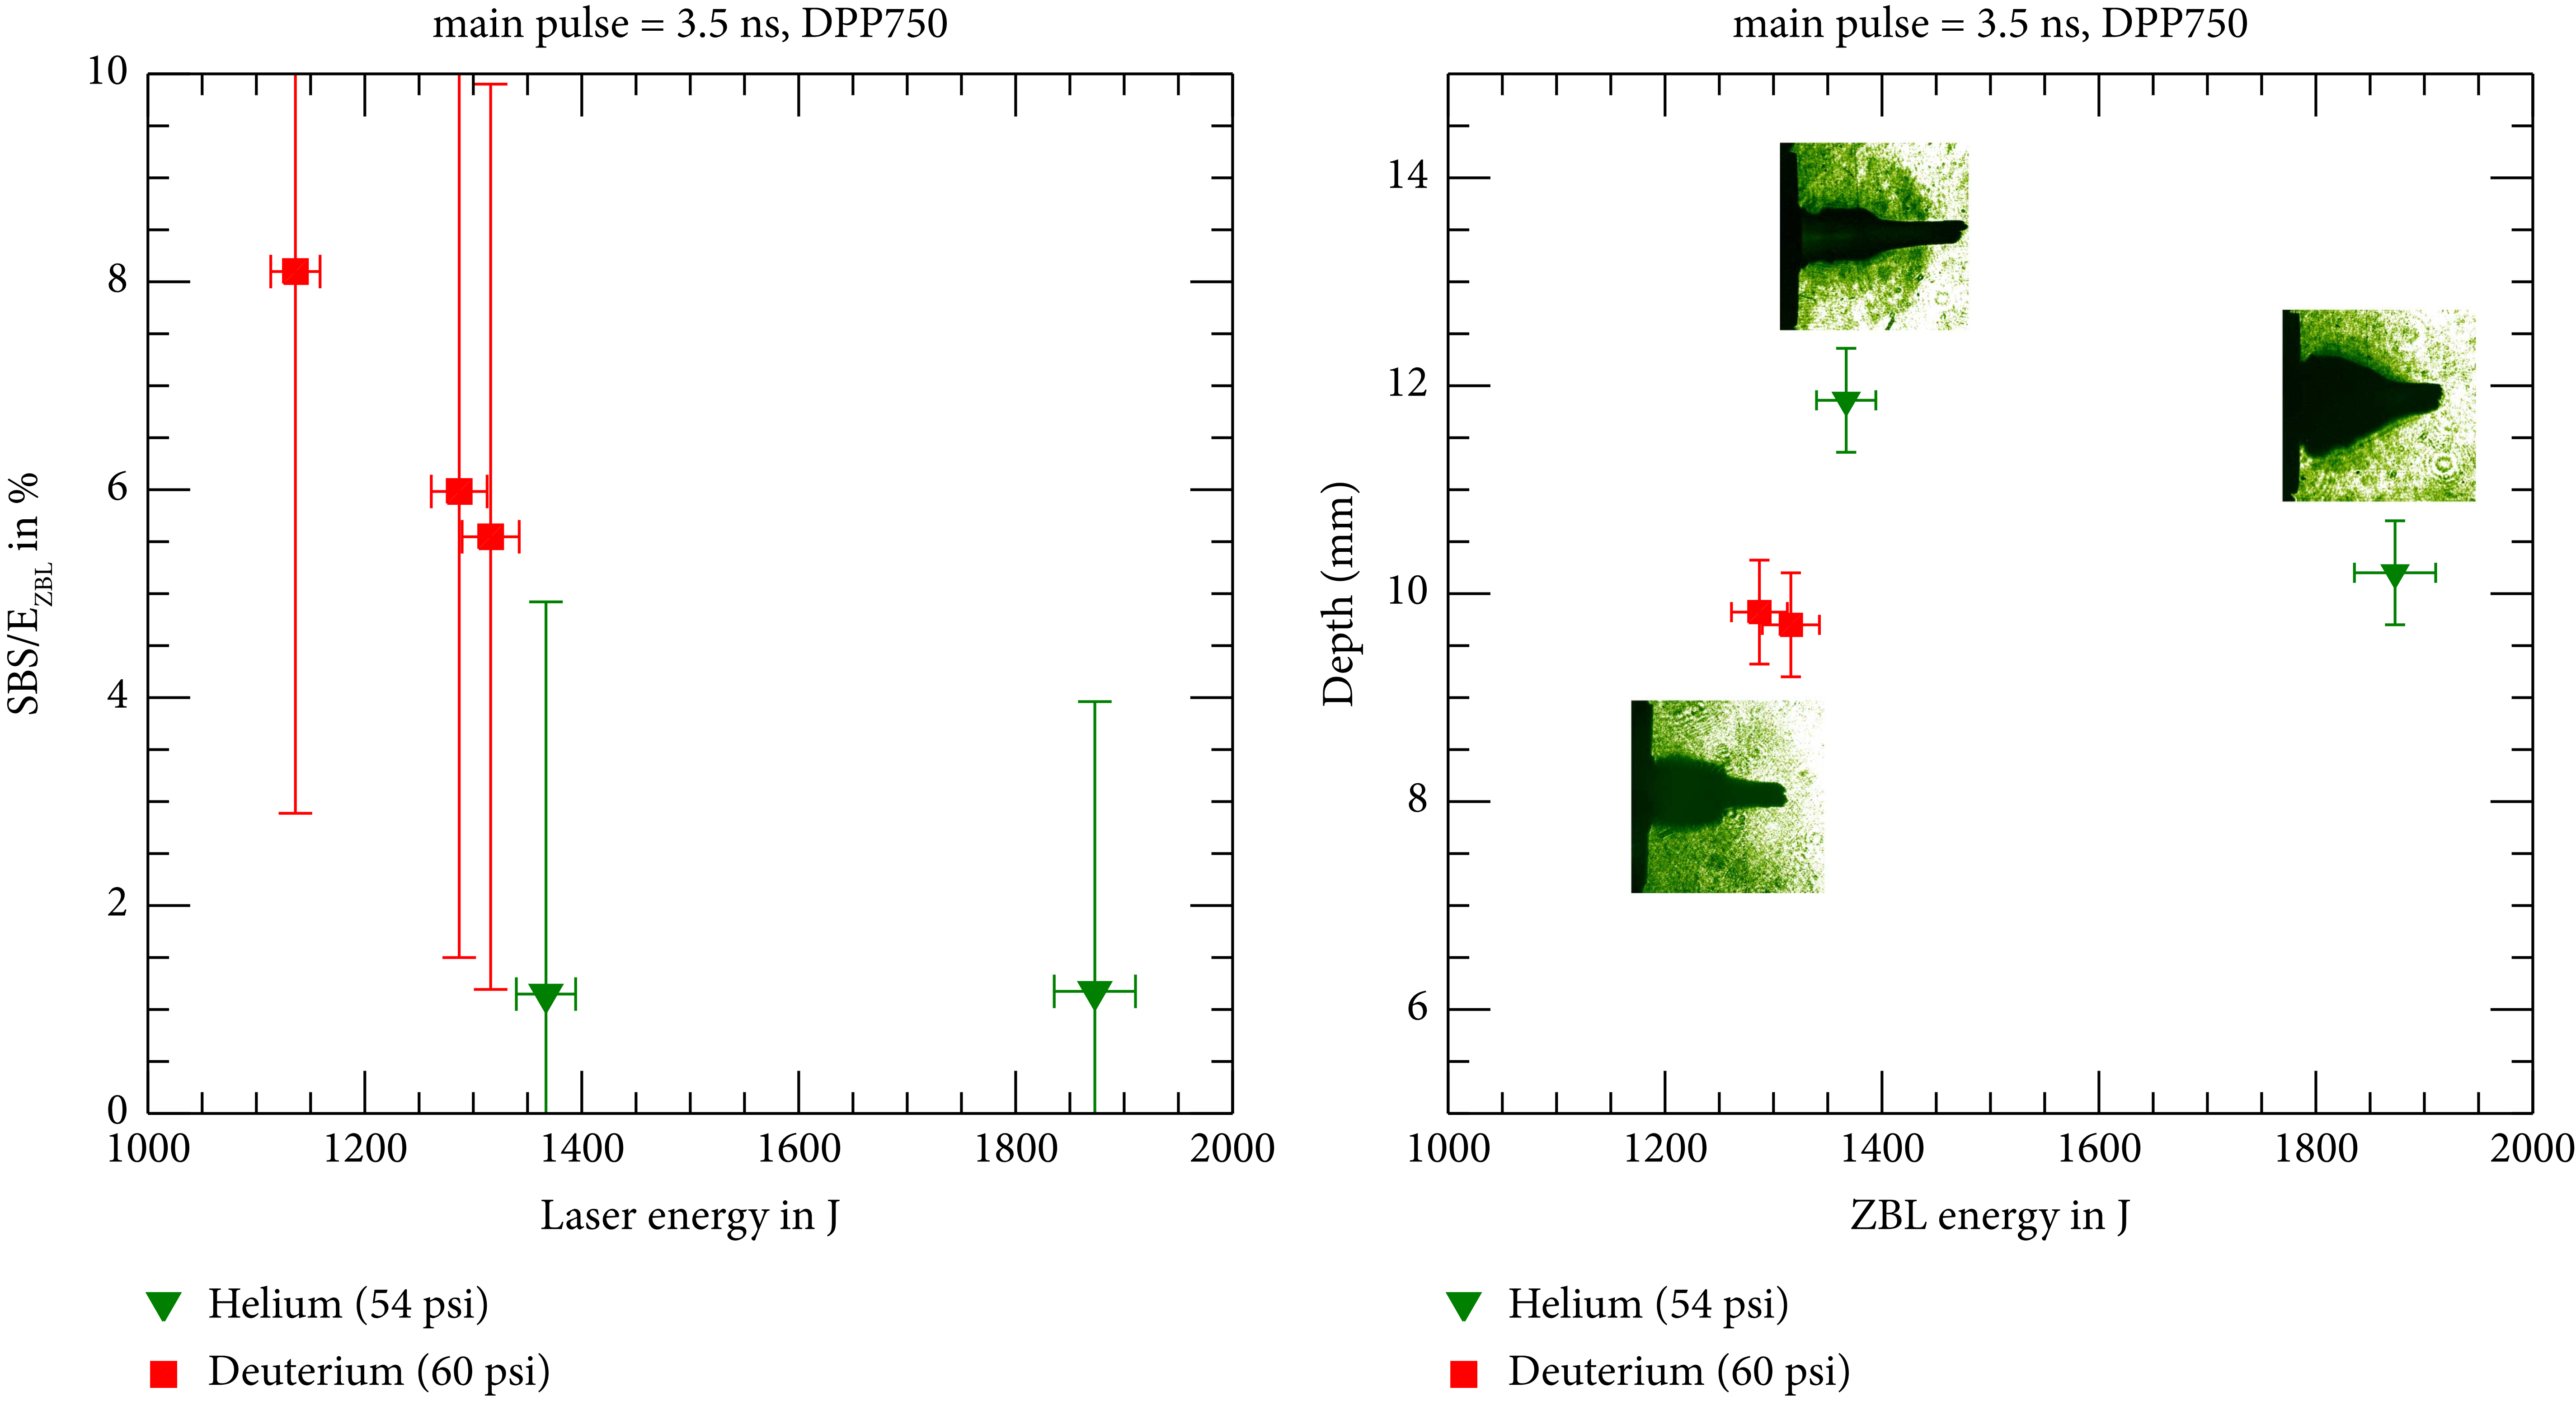
FIGURE 7: Dataset for laser shots with configuration 2 from Table 2. Note that a depth data point for deuterium is missing due to diagnostic malfunctions. The depth plot includes shadowgraph inserts with the laser entering from the right and the blast wave casting a dark shadow.
3.2. SBS Measurements
In contrast to SRS, the results for SBS are closer to what might be anticipated from first principles. Stimulated Brillouin scattering was observed strongest for unconditioned shots of high intensities as described by configuration 1 in Table 2. The fraction of SBS increases with intensity, and helium fills consistently yield more SBS than deuterium fills, which is expected due to higher Landau damping for deuterium. Figure 8 shows the data for SBS with configuration 1. Shots in helium tend to result in shorter propagation depths of the laser-heated region into the gas with increased total laser energy. This implies that SBS and other loss mechanisms increase so strongly that the additional pulse energy cannot compensate for the losses. This tendency is not pronounced for deuterium. Although the fraction of SBS losses in helium is higher by roughly 10 percentage points compared to deuterium, the propagation depth of the laser into the gas is similar to deuterium. This can be explained at least partially by the 10% lower fill pressure of the helium targets compared to deuterium.
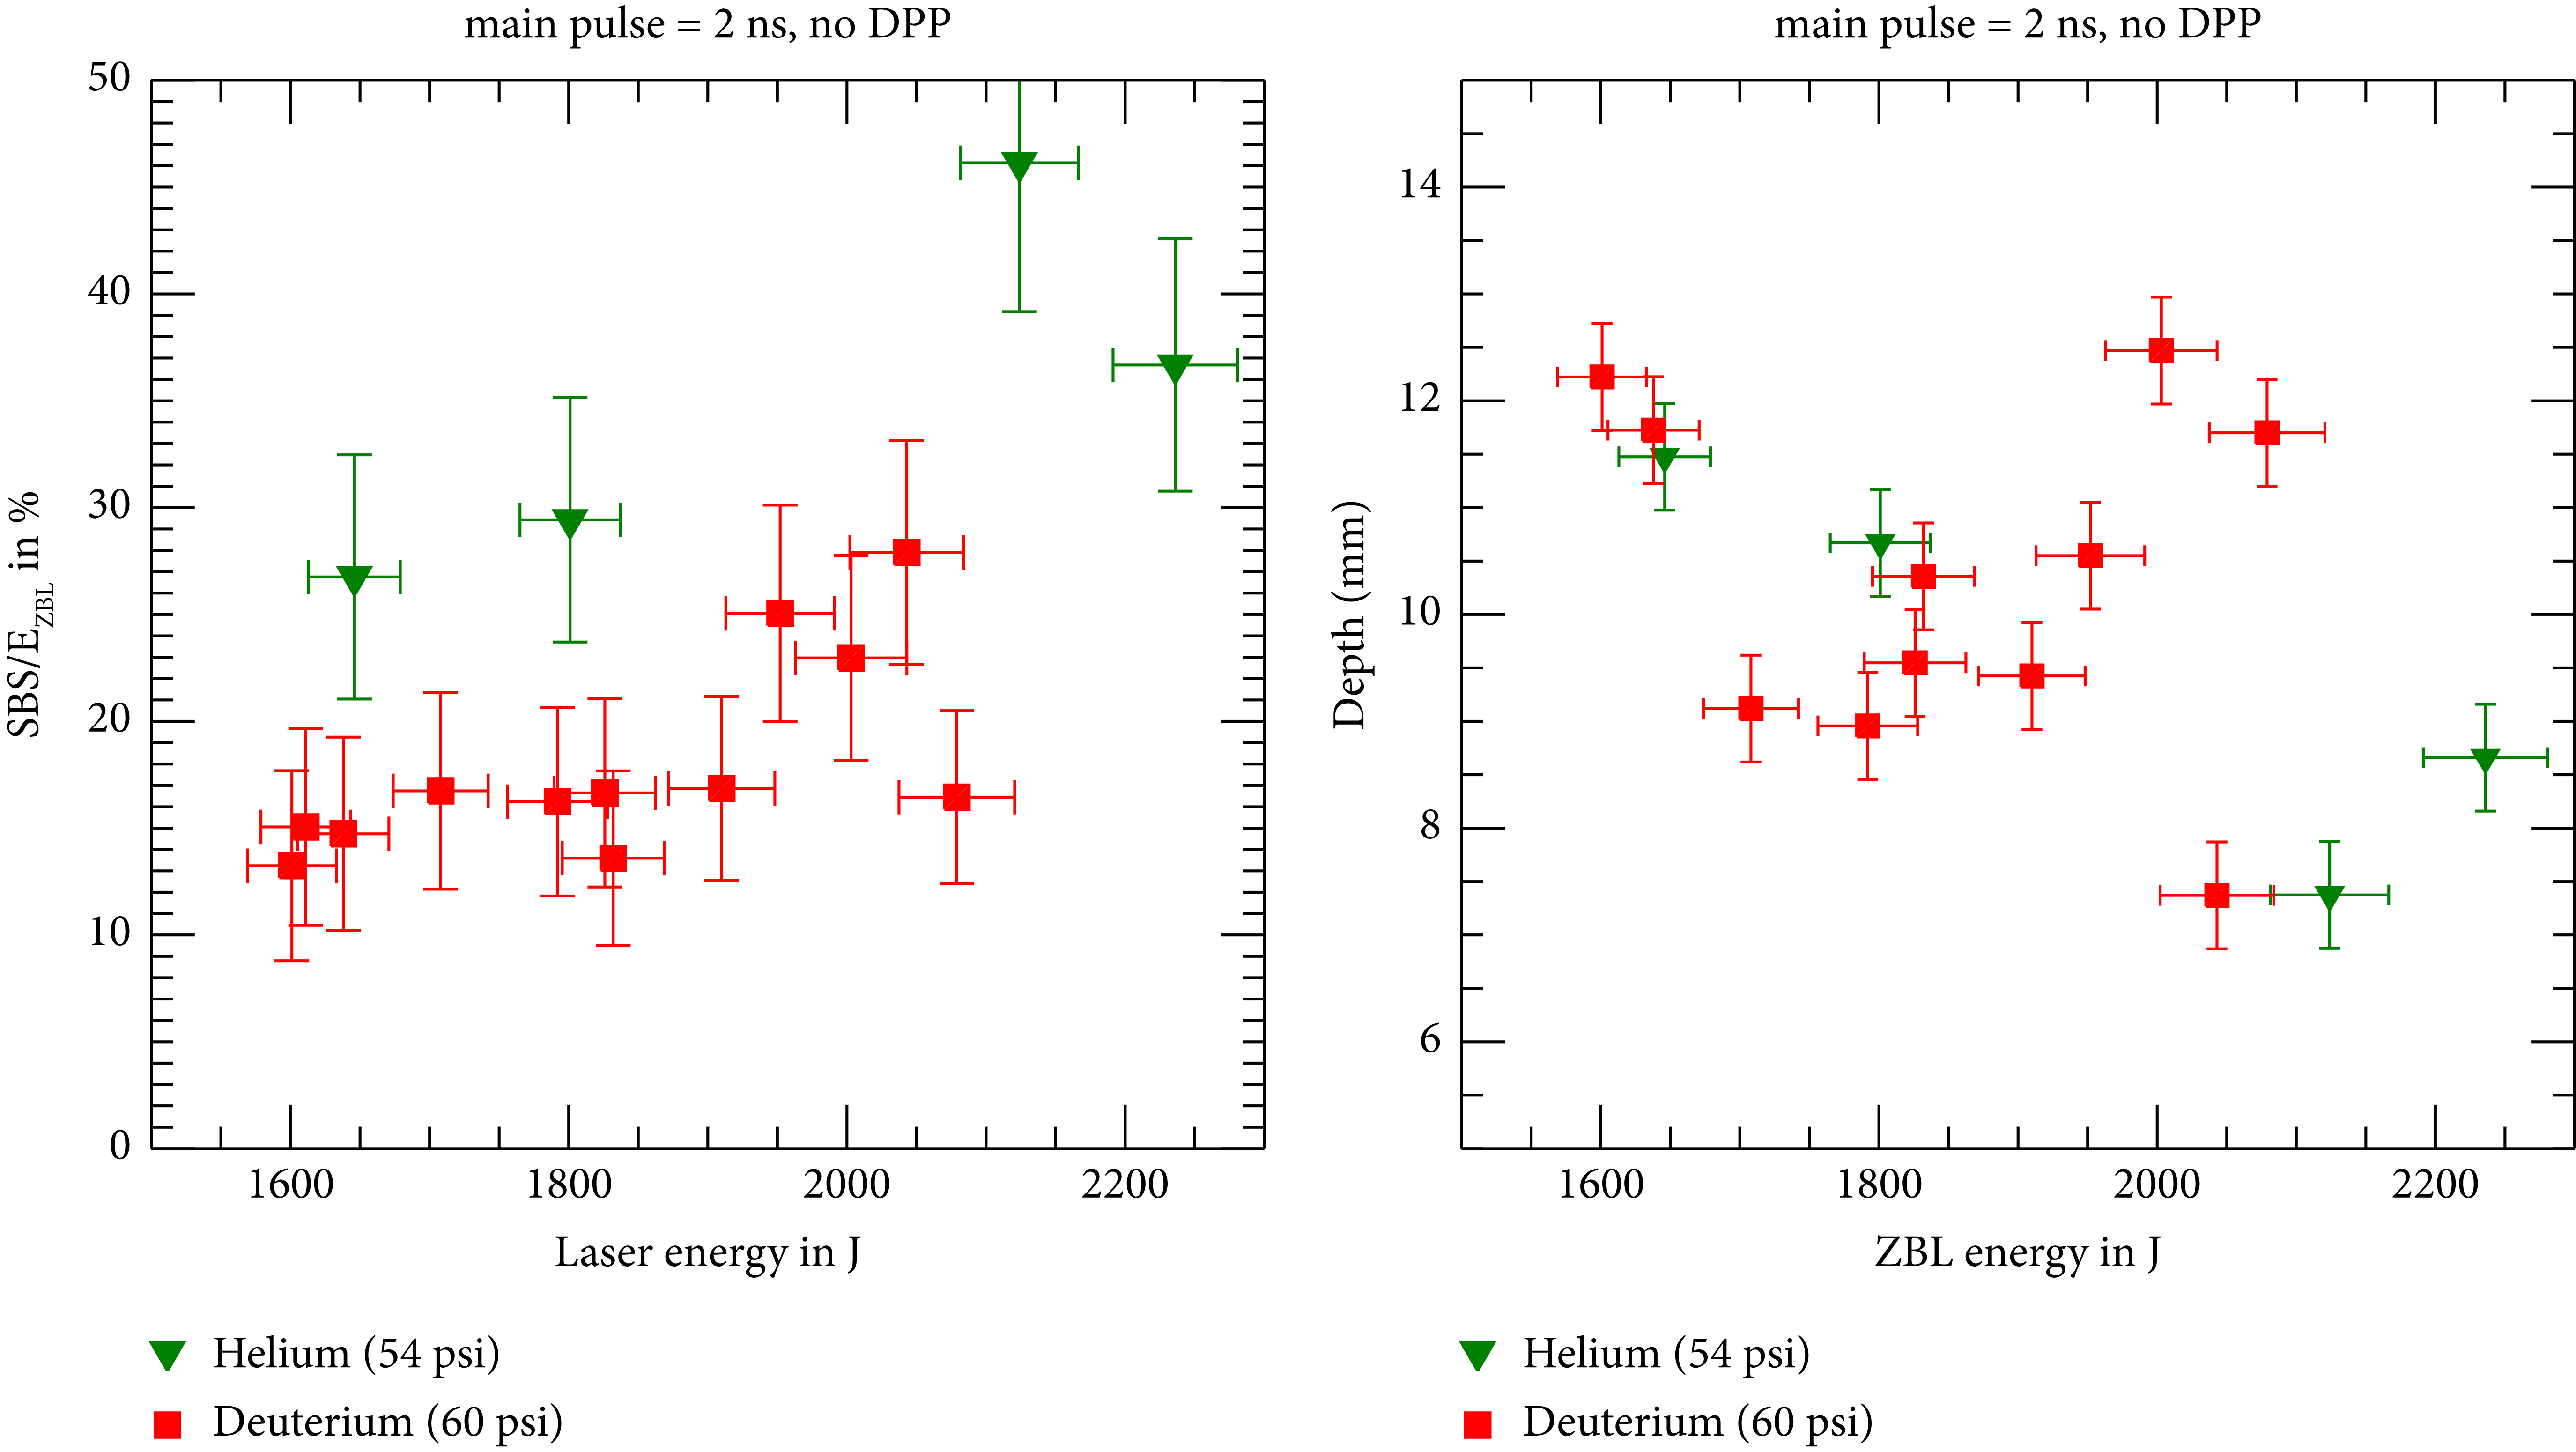
FIGURE 8: Dataset for laser shots using configuration 1 from Table 2.
The next lower-intensity scenario is configuration 2 of Table 1, using the 750 µm wide phase plate. While the current dataset is not complete and lacks overlap between helium fills and deuterium fills in terms of total laser energy, it seems that helium fills yield less SBS reflectivity (∼1% at 1.37 kJ and 2 kJ) than deuterium (6–8% at <1.35 kJ) as shown in Figure 7. An explanation for the SBS data could be that in this regime, Landau damping is no longer relevant, but the overall density is lower leading to less SBS. Higher laser energies led to shorter laser propagation in helium despite the low SBS values. At this time, we can only speculate that additional LPI caused this effect. Such losses could be SRS or side scatter. The latter might be observable as conical “wings” in the first shadowgraphy frames (directly after the end of the heating laser pulse), which are inserted in Figure 7. As mentioned in the SRS results section, such wings can be observed frequently for experiments with high-to-medium LPI in s-polarized view (see Figure 4).
The lowest intensities (configuration 3) with an 1100 µm diameter phase plate almost eliminated SBS, and no measurable difference between helium and deuterium can be seen, which is plotted in Figure 9. Also, laser propagation depth increases almost linearly with laser energy. A good approximation is a depth increase following ![]() , which is not too far from basic absorption wave propagation estimates of ∼
, which is not too far from basic absorption wave propagation estimates of ∼ ![]() for a given pulse length [Reference Atzeni and Meyer-Ter-Vehn14, Reference Denavit and Phillion24].
for a given pulse length [Reference Atzeni and Meyer-Ter-Vehn14, Reference Denavit and Phillion24].
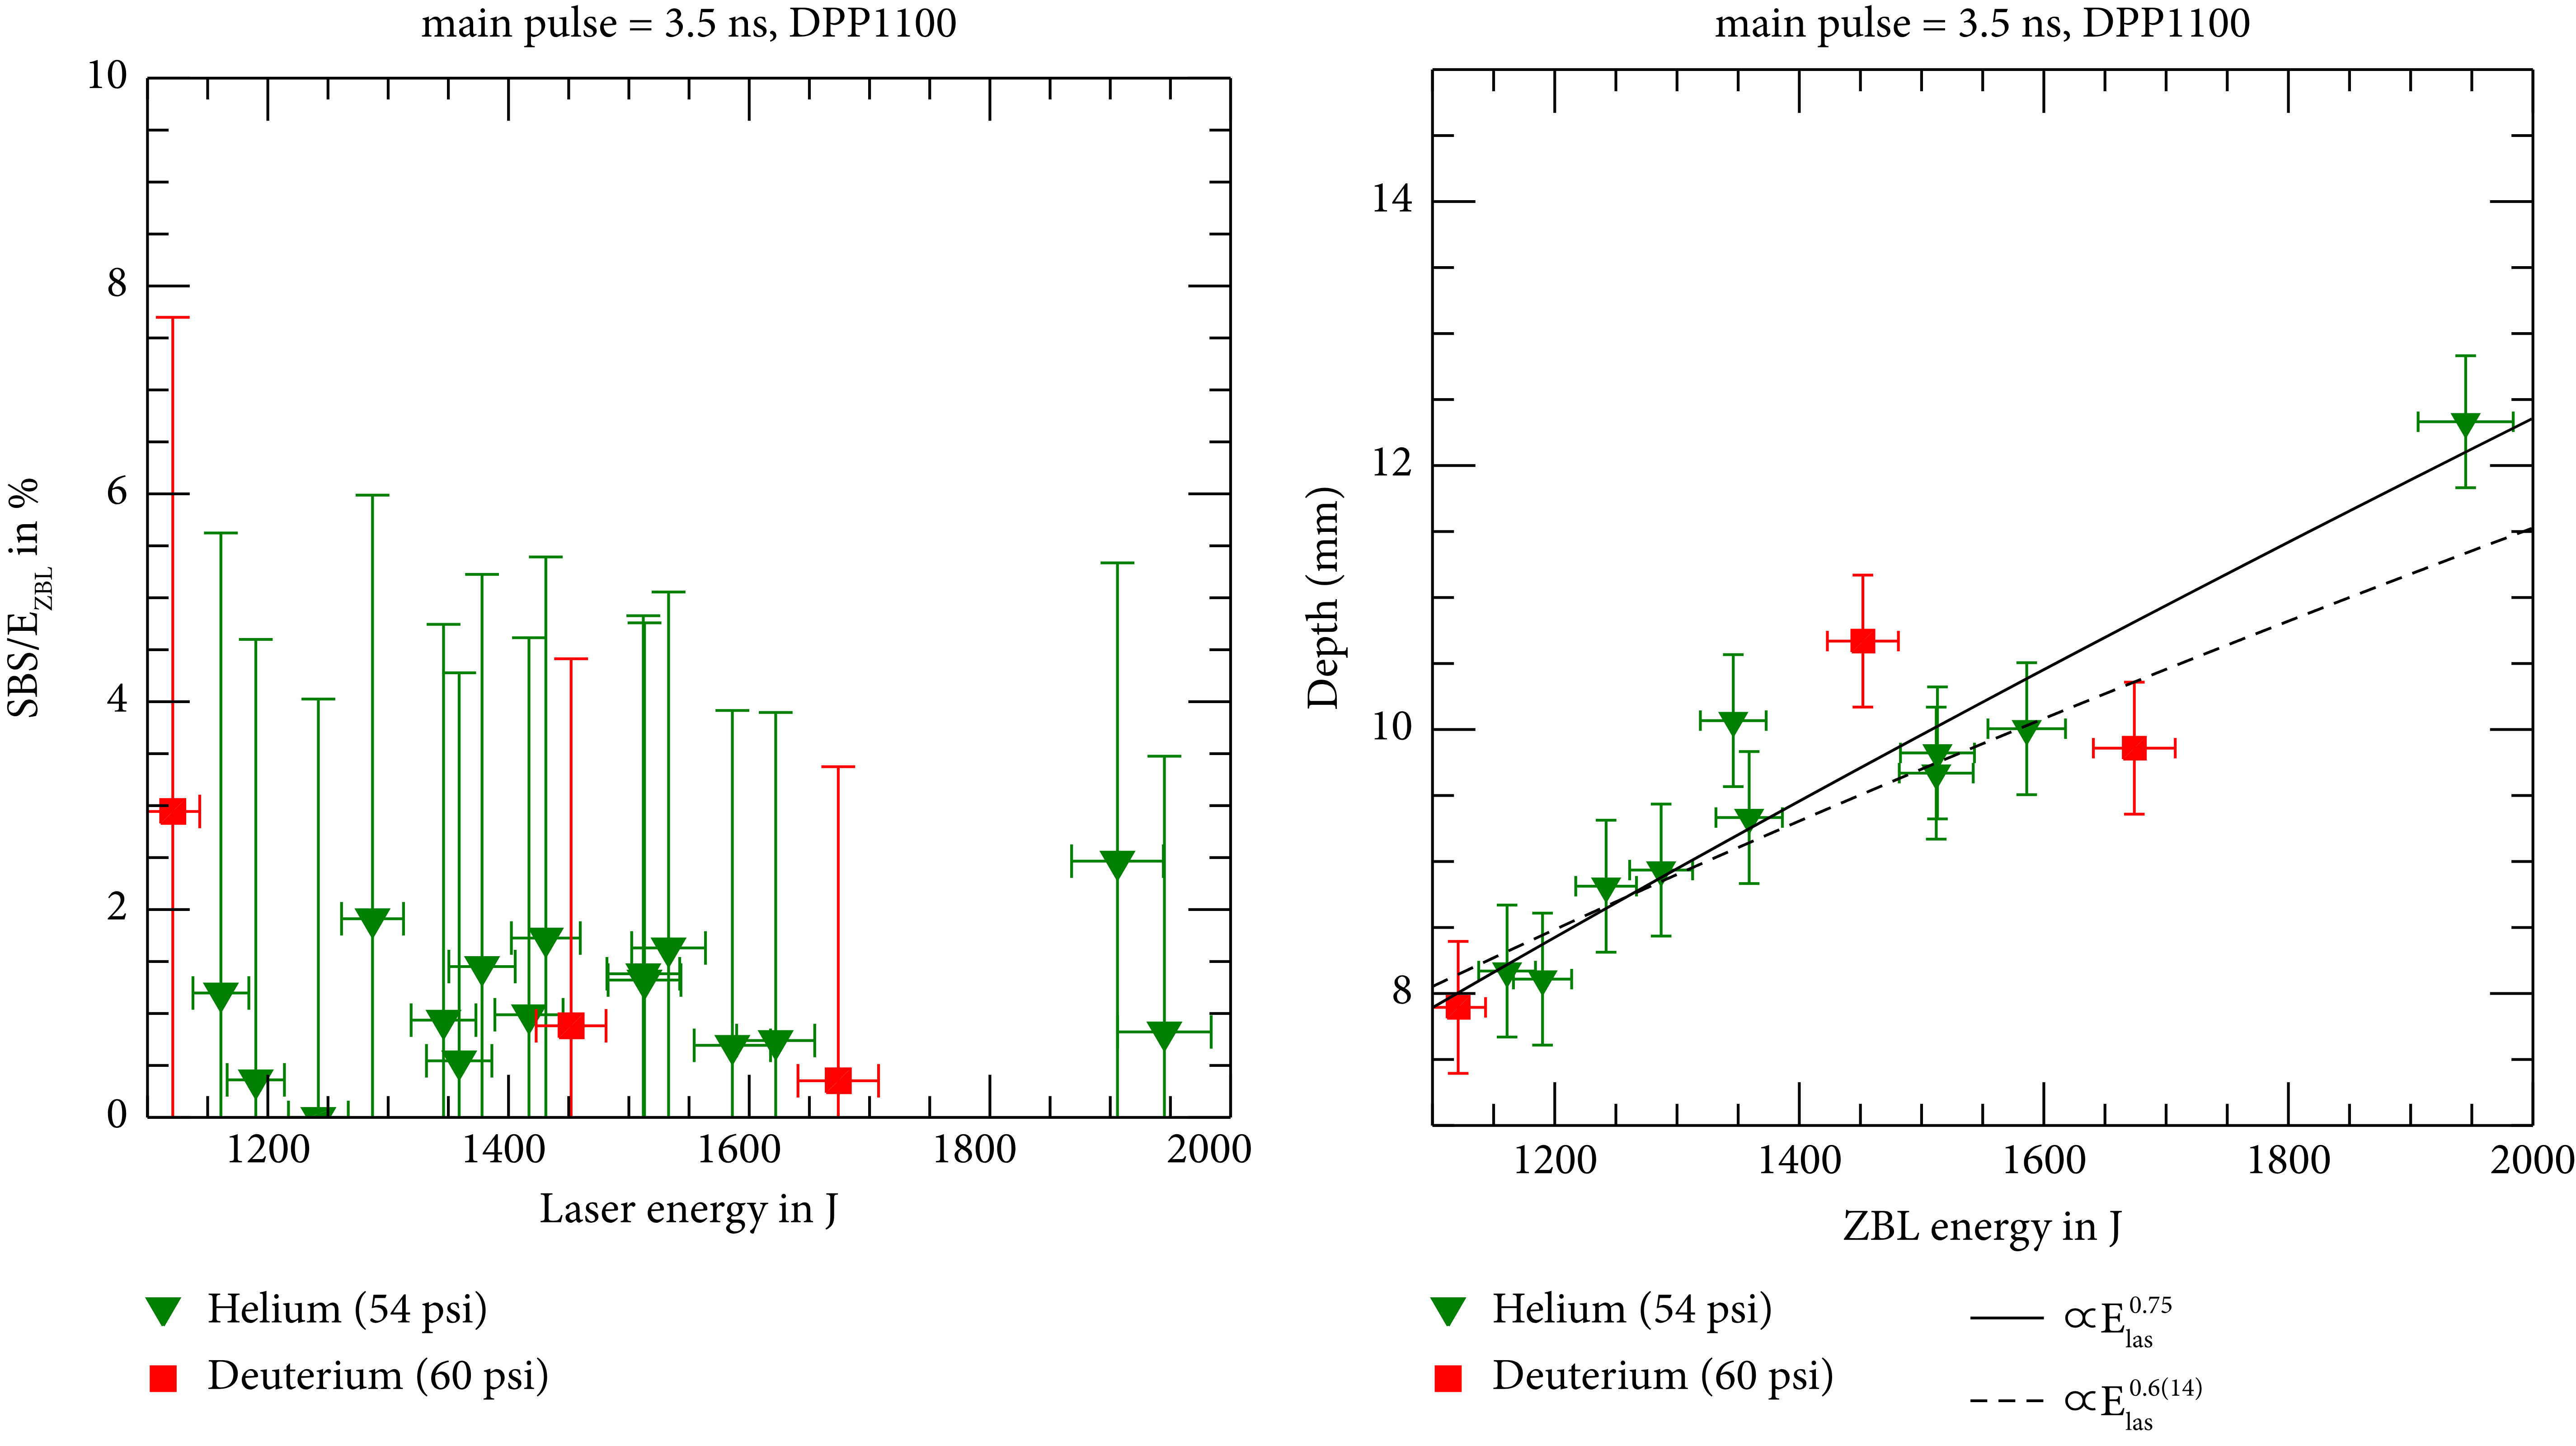
FIGURE 9: Dataset for laser shots with configuration 3 from Table 2.
4. Conclusions
Using helium as a low-hazard substitute for deuterium in laser-heating experiments is a plausible measure, but some caveats exist. Quantitative data for high-LPI regimes will only be accessible with the correct gas type, and the propagation depth can only be matched if the density is modified, which, in turn, will affect moderate-to-high LPI. The findings of this study do not include data for gases such as argon or neopentane, but the underlying physics for the findings will clearly apply in those cases as well.
Data Availability
Data for this study can be accessed upon request by contacting mgeisse@sandia.gov, with the caveat that raw data first need to be officially released by a derivative classifier of Sandia National Laboratories.
Disclosure
This study describes objective technical results and analysis. Any subjective views or opinions that might be expressed in the paper do not necessarily represent the views of the U.S. Department of Energy or the United States Government.
Conflicts of Interest
The authors declare that there are no conflicts of interest.
Acknowledgments
Sandia National Laboratories is a multimission laboratory managed and operated by National Technology and Engineering Solutions of Sandia, LLC., a wholly owned subsidiary of Honeywell International, Inc., for the U.S. Department of Energy’s National Nuclear Security Administration under contract DE-NA0003525.


