Introduction
China is experiencing a rapid and intense aging process and has the largest aging population in the world. By the end of 2018, its population with elderly aged 60 years or above (locally defined age cutoff for the elderly) reached 249.49 million, accounting for 17.9% of the total population (National Bureau of Statistics, 2019). The expansion of the elderly population, especially older seniors, likely causes a substantial increase in nonproductive consumption expenditures, such as medical treatment, nursing, and old age security. Therefore, healthy aging is crucial to sustainable development.
Depression (major depressive disorders) is a major public health issue affecting the health of the elderly population in China. According to a nationwide survey, China Health and Retirement Longitudinal Study (CHARLS), about 40% of older adults reported depressive symptoms (CHARLS Research Team, 2013). In addition, the proportion of “empty-nesters,” i.e. those who were not living with their children, has increased remarkably, and the number is still rising (Gao et al., Reference Gao2017). This group is more likely to suffer from mental health problems (Su et al., Reference Su, Cao, Zhou, Wang and Xing2018). In contrast to depression in the younger population, depression in late life is associated with decreased physical, cognitive, and social functioning and increased self-neglect (Ni et al., Reference Ni, Tein, Zhang, Yang and Wu2017). Moreover, depression in late life can lead to chronic disease course, poor response to antidepressants, and high relapse rate, which are associated with increased mortality (Van Orden et al., Reference Van Orden, Chen, O’Riley and Conwell2015; Haigh et al., Reference Haigh, Bogucki, Sigmon and Blazer2018). Consequently, the issue of depression among Chinese elderly population should be settled urgently.
Some sociodemographic factors, such as gender, age, marital status, place of residence, employment status, and educational level, have been reported to be associated with depression in the elderly population (Chin et al., Reference Chin, Choi and Wan2016; Yang et al., Reference Yang, Chen, Hu and Ren2017; Cao et al., Reference Cao, Luo, Hou, Yang and Ren2016). Negative life events, multiple chronic health conditions, major physical diseases, and poor self-rated general health in older people can also increase the risk of depression (Alexandrino-Silva et al., Reference Alexandrino-Silva, Alves, Tofoli, Wang and Andrade2011). However, studies have yet to adopt a structural equation model (SEM) for exploring the relationships between factors and depressive symptoms, which are the major manifestations of depressive disorders. SEM is a multivariate analysis technique used to ascertain relationships among variables and provide a comprehensive and flexible approach for data analysis (Crowley and Fan, Reference Crowley and Fan1997). It enables the simultaneous estimation of structural relationships among multiple independent and dependent variables while controlling measurement errors; it can also identify direct, indirect, and total effects among variables (Pentz and Chou, Reference Pentz and Chou1994). Given these advantages, this study aimed to establish an SEM to analyze the structural relationships of depressive symptoms and associated factors among the elderly population in China.
Methods
Sample
The publicly available data of CHARLS collected in 2015 were used. CHARLS is an ongoing longitudinal study assessing the social, economic, and health status of nationally representative samples of middle-aged and elderly Chinese residents. In CHARLS, a multi-stage stratified probability-proportional-to-size (PPS) sampling method is adopted, and the software package CHARLS-GIS is created to make village sampling frames. Data were collected through face-to-face interviews by trained investigators. The response rate was over 85% (CHARLS, 2018). After participants younger than 60 years and participants with missing values on the main outcome variables were removed from the study, a total of 5791 samples were retained.
Study variables
Based on the content of “CHARLS Followup Questionnaire 2015” (CHARLS, 2018) and our literature review, 16 observational variables were included in this study, and we hypothesized that four latent variables could be extracted and used to collectively reflect the sociodemographic characteristics, poor health status, unhealthy habits, and sleep duration of the participants. The hypothetical latent variables and the corresponding observational variables are presented in Supplementary Table 1. For the sociodemographic characteristic factor, household consumption expenditure in the previous year rather than household income was used to reflect the economic status of the participants because it was a better representation of the permanent income of the retired and the elderly (Islam and Smyth, Reference Islam and Smyth2015). For the poor health status factor, the activity of daily living scale, which was recommended by the World Health Organization for assessing the health status of the elderly population, was used to assess the participants’ ability to perform daily living activities (Katz et al., Reference Katz, Ford, Moskowitz, Jackson and Jaffe1963).
Assessment of depressive symptoms
Depressive symptoms were quantified using the 10-item version of the Center for Epidemiologic Studies Depression Scale (CES-D-10), which accurately predicts depressive symptoms (Andresen et al., Reference Andresen, Malmgren, Carter and Patrick1994). The Chinese version of this scale has good reliability and validity among the elderly population in China, and Cronbach’s alpha was 0.813 (Huang et al., Reference Huang, Wang and Chen2015).
The 10 items were as follows: item 1, “I was bothered by things that do not usually bother me;” item 2, “I had trouble keeping my mind on what I was doing;” item 3, “I felt depressed;” item 4, “I felt everything I did was an effort;” item 5, “I felt hopeful about the future;” item 6, “I felt fearful;” item 7, “My sleep was restless;” item 8, “I was happy;” item 9, “I felt lonely;” and item 10, “I could not get going.” Each item was rated on a 3-point Likert scale with answers varying from “rarely or none of the time (<1 day)” to “most or all of the time (5–7 days).” Thus, the total score of the CES-D-10 scale ranged from 0 to 30. A score of 10 or higher indicated the presence of significant depressive symptoms.
Statistical analysis
Stata/SE version 15.1 was used for preliminary data processing and descriptive statistics of the demographic variables and depressive symptoms. SEM was created by using Mplus version 7.4 to test the hypothetical associations among the variables. Confirmatory factor analysis (CFA) was first conducted to test whether the latent variables could be well reflected by the involved observational variables. Based on the measurement model, SEM was then utilized to examine the associations among latent variables and depressive symptoms.
All continuous variables were converted to categorical variables before they were analyzed. The correlation matrix of the study variables was examined using Pearson’s correlation coefficients. Weighted least squares with the mean and variance (WLSMV)-adjusted method were used for the parameter estimation of CFA and SEM. All the effects were quantified with standardization, and two-sided P < 0.05 was regarded as statistically significant. Four goodness-of-fit indices: maximum likelihood chi-square (χ 2 ) and degrees of freedom (df), comparative fit index (CFI), Tucker–Lewis index (TLI), and root mean square error of approximation (RMSEA) were adopted to check whether the hypothesized model was well fitted to the data. The value of χ 2 is susceptible to sample size, and it is statistically significant for models with large sample size (Bollen and Long, Reference Bollen and Long1993). The value of CFI or TLI for a good fitting model should be 0.90 or greater (Hu and Bentler, Reference Hu and Bentler1999). And a model is considered excellent fit when RMSEA value is less than 0.05 (Bollen and Long, Reference Bollen and Long1993).
Results
Participants and depressive symptoms
Of the 5791 participants, 55.53% were males (n = 3216), and their mean age was 68.82 years (standard deviation, 6.86; range, 60–102). Nearly two-thirds of the participants were living with their spouses, and the remaining participants were married but were temporarily not living with their spouses, separated, divorced, widowed, or never married. Most of the participants resided in a village. Nearly half of the participants’ educational levels were elementary school or below, followed by illiterate. More than half of the participants reported that their household consumption expenditure per capita was within 2,000 RMB. The detailed sociodemographic characteristics and corresponding prevalence of the depressive symptoms of the participants are summarized in Table 1. As shown in Table 1, the total prevalence of depressive symptoms was 37.52%. The participants with different genders, marital status, residence, and educational levels showed a significant difference in the prevalence of depressive symptoms (P < 0.001).
Table 1. Sociodemographic characteristics of participants and depressive symptoms
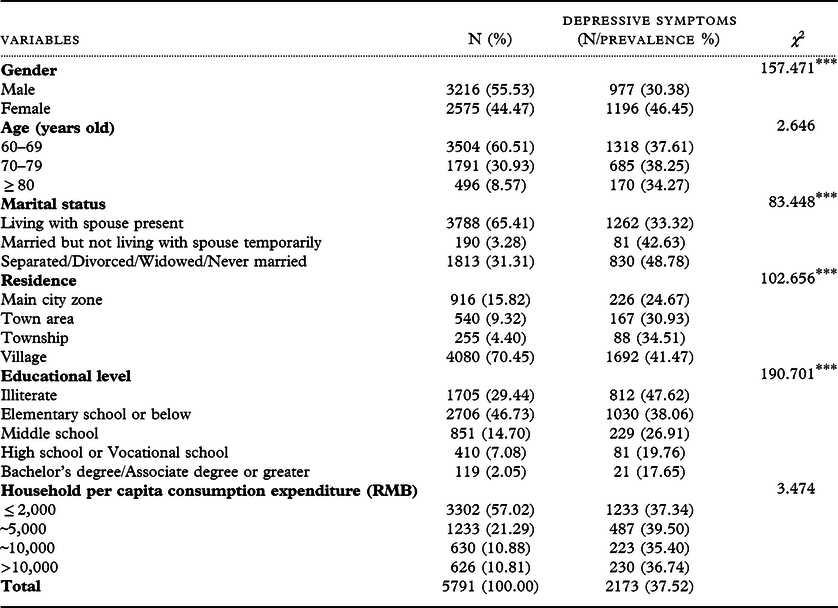
* P < 0.05; **P < 0.01; ***P < 0.001
Measurement model construction
All hypothetical latent variables, namely, sociodemographic characteristics, poor health status, unhealthy habits, and sleep duration, were specified in the measurement model. Observational variables with insignificant paths or low factor loadings were deleted from the initial measurement model to determine the most parsimonious model. After preliminary data analysis, 11 observational variables were retained, and their assignment is illustrated in Supplementary Table 2. The correlation matrix of the study variables is presented in Table 2. Many of the variables showed significant correlations.
Table 2. Correlation matrix for study variables (N = 5791)

* P < 0.05; **P < 0.01; ***P < 0.001
Figure 1 shows the final measurement model. Sociodemographic characteristics, poor health status, unhealthy habits, and sleep duration were assigned three, four, two, and two observational variables, and the factor loadings ranged 0.457–0.687, 0.491–0.863, 0.575–0.747, and 0.224–0.695, respectively. All these factor loadings were significant (P < 0.001). The four latent variables were significantly intercorrelated. Among them, sociodemographic characteristics displayed the strongest association with unhealthy habits (r = 0.516); however, it was correlated with poor health status with a minimum correlation coefficient (r = 0.046). All the correlation paths were significant (P < 0.01).
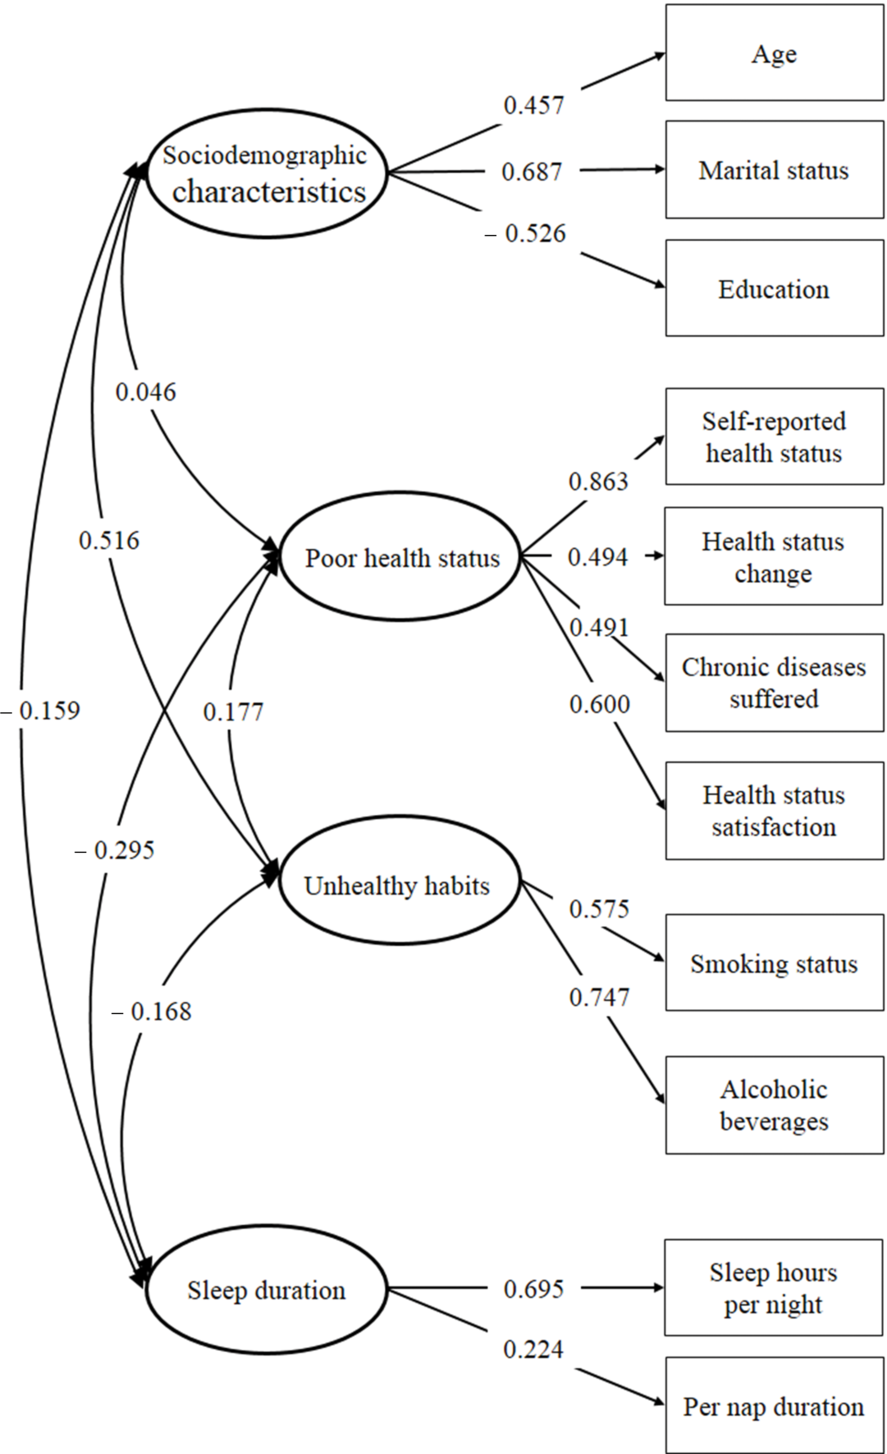
Figure 1. The measurement model of latent variables. Four latent variables and 11 manifest variables are connected by significant paths. The numbers on the straight arrows indicate the path coefficients. Every pair of latent variables is connected by bidirectional arrow curves, and the numbers on the lines indicate the correlation coefficients. The variances are set to 1.000 during the model estimation.
The measurement model was well fitted to the data. The goodness-of-fit indices were as follows: χ 2 = 374.765, df = 38, P < 0.001, CFI = 0.960, TLI = 0.942, and RMSEA = 0.039 (95% confidence intervals [CI] = 0.036–0.043).
SEM
Figure 2 displays the SEM designed on the basis of the measurement model. Sociodemographic characteristics, poor health status, unhealthy habits, and sleep duration had direct paths to depressive symptoms, and their regression coefficients were 0.281, 0.509, −0.067, and −0.162, respectively. Sociodemographic characteristics, unhealthy habits, and sleep duration also had direct paths to poor health status, and these variables were correlated with one another. All the parameters were significant (P < 0.01). The model was also well fitted to the data: χ 2 = 513.471, df = 45, P < 0.001, CFI = 0.957, TLI = 0.937, and RMSEA = 0.042 (95% CI = 0.039–0.046).
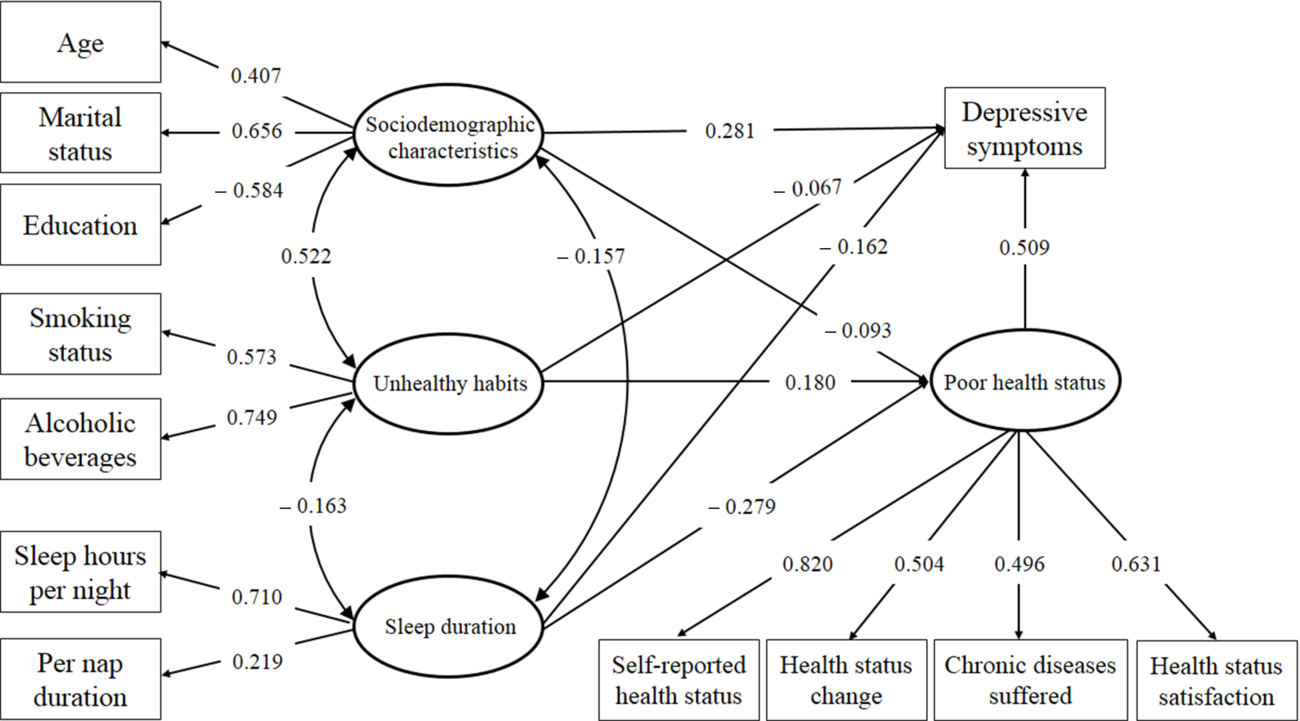
Figure 2. The structural equation model of sociodemographic characteristics, poor health status, unhealthy habits, sleep duration, and depressive symptoms. The relationships of four latent variables and their corresponding manifest variables and the associations of four latent variables and depressive symptoms are presented. The standardized coefficients are shown on the paths.
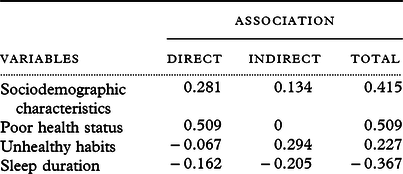
Table 3 illustrates the direct and indirect associations of all latent variables with depressive symptoms. Among the four latent variables, poor health status had the strongest direct and total associations with depressive symptoms. According to the SEM, the identified variables explained 40.9% of the variance in depressive symptoms.
Table 3. Standardized associations of latent variables on depressive symptoms
Discussion
Depression is one of the most common mental disorders in the elderly, and this condition can affect their physical and mental health, leading to the decline in the quality of life and even death (Doraiswamy et al., Reference Doraiswamy, Khan, Donahue and Richard2002). This study is the first to explore the structural relationships of depressive symptoms with the possible associated factors among the elderly population in China. The model indicated that sociodemographic characteristics, poor health status, unhealthy habits, and sleep duration had significant direct relationships with depressive symptoms. Sociodemographic characteristics, unhealthy habits, sleep duration, and depressive symptoms were also indirectly related. The direct and indirect paths suggested that poor health status was a dominant predictor of depressive symptoms.
Sociodemographic characteristics
The sociodemographic characteristics in the present study included three observed variables: age, marital status, and educational level. In terms of age, the paths indicated that older participants were prone to depressive symptoms. This result was consistent with a few studies on elderly population (Glaesmer et al., Reference Glaesmer, Riedel-Heller, Braehler, Spangenberg and Luppa2011; Urbina Torija et al., Reference Urbina Torija, Flores Mayor, Garcia Salazar, Torres Buisan and Torrubias Fernandez2007; Kaneko et al., Reference Kaneko, Motohashi, Sasaki and Yamaji2007). Unlike the young, the prevalence of depressive symptoms generally increases with age among the elderly population. This difference may be mainly attributed to the lower physical and cognitive functions, which are closely related to depressive symptoms among older people (Al-Otaibi et al., Reference Al-Otaibi2007). In terms of marital status, our results suggested that older people who were not living with their spouses (separated/divorced/widowed/single) had relatively high odds of depressive symptoms. Similarly, many studies have reported that marital status is a key variable that affects depressive symptoms among the elderly population (Javed, Reference Javed2014; Xie et al., Reference Xie, Zhang, Peng and Jiao2010; Fatima et al., Reference Fatima, Sehar, Ali, Iqbal and Shaukat2019). Kim and McKenry (Reference Kim and Mckenry2002) found that separation, divorce, and death of a spouse have significant effects on exacerbating depressive symptoms. Elderly people have relatively small social support networks, and their spouses are an important channel for them to gain support and eliminate negative emotions. Therefore, elderly people not living with their spouses are more likely to feel lonely and be affected by adverse events. In terms of educational level, the results indicated that educational level could clearly predict depressive symptoms among the elderly population, and this observation was consistent with previous findings (Gibson et al., Reference Gibson, Neita, Abel, James and Eldemire-Shearer2013; Zhang et al., Reference Zhang2019; de la Torre-Luque et al., Reference De La Torre-Luque2019). This may be due to the relatively low social and economic status of poorly educated elderly; therefore, they were more likely to have low self-evaluation and negative emotions. Moreover, highly educated elderly people tended to have more knowledge and an active mind, which enabled them to better channel negative emotions and pressure.
Poor health status
Our results suggested that poor health status was a strong predictor of depressive symptoms among the elderly people in China. A prior study in Taiwan (Hsiao and Chen, Reference Hsiao and Chen2018) indicated that the number of chronic diseases and the self-assessed health status are the factors significantly associated with depressive symptoms among the elderly residents of care settings Tanaka et al. (Reference Tanaka, Sasazawa, Suzuki, Nakazawa and Koyama2011) also reported that having a chronic disease increases the risk of depressive symptoms in the elderly. In fact, some common physical disorders are risk factors of depressive symptoms in the elderly population (Weinger and Lee, Reference Weinger and Lee2006; Hackett et al., Reference Hackett, Yapa, Parag and Anderson2005). These disorders could cause indisposition and decline of physical function, which could seriously affect the quality of life of the elderly and cause or exacerbate depressive symptoms to some extent. The economic and psychological burden brought by this disease could simultaneously cause depressive symptoms. Consequently, the elderly who had a poor physical health status needed more attention.
Unhealthy habits
For unhealthy habits, the direct association between smoking and depressive symptoms should be interpreted with caution. Previous population-based studies reported inconsistent findings: two cross-sectional studies on the depressive symptoms of the elderly population in Brazil (Gazalle et al., Reference Gazalle, Lima, Tavares and Hallal2004) and Iran. Taheri Tanjanai et al. (Reference Taheri Tanjanai, Moradinazar and Najafi2017) found that the odds of having depressive symptoms in smokers are statistically higher than those in nonsmokers. A large population-based longitudinal study (Luijendijk et al., Reference Luijendijk, Stricker, Hofman, Witteman and Tiemeier2008) also found that current smoking status is independently associated with depressive symptoms. However, a cohort study on the associations of lifestyle factors with depressive symptoms in old Taiwanese people (Tsai et al., Reference Tsai, Chi and Wang2013) indicated that smoking showed no significant associations with concurrent depressive symptoms, but it could increase the development of depressive symptoms. In the present study, smoking was negatively correlated with depressive symptoms, but their direct association was not particularly strong. This result might be due to that the elderly might use smoking to relax, as a form of self-medication or a way of coping with stress and anxiety (Cassidy et al., Reference Cassidy2004). And neuropharmalogical effects of nicotine on neurotransmitters could also be associated with improved mood (Kendler et al., Reference Kendler1993). Another possible reason might be the increased pressure experienced by the elderly to stop smoking, especially when they were forced to quit smoking because of chronic disease or other diseases (Hyland et al., Reference Hyland2004). Overall, smoking was still positively correlated with depressive symptoms because of its positive correlation with the poor health status variable. Thus, elderly population with depressive symptoms was more likely to report smoking.
Frequency of drinking also had a direct negative correlation with depressive symptoms in the present study. This result was similar to a prior study of rural elderly in China that reported alcohol consumption was associated with lower depressive symptoms scores (Gao et al., Reference Gao2009). It might be explained by the link between moderate alcohol consumption and a more active and sociable lifestyle of the elderly (Hajat et al., Reference Hajat, Haines, Bulpitt and Fletcher2004). And more social activity participation was considered a protective factor of depressive symptoms among the elderly (Borges et al., Reference Borges, Benedetti, Xavier and D’orsi2013; Dai et al., Reference Dai2019; Yang et al., Reference Yang2018). However, the direct negative correlation in this study needs to be read cautiously, because it was possible that the characteristics of heavy drinkers would be different. In fact, a few studies have reported that there was a J-shaped or U-shaped association between alcohol consumption and depressive symptoms among the elderly (Bots et al., Reference Bots, Tijhuis, Giampaoli, Kromhout and Nissinen2008; Graham et al., Reference Graham, Massak, Demers and Rehm2007; Yun and Kim, Reference Yun and Kim2020), namely, moderate alcohol consumption could lead to decreased levels of depressive symptoms, while heavy alcohol consumption was associated with an elevated risk of depressive symptoms. Thus, detailed quantifying alcohol consumption might be required to fully interpret the direct association between drinking and depressive symptoms among Chinese elderly population. Similar to smoking in present study, our results indicated that poor health status could act as a mediating effect between frequency of drinking and depressive symptoms among the elderly. This might be due to that alcohol problems could contribute to individual biological changes (Boden and Fergusson, Reference Boden and Fergusson2011), and age-related physiological changes of the elderly could significantly increase the sensitivity and decrease tolerance to alcohol (Rodriguez et al., Reference Rodriguez, Schonfeld, King-Kallimanis and Gum2010), resulting in an impact on poor health status. This effect was consistent with the study of Solmi et al. that reported physical health-related quality of life could be a bridge node connecting depressive symptoms with alcohol consumption (Solmi et al., Reference Solmi2019). Overall, the frequency of drinking was positively correlated with depressive symptoms because of its harmfulness to health. This result was consistent with the results of studies carried out in Taiwan (Tsai et al., Reference Tsai, Chi and Wang2013) and Australia (Anstey et al., Reference Anstey2009).
Sleep duration
The association between sleep and depressive symptoms has been highlighted in other studies. Guimaraes et al. (Reference Guimaraes2019) and Zalavadiya et al. (Reference Zalavadiya2017) reported that depressive symptoms in the elderly are associated with poor sleep quality. Our findings suggested that short sleep duration was associated with high rates of depressive symptoms. This result was consistent with the results of Wen et al. (Reference Wen, Liu, Liao, Yin and Wu2019), who found that elderly people with long sleep duration at night have a lower risk of developing depressive symptoms than those with short sleep duration. Sleep and depressive symptoms have a multifaceted interplay between them. Manber and Chambers (Reference Manber and Chambers2009) reported that the risk of depressive symptoms in the group of the elderly with sleep disorders is statistically significant higher than that in the group without sleep disorders. In addition, depressive symptoms can cause and exacerbate sleep disorders in the elderly, and it is even the largest risk factor of sleep disorders (Staner, Reference Staner2010; Ichimori et al., Reference Ichimori, Tsukasaki and Koyama2015).
Strengths and limitations
The strength of this study was the use of large-sample data, which were collected through face-to-face interviews. The influencing factors of depressive symptoms were mostly comprehensive, and the corresponding explanation might be incomplete with individual indicators. Therefore, our findings filled in the gap in research on the structural relationships of depressive symptoms and potential latent variables. Our results also simultaneously determined the direct and indirect connections between them.
However, some limitations should be considered in understanding the present results. First, the cross-sectional sample of this study only allowed us to estimate associations between depressive symptoms and observed variables, so it could not establish causal relationships. Second, the result was based on the whole population. Thus, the differences between males and females and between urban and rural areas were not considered in our data analysis. Third, although the final SEM was adequately fitted to the data, more information and variables could be incorporated into the model for an enhanced data fitting and explanation of depressive symptoms. These issues could be addressed by conducting future longitudinal analysis to further understand the relationships of present observations and depressive symptoms. The inclusion of additional sample information and a more specific analysis should also be considered.
Conclusion
This study first established an SEM to explore the direct and indirect relationships of depressive symptoms and their associated factors in the Chinese elderly population. The results suggested that sociodemographic characteristics, poor health status, unhealthy habits, and sleep duration could appropriately predict depressive symptoms. Among these variables, poor health status was a major predictor. Sociodemographic characteristics, unhealthy habits, and sleep duration were also indirectly associated with depressive symptoms mediating by poor health status. These results indicated that health resources could be allocated rationally to enhance their utilization efficiency during depression screening and other public health actions.
Conflict of interest
None.
Description of authors’ roles
Yaofei Xie conducted Mplus analysis of CFA and SEM and was a major contributor in writing the manuscript. Mengdi Ma interpreted the models, completed model fitting, and was a contributor in writing the manuscript. Wenwen Wu performed raw data processing. Yupeng Zhang and Yuting Zhang revised the manuscript. Xiaodong Tan designed and was responsible for the study. All authors read and approved the final manuscript.
Acknowledgments
The research team of CHARLS is acknowledged for their work.
Supplementary material
To view supplementary material for this article, please visit https://doi.org/10.1017/S1041610220001398

