Introduction
An ongoing challenge to managing Crassostrea virginica oyster populations is the lack of standardized metrics for quantifying and comparing stock abundance within and among estuaries, states, and across the Gulf of Mexico. In Texas, stock assessments of subtidal oyster populations are conducted using an oyster dredge, which cannot provide oyster density or shell volume as a quantitative, comparable metric (e.g. per unit area). It is recognized that oyster dredges are inefficient samplers; they do not collect everything in their path and can vary widely across replicate samples (Chai et al., Reference Chai, Homer, Tsai and Goulletquer1992). Dredge results can also be affected by towing speed, frequency of dredging, bottom characteristics, and length of towline (Meyer et al., Reference Meyer, Cooper and Pecci1981; McLoughlin et al., Reference McLoughlin, Young, Martin and Parslow1991; Powell et al., Reference Morson, Munroe, Ashton-Alcox, Powell, Bushek and Gius2002). Resulting data may underestimate oyster densities (Chai et al., Reference Chai, Homer, Tsai and Goulletquer1992) and limit the ability to estimate stock abundance and assess populations across states and/or regions.
Objective
The objective of this study is to determine a gear efficiency ratio for oyster dredging in shallow, subtidal estuaries that occur in the northern Gulf of Mexico. The purpose of determining this ratio is to allow the conversion of dredge-derived oyster data, such as that collected since 1984 by the Texas Parks and Wildlife Department fisheries-independent monitoring program (Martinez-Andrade Reference Martinez-Andrade2018), to quantitative, areal oyster densities to facilitate accurate stock assessments. Oyster densities as collected by dredge were compared with concurrent diver-collected quadrat surveys to determine dredge efficiency for oyster collection because quadrat surveys can accurately quantify oyster densities.
Methods
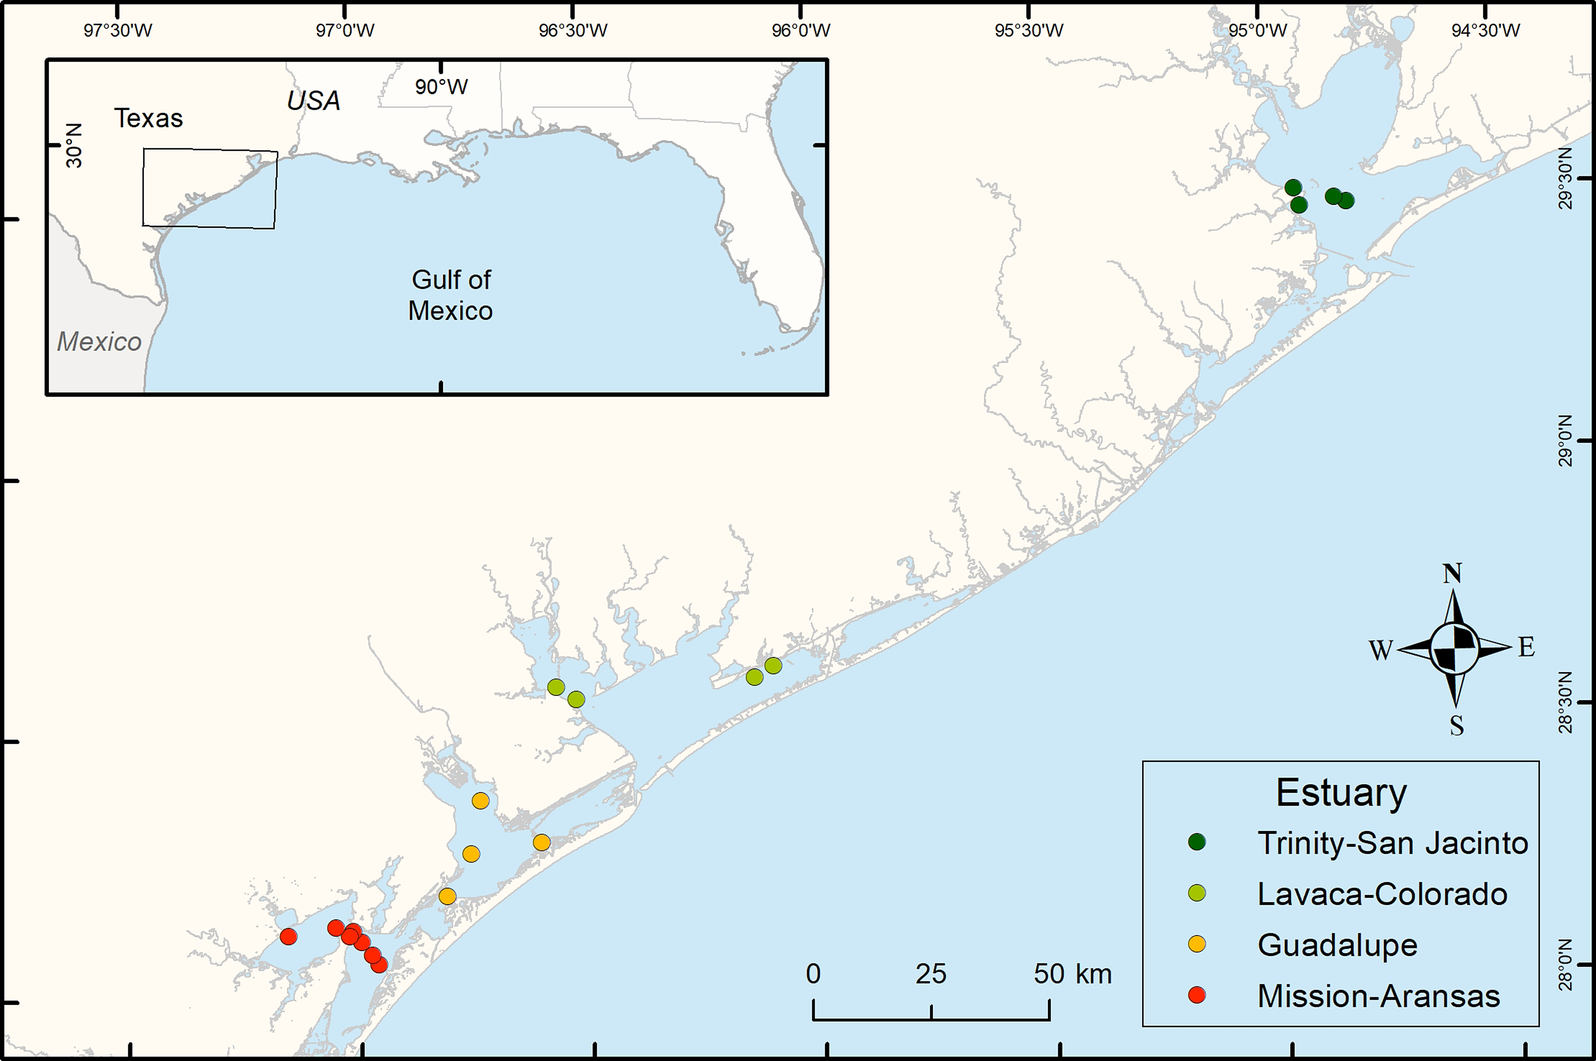
Dredge efficiency comparisons were conducted at 19 locations within four Texas estuaries from July to October 2018 (Figure 1). The locations encompassed a range of environmental conditions and oyster densities within and among estuaries. Oysters were sampled in triplicate using quadrat samples taken by scuba divers (0.5 m2), and then dredge tows (14.625 m2: 0.375-m wide dredge for 30 s at 1.3 m s−1) at each location. Sediment grain size composition was approximated by visually observing and manipulating the substrate by hand to estimate the proportion of mud, sand, shell hash (<25 mm) and whole shell (live or dead) in the top 10 cm of each quadrat sample. After this grain size analysis, the abundance and volume of live and dead oyster shells (>25 mm) were standardized to unit area, and all live oyster heights were measured (+/− 1 mm) in each sample. Shell volumes (dead and live) were determined by water displacement in a measuring bucket. Ancillary salinity and depth data were measured with a YSI ProDSS sonde at each location.

Figure 1. Sampling locations.
Results
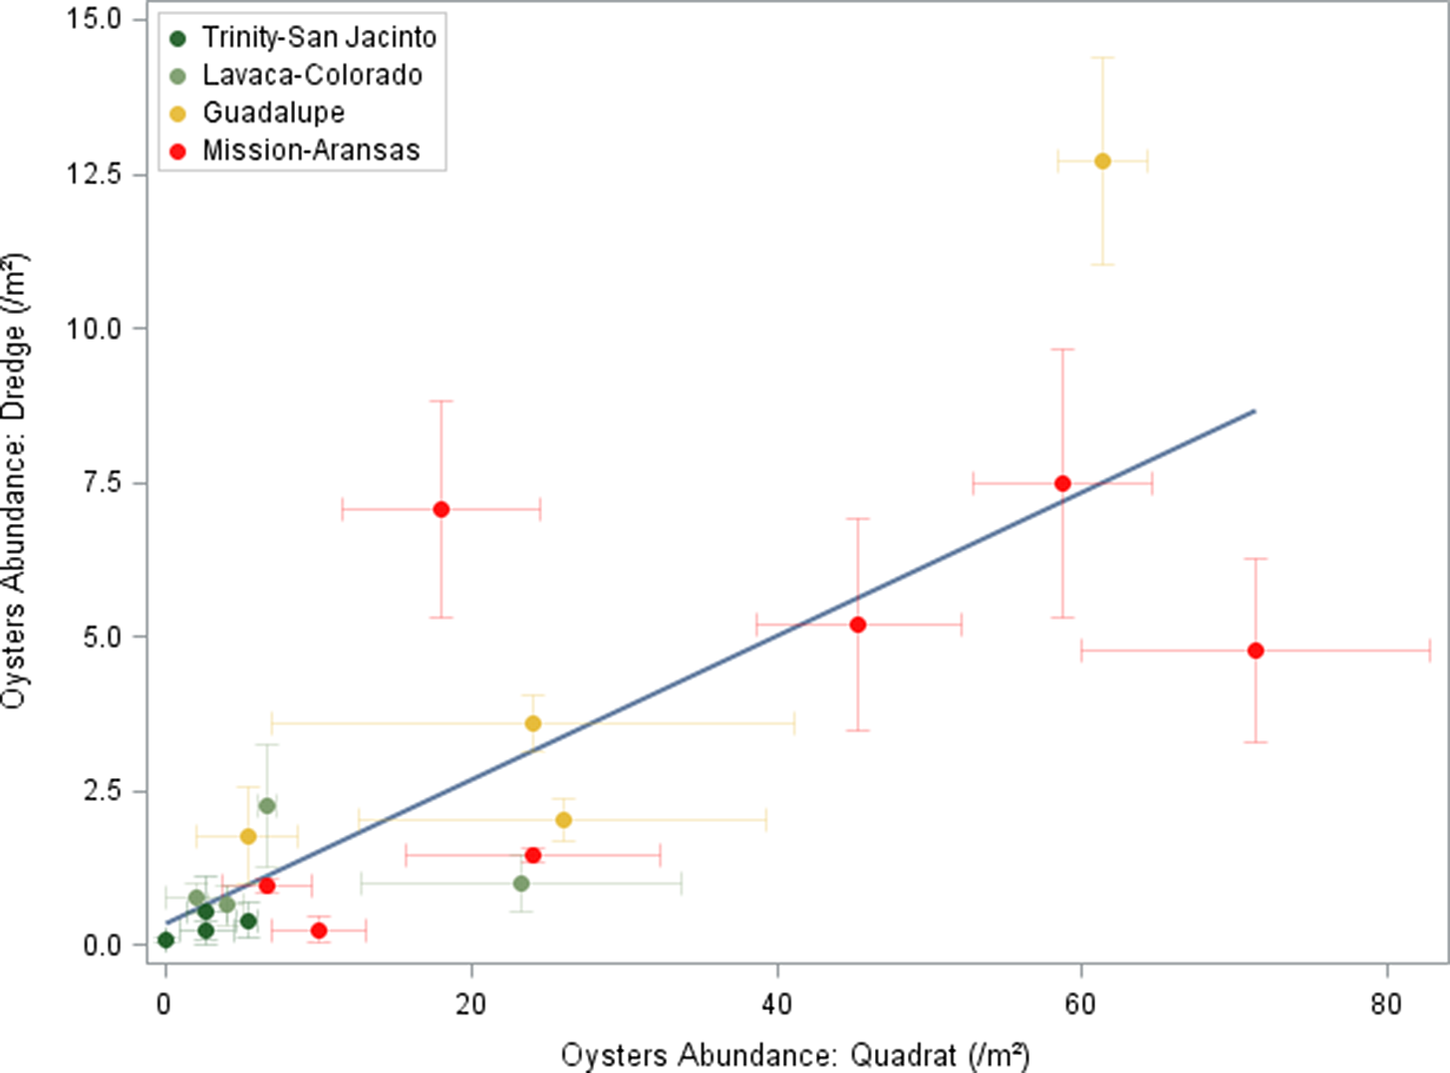
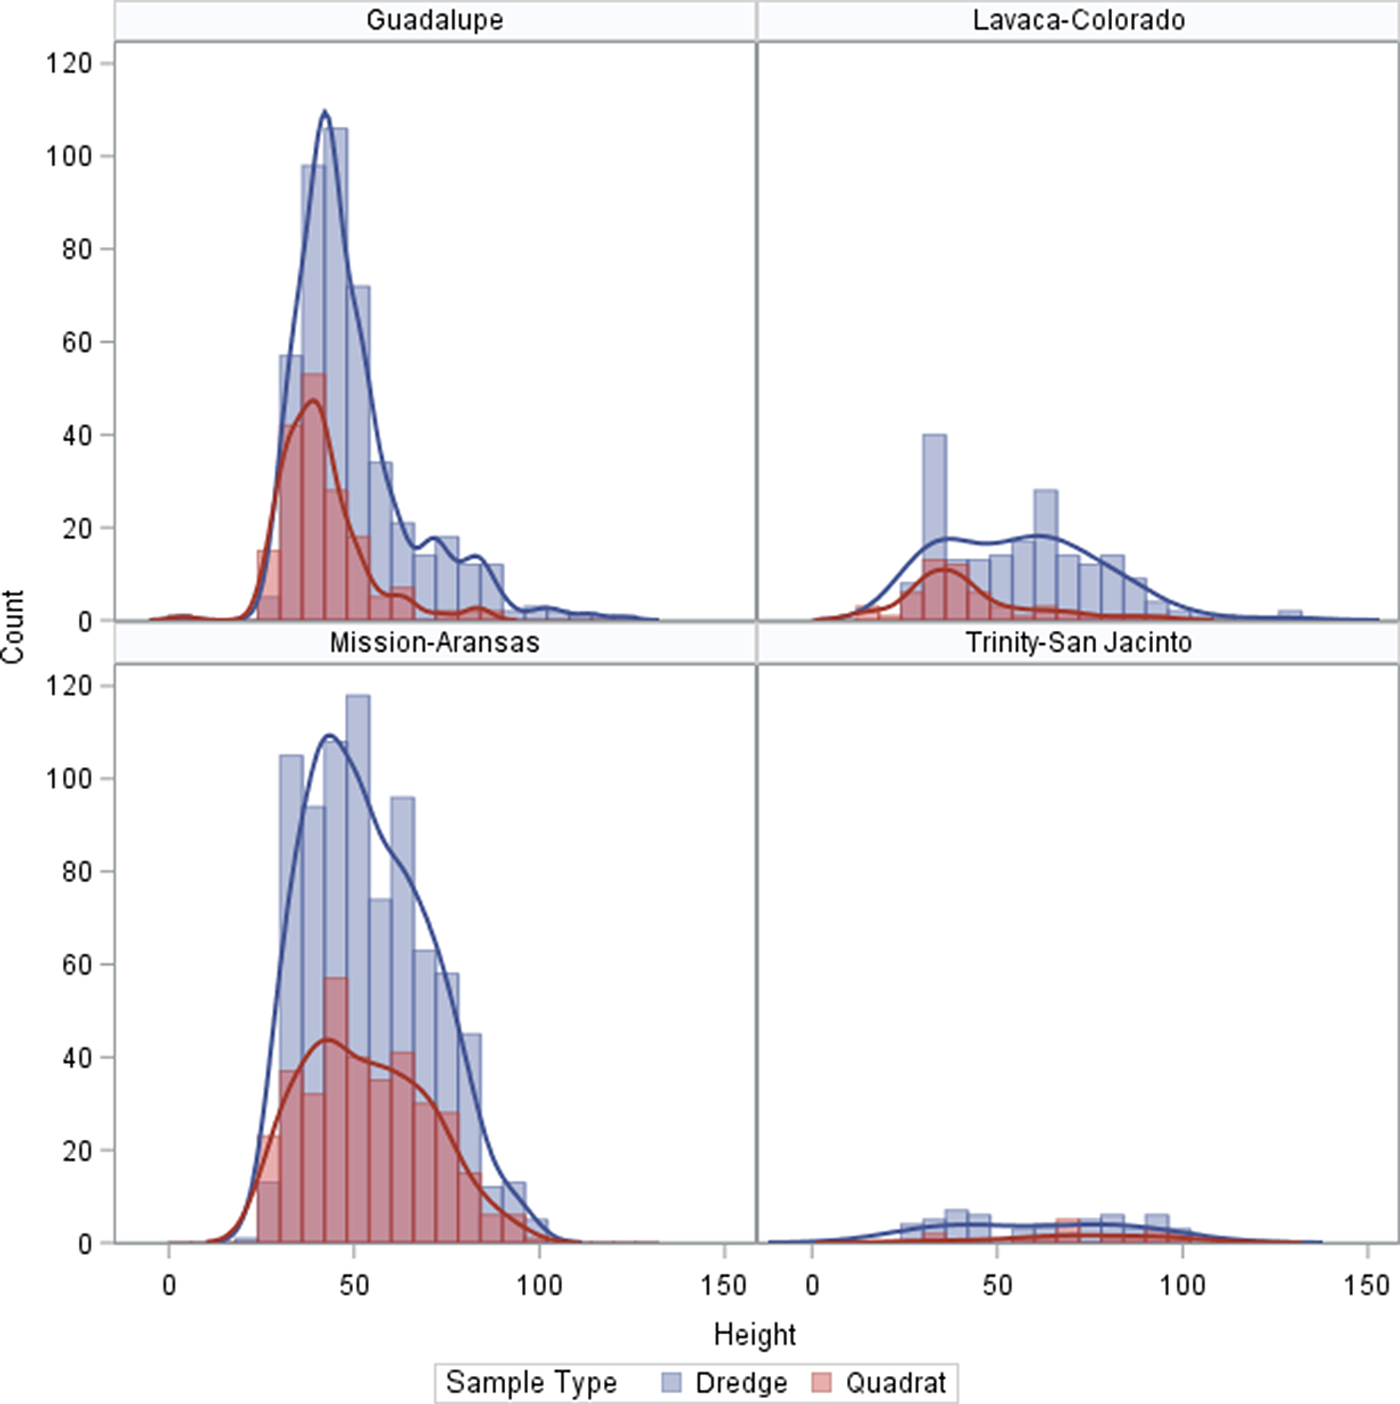
There are positive linear relationships (Pearson correlations) between oyster metrics sampled by diver quadrat and dredge for live oyster density (n m−2, r = 0.78, p < 0.0001; Figure 2), live oyster volume (L m−2, r = 0.67, p ≤ 0.002), and dead oyster density (r = 0.51, p ≤ 0.03). The gear efficiency of the dredge as determined by linear regression on mean oyster densities (n m−2) collected by dredge and by quadrat at each station are 0.125 (SE 0.016) and 0.044 (SE 0.008) for live and dead oysters. Dredge efficiency (densitydredge/densityquadrat for each station) for live oyster density is negatively correlated (Pearson correlation) with dead oyster density in quadrats and total oyster density and volume (r < −0.49, p < 0.04), but no other oyster variables, sediment grain size components or water quality variables (p ≥ 0.10). The sediment composition of the sampling locations are generally dominated by shell hash but vary among stations (μ = 79%, σ = 32%). The size distributions of live oysters are similar in quadrat and dredge samples where densities are high (Figure 3). Data generated in this study are available at GRIIDC (Beseres Pollack et al., Reference Beseres Pollack, Palmer and Breaux2019). Detailed results are in the Supplementary Material.

Figure 2. Oyster abundance as estimated by quadrat and dredge sampling. Error bars represent standard error of three replicates at each location.

Figure 3. Histograms and kernel density curves of oyster heights in each estuary as sampled by dredge and diver quadrat.
Discussion
Dredges provide a low-cost, rapid method for assessing oyster populations, but dredge-estimated oyster densities can be affected by several factors (e.g., tow speed, line length, dredge width, etc.), leading to dredges being labelled as unreliable tools for accurate oyster surveys (Schulte et al., Reference Schulte, Lipcius and Burke2018). However, dredge-estimated oyster densities were often less variable than quadrat-estimated densities in this study, which can be attributed to the fine-scale (< 10 m) spatial homogeneity that is not detected by the larger area sampled by an oyster dredge. The lower efficiency of the dredge at higher shell densities is similar to that observed by Morson et al. (Reference Morson, Munroe, Ashton-Alcox, Powell, Bushek and Gius2018). But despite the perceived and observed sampling variability, there is still a strong linear correlation between dredge-based and quadrat-based oyster density estimates over a range of sediment types.
Conclusions
Despite its inefficiency, the oyster dredge is a useful sampling tool that can be used to estimate subtidal Crassostrea virginica densities after applying a correction factor. If the area sampled by oyster dredges used in monitoring studies can be estimated, then the efficiency ratio can be used as an estimate of actual oyster density for historical and future density assessments. Further sampling and statistical analyses, such as those in Powell et al. (Reference Powell, Ashton-Alcox and Kraeuter2007), could tease out more accurate gear efficiency ratios. However, the simple ratio developed in this study is useful and applicable to Gulf of Mexico estuaries for assessment and management of oyster populations.
Acknowledgements
The authors thank Natasha Breaux, Danielle Zimmermann, Meghan Martinez, Abe Margo, Abby Williams and Chris Groff for their assistance with field work and data entry. We also thank the Gulf of Mexico Research Initiative Information and Data Cooperative for storing, and allowing open access of, the data that was generated in this study (Beseres Pollack et al., Reference Beseres Pollack, Palmer and Breaux2019).
Author Contributions
JBP and TAP conceived and designed the study. TAP conducted data collection. TAP performed statistical analyses. JBP and TAP wrote the article.
Funding Information
This work was funded by the NOAA Texas Coastal Management Program, managed by the Texas General Land Office (GLO Contract # 18-093-000-A604).
Conflict of Interest
JBP and TAP declare none.
Supplementary Materials
To view supplementary material for this article, please visit http://dx.doi.org/10.1017/exp.2019.2.


Comments
Comments to the Author: This paper provides a much needed means to translate oyster dredge sampling data to a useable and comparable density. The data and analyses are sound. A few minor questions: (1) what is “dead oyster” versus “shell volume” or “whole shell”? (2) how was the proportion of mud, sand, shell hash and whole shell estimated BEFORE the top 10 cm was excavated? Is there visibility to do this? And how were these data used? If not used, no need to report- although it would be interesting to know what rough estimate of “percent cover” or hard bottom there was. (3) It might be worth noting that use of the dredge and conversion factor could be an issue in areas with high amounts of material (live or dead oyster, shell, hash), which result in the dredge being full prior to finishing the sample. L. 78 - where you state "several factors" please identify some of the factors that can affect dredge estimates (i.e., two speed, line length, weather conditions, dredge width, overflow on dredge…)