Introduction
Wild oat has been a longstanding global problem weed due to its competitiveness and dormant nature. It was ranked thirteenth on a list of the world’s worst weeds by Holm et al. (Reference Holm, Plucknett, Pancho and Herberger1977). Increased herbicide resistance globally has also increased the difficulty in managing this weed (Heap Reference Heap2020). For example, on the Canadian Prairies, herbicide resistance frequency has increased to the extent that 69% of wild oat populations collected from fields prior to harvest are herbicide resistant (Beckie et al. Reference Beckie, Shirriff, Leeson, Hall, Harker, Dokken-Bouchard and Brenzil2020). Globally, wild oat populations have been reported being resistant to one or more herbicide sites of action, including acetyl co-enzyme-A carboxylase (Group 1) inhibitors, acetolactate synthase (Group 2) inhibitors, lipid/cell elongation inhibitors (Group 8), 5-enolpyruvylshikimate-3-phosphate (Group 9) synthase inhibitors, protoporphyrinogen oxidase (Group 14) inhibitors, very-long-chain fatty acid elongase inhibitors (Group 15), and antimicrotubule mitotic disruptors (Group 25; Heap Reference Heap2020). This significantly limits postemergence herbicide options in pulses and cereals. Additionally, multiple resistance to herbicides belonging to Groups 1, 2, 8, 14, and 15 has been documented in a biotype from the Canadian Prairies (Heap Reference Heap2020; Mangin et al. Reference Mangin, Hall and Beckie2017). Not only are resistant biotypes limiting herbicide options, but multiple- and cross-resistant biotypes severely limit herbicide options within that biotype. Many of the remaining herbicide options are applied preemergence and often require spring precipitation for activity and are highly affected by soil characteristics. Because of this, increased variability of weed control is often observed with these products, and effective weed control may be limited to areas with more suitable soil characteristics such as low organic matter. This leads to a need for additional management strategies to be used in an integrated weed management (IWM) plan.
Management of wild oat through managing the soil seedbank has long been a goal of weed scientists, particularly through disrupting dormancy or stimulating germination. Techniques to exploit the wild oat seedbank such as the use of various chemicals (strigols, gibberelins; Bradow et al. Reference Bradow, Connick, Pepperman and Wartelle1990), nitrogen fertilizers (Sexsmith and Pittman Reference Sexsmith and Pittman1963), tillage (Sharma et al. Reference Sharma, McBeath and Vanden Born1983), and plant growth regulators (Adkins and Adkins Reference Adkins and Adkins1994) have previously been investigated. Although several of these techniques are effective in controlled environments, they often lose efficacy when applied in field conditions, are economically not feasible, or do not fit within desired cropping system design (i.e., no-till or conservation tillage systems that minimize the use of tillage). As a result, while a plethora of research exists on germination stimulation, it is not a large focus for integration into IWM strategies for many farmers.
A second method for managing the weed seedbank is to reduce inputs into the seedbank. One methodology for achieving this is the use of harvest weed seed control (HWSC; Walsh et al. Reference Walsh, Newman and Powles2013). HWSC methods prevent weed seeds from entering the seedbank through targeted management of the chaff fraction at harvest. However, studies on wild oat have shown it has low levels of seed retention at typical harvest timing, which decreases the effectiveness of HWSC on this species (Burton et al. Reference Burton, Beckie, Willenborg, Shirtliffe, Schoenau and Johnson2016, Reference Burton, Beckie, Willenborg, Shirtliffe, Schoenau and Johnson2017; Tidemann et al. Reference Tidemann, Hall, Harker, Beckie, Johnson and Stevenson2017). As a result, HWSC is unlikely to become a highly useful method for management of the wild oat seedbank.
Crop topping, the application of herbicides near the end of the growing season before harvest, can reduce weed seed production and/or weed seed viability. However, timing of application is critical to the efficacy and herbicide residues/maximum residue limits can also be of concern with late-season herbicide applications. Both nonselective and selective herbicides have been investigated for crop-topping uses; however, synchronicity with crop maturity is important when using nonselective herbicides so as to not cause crop injury and yield loss. Nonselective herbicides such as glyphosate have been shown to completely prevent seed production in wild oat (Shuma et al. Reference Shuma, Quick, Raju and Hsiao1995). However, precision is required to properly time its application to a crop so as to prevent seed production without injuring the crop. Selective crop topping or spray-topping has been previously investigated for wild oat using flamprop-m-methyl at the tiller elongation stage of growth (Cook et al. Reference Cook, Storrie and Medd1999). Seed production was reduced >70% in nearly all cases. However, resistance developed to flamprop in a wild oat species (Avena sterilis L.) in Australia where selective spray topping was used (Broster Reference Broster2004). Selective spray topping of wild oat has not been used in western Canada due to a lack of selective product options that are not already used for typical in-crop wild oat management. Flamprop was removed from the Canadian market several decades ago when resistance and cross/multiple resistance were documented in wild oat on the Canadian Prairies (Heap Reference Heap2020). Late-season crop topping is not typically effective on wild oat because by the time the crop is mature enough to use nonselective herbicides, wild oat plants have already produced viable seed and begun to shed those seeds. However, it is possible that there may be a time interval at panicle emergence when a selective herbicide would continue to have an impact on wild oat seed production, or a nonselective product could be applied by exploiting the height differential of the wild oat and the crop.
The objective of this study was to investigate opportunities to target the life-cycle stages between panicle emergence and seed shed for wild oat management. The first objective was to compare three methods of targeting wild oat panicles: hand-clipping (to completely remove panicles above the crop canopy), cutter bar (to simulate how a producer could physically remove panicles in a field, and a similar efficacy), and selective herbicide application (to investigate the impact of selective crop topping at panicle emergence timing on seed production and viability). Investigating the impact of timing of these methods was also compared by using early applications (when most panicles were extended above the crop canopy), late applications (initiation of seed shed), and a combination of these timings. A third objective, investigated in a separate study, was to determine the ideal timing of panicle removal via clipping for integration into a cropping system.
Materials and Methods
Panicle Targeting Methodology
Experiments were conducted in 2015 to 2016 and 2016 to 2017 in Lacombe, AB (52.5°N, 113.7°W) as a randomized complete block design with four replications in 4-m × 1.5-m plots, where wild oat populations were low to nonexistent prior to establishment for this study. Wheat was seeded in the first year of the study when treatments were applied (2015, and a second repeat of the trial in 2016), followed by canola in the second year (2016, and 2017 in the trial repeat) when treatment effects on the subsequent population were observed. A glyphosate treatment (900 g ae ha−1) was applied 1 d to 1 wk prior to seeding of spring wheat (AC Harvest) at 300 seeds m−2 for weed control. Prior to wheat seeding, wild oat with good germination rates was broadcast seeded across the study area at 200 seeds m−2. Wheat seeding occurred on May 14, 2015, and May 6, 2016, with a disc seeder (Fabro Enterprises Ltd., Swift Current, SK, Canada) with 25-cm row spacing and 2-cm depth. Fertilizers were applied as per soil test recommendation. Broadleaf weeds were controlled via application of metribuzin (203 g ai ha−1; Sencor; Bayer CropScience, Calgary, AB, Canada). Wheat was desiccated with a mixture of glyphosate (RoundUp WeatherMax; Monsanto, Winnipeg, MB, Canada) at 900 g ae ha−1 and saflufenacil (Heat; BASF Canada, Mississauga, ON, Canada) at 71 g ai ha−1 plus labeled adjuvant (Merge) in both years using a Kverneland sprayer (Kverneland Group, Klepp Stasjon, Norway) with 45 L ha−1 spray volume and TeeJet 110015 nozzles (TeeJet Technologies, Denver, CO, USA). Wheat was harvested with a small-plot combine (Kincaid 8XP; Kincaid Seed Research, Haven, KS, USA) with yield and percent grain moisture taken at harvest.
Panicle removal treatments included removal by hand using hand clippers (allowing every panicle to be removed and estimating the highest efficacy possible), removal with a battery powered hedge trimmer (Stihl HLA 65; Stihl Limited, London, ON, Canada) to simulate mechanical cutter bar options that are commercially available and the efficacy likely to be achieved by producers, or application of selective herbicide for selective crop topping. The selective crop topping treatment was pinoxaden (Axial; Syngenta, Calgary, AB, Canada) at two times the field use rate (120 g ai ha−1) with labeled adjuvant (Adigor). This treatment was applied with a quad sprayer at 100 L ha−1 spray volume and TeeJet 11002 nozzles (TeeJet Technologies). Clipping by hand or with the hedge trimmer was carried out immediately above the top of the wheat head to capture as much of the panicle as possible. Panicles were dropped to the ground and were not collected so as to allow any viable seeds at the time of clipping, or that would later mature to viability, to potentially grow the following year. All treatments were implemented at three timing intervals: early (when 90% of panicles were fully emerged in a plot), late (initiation of seed shed observed), and a combination of early and late. In addition to these removal methods a weedy check and an industry standard in-crop wild oat herbicide application treatment (pinoxaden [Axial; Syngenta, Calgary, AB, Canada] at label application timing and rate [59 g ai ha−1] plus Adigor adjuvant) were included and were applied with the quad sprayer as described above.
Data collected in the year of wheat growth included wild oat plant densities in a 0.5-m2 quadrat at the front and back of each plot. Yield was collected at maturity as described above; however, an approximately 1-kg subsample was also cleaned to determine dockage and true crop yield. Wheat kernel weight was evaluated by counting 250 kernels, weighing them, and multiplying by four. Dockage samples were manually sorted into wild oat and other weeds. Wild oat viability was determined using 100 seeds from dockage samples (or as many as possible in small samples) and placing them into 16.6 by 24.1 by 4.4-cm germination boxes with blue blotting paper (Seedburo Equipment, Des Plaines, IL, USA) with white unbleached blotting paper (Ahlstrom-Munksjo, Helsinki, Finland) on top. Approximately 35 ml of water was initially placed in the germination box and then more added as needed to maintain sufficient moisture for germination. Samples were germinated for 2 wk, and seeds were counted as viable if they either germinated or were ungerminated but passed a crush test (Sawma and Mohler Reference Sawma and Mohler2002) at the end of the 2-wk period. Germination assays occurred in the dark at approximately 22 C.
In the subsequent year (2016 and 2017, respectively) following application of glyphosate at 900 g ae ha−1 (2016) or glyphosate (900 g ae ha−1) plus bromoxynil (Pardner; Bayer CropScience, Calgary, AB, Canada; 462 g ai ha−1) burnoff with the Kverneland sprayer described above, canola (‘L241C’) was seeded at 150 seeds m−2 using the same disc drill described previously on May 6, 2016, and May 9, 2017. Fertilizers were again applied per soil test recommendation. Broadleaf weeds were managed through applications of ethametsulfuron-methyl (Muster; FMC Corporation, Mississauga, ON, Canada) at 22 g ai ha−1 and clopyralid (Lontrel 360; Corteva Agriscience, Calgary, AB, Canada) at 150 g ai ha−1, along with labeled adjuvant (ProSurf) applied through the Kverneland sprayer as previously described. No additional treatments were applied in the second year; rather, the second year was used to measure the impacts of first-year treatments on wild oat populations and canola yield in Year 2. Canola was desiccated with glyphosate and saflufenacil in the same manner as the preceding wheat crop and combined with the small-plot combine.
Wild oat densities were measured in the canola in 0.5-m2 quadrats at the front and back of each plot. Wild oat dried plant biomass was determined when canola was at 50% flowering (BBCH 65) in 0.5 m2 in each plot. True canola yield and wild oat dockage was determined through cleaning of a yield subsample as previously described for the wheat. The wild oat seedbank was sampled using a round soil corer of 10-cm diameter to 5-cm depth in four locations throughout each plot. As the plots were established in a no-till system, seedbank inputs would be limited to the top disturbance layer of the soil. Soil samples were air dried immediately, then passed through a Clipper air and sieve cleaner (A.T. Ferrel, Bluffton, IN, USA) with a 14/64 screen on the top and 5/64 screen on the bottom. Clipper discards were manually cleaned to prevent unintentional seed losses. Samples were then hand washed through a 1.4-mm sieve to rinse the soil through and recover wild oat seeds. Seed samples were then air dried and counted.
Data were analyzed using the GLIMMIX procedure in SAS 9.4 (Littell et al. Reference Littell, Milliken, Stroup and Wolfinger2006; SAS Institute 2013). For all variables, wild oat emergence in Year 1 (prior to treatment implementation) was used as a covariate. Although wild oat was seeded at a consistent rate there was still variation in emergence and densities between plots, and so the covariate was used to account for that. Fixed effects were treatment and year, and random effects were replicates nested in year. Selection for model distributions were conducted using Akaike’s corrected information criterion (AICc). Yield in both years, wheat kernel weight, wild oat densities in Year 2, wild oat biomass, and wild oat seedbank were all best fit by lognormal distributions. Wild oat dockage in both years and wild oat viability was best fit by a beta distribution. Least squares (LS) means estimates for response variables were retrieved by fixed effects based on significance and subjected to mean comparisons with a Tukey’s honestly significant difference adjustment. LSM estimate statements were then used to retrieve estimates and make comparisons between timing of panicle removal (early, late, or combination) and type of panicle removal (hand, cutter bar, herbicide). When location was significant, the analysis was conducted by location. All LS means estimates are presented on the original data scale.
Panicle Removal Timing
Experiments were conducted in 2015 to 2016 and 2016 to 2017 in Lacombe, AB (52.5°N, 113.7°W), and Saskatoon, SK (52.1°N, 106.3°W). A glyphosate treatment (900 g ae ha−1) was applied prior to seeding at all sites. In 2015 (repeated in 2016), lentil (CDC Dazil) at 140 seeds m−2 and spring wheat (AC Harvest) at 300 seeds m−2 were seeded using a disc seeder (Fabro Enterprises) with 25-cm row width at a depth of 2 cm at both locations. Wild oat seeds were broadcast onto the soil surface at 200 seeds m−2 within 1 d prior to seeding, with some incorporation of the wild oat provided by the crop seeding operation. Seeding of wheat and lentil occurred in May 12 to 14, 2015, and May 5 to 6, 2016. At each location, fertilizer was mid-row banded based on soil test recommendations. Small amounts of nitrogen and phosphorous were also placed directly with crop seeds as starter fertilizer. Metribuzin at 111 g ai ha−1 was used for broadleaf weed control in lentils and wheat.
The experiment was a split-plot design with four replications. Crop type was the main plot and clipping timing was the subplot. Subplots were 1.5 × 4 m to 2 × 6 m in area depending on available seeding equipment at each location. As the number of clipping time opportunities was not known before the experiment began, plots were seeded to allow six weekly clipping treatments, and a weedy check (unclipped). This resulted in 14 total treatments (2 crops × 7 possible clipping treatments). Clipping was initiated when the majority of wild oat panicles were visible above the respective crop canopies and continued weekly until it was terminated once seed shed began. Because of different environmental and growth conditions between locations and years, wild oat maturation and development rate differed between site-years, particularly with respect to panicle availability above the crop. As a result, the sixth clipping timing was not used for Lacombe site-years. Clipping in this study was completed via battery-powered hedge trimmers (Stihl HLA 65; Stihl Limited, London, ON, Canada) to simulate mechanical methods that may be available to producers via clipping just above the top of the crop canopy and allowing the clipped panicles to fall within the plots (Figure 1). Wheat and lentil were harvested when they reached harvest maturity. Desiccation with glyphosate (900 g ae ha−1), saflufenacil (71 g ai ha−1), and labeled adjuvants were used on the crops after a killing frost event so as not to affect wild oat seed viability.
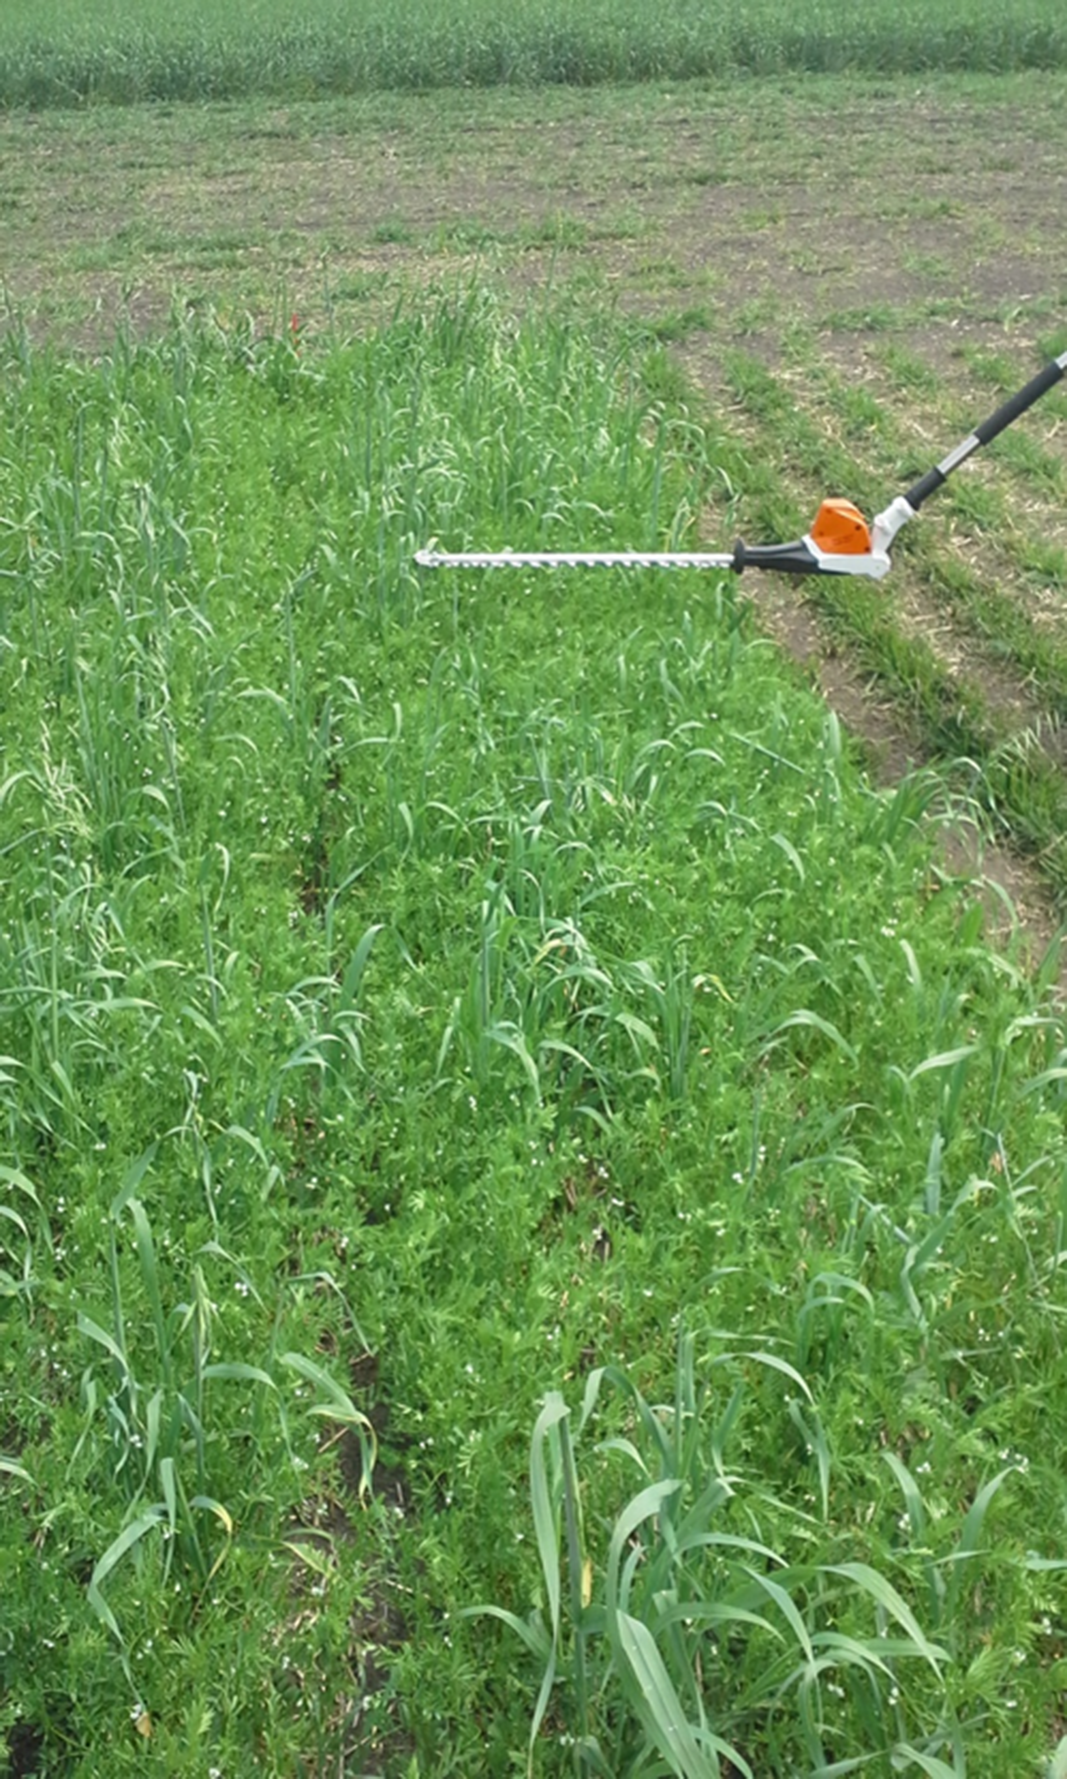
Figure 1. Clipping of wild oat panicles just above the crop canopy using a battery powered hedge trimmer.
In the subsequent year to lentil and wheat growth, glufosinate-resistant canola (L241C) was seeded at 150 seeds m−2 with the same row spacing and drill specifics described above, although seeding depth was shallower (approximately 1.25 cm) for canola. Fertility was primarily mid-row banded based on soil sample nutrient analysis and recommendations, with small amounts of seed-placed fertilizer as a starter. Broadleaf weed control was implemented through applications of ethametsulfuron-methyl and clopyralid as described for the previous experiment. The canola was desiccated as described for the previous experiment.
Data collection in the wheat and lentil year included wild oat density, grain yield, and dockage. Dockage was measured only in Lacombe. Wild oat density and dockage was assessed as described for the previous experiment. Plots were harvested at maturity using a plot combine, and grain yield and grain moisture were assessed. Data collection in the canola year included wild oat densities, wild oat biomass, canola yield, wild oat dockage, and wild oat seedbank density all measured as previously described.
Crop data (wheat, lentil, and canola yield) were analyzed separately for year of treatment and year following treatment with the GLIMMIX procedure of SAS (Littell et al. Reference Littell, Milliken, Stroup and Wolfinger2006; SAS Institute 2013). Replicate effects were random. The effects of year, location, and clip time were fixed. For wild oat-related variables (density, dockage, biomass, emergence, and viability), data were analyzed separately for either year of treatment or year following treatment with the GLIMMIX procedure of SAS (Littell et al. Reference Littell, Milliken, Stroup and Wolfinger2006; SAS Institute 2013). The effect of crop was considered fixed, and replicates were again considered random. Wild oat density data were analyzed with a negative binomial error distribution (Stroup Reference Stroup2014). Dockage and viability were analyzed with a beta error distribution. Remaining variables were analyzed with a Gaussian distribution (Stroup Reference Stroup2014). For wild oat variables, a beta-spline function effect for clip time was included as a fixed effect (SAS Institute 2013). A two-knot equal spline resulted in best fit (using AICc) relative to other spline options (e.g., polynomial). The effects of year and location were excluded to simplify the analysis. For all analyses with non-normal error distribution a nominal amount (less than 1% of variable range) was added to data values to eliminate zeroes.
Results and Discussion
Environmental Conditions
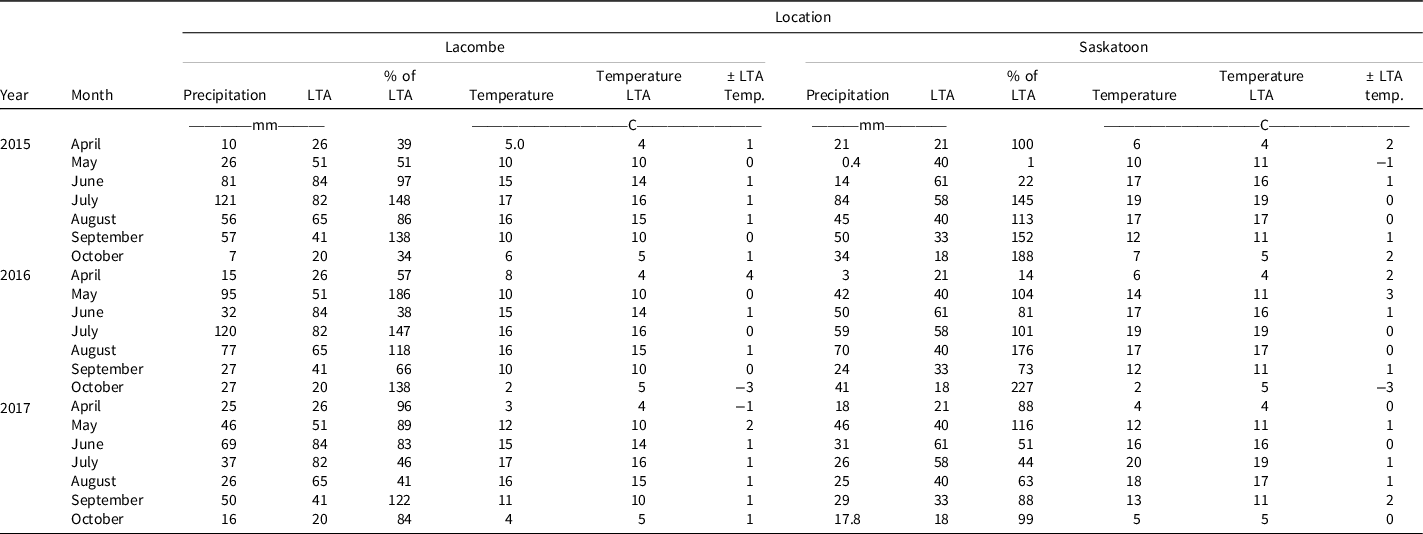
Over the course of the experiment, the Lacombe location had very different growing seasons. In 2015, the season started very dry and unseasonably warm, leading to drought-like conditions until the end of June (Table 1). The rest of the season received reasonable or high levels of moisture, but dry conditions early on impacted overall crop health resulting in shorter crops and reduced yields. In 2016, it was very wet during the weeks of crop seeding and emergence, June was hot and dry, and temperatures were relatively close to normal with high rainfall for most of the remainder of the season. The 2017 field season began with close to long-term average precipitation, although it was warm. Precipitation tapered off in July and August, and the fall was wet. It was similarly very dry in Saskatoon in May and June of 2015. Although the rest of the season was moist, the early drought-like conditions impacted overall crop health. In 2016, precipitation was generally normal aside from a very wet October; however, above average temperatures occurred in May, and below average temperatures occurred in October. In 2017 in Saskatoon precipitation was low from June through August, but temperatures were relatively close to the long-term average.
Panicle Targeting Methodology
Wheat emerged well in both years, averaging 202 and 214 plants m−2 in 2015 and 2016, respectively (data not shown). Wild oat also emerged well, averaging 32 and 52 plants m−2 in 2015 and 2016 (data not shown). Because of some minor documented variation between and within years in the initial wild oat density in wheat, wild oat density in Year 1 was used as a covariate in the analyses to standardize the effects on a plot basis. Because each run of the experiment covered two years (2015/2016 and 2016/2017) they are referred to by their starting year only (2015 or 2016). However, some of the data (i.e., canola yield) was measured only in the second year of the studies (2016 and 2017, respectively). Thus, the year given always indicates the year in which the study was initiated.
Wheat yield was only significantly affected by year (Table 2), not by treatment. This was not necessarily surprising because the panicle targeting methodologies were employed only after nearly an entire growing season had passed with weed competition in place, and the plants were not fully removed, simply clipped; the remaining plant portions likely continued to compete with the wheat for resources. However, effects of wild oat intercepting light and reducing wheat growth and yield were not observed in this study as in previous studies (Cudney et al. Reference Cudney, Lowell and Hall1991). It was somewhat surprising that the industry standard in-crop herbicide application did not result in a significant increase in yield, but this may be related to variability in wild oat emergence periodicity or control levels. Wild oat is known to have additional cohorts emerge throughout the growing season (Bullied et al. Reference Bullied, Marginet and Van Acker2003); it is possible that additional cohorts emerged after the in-crop herbicide application, resulting in additional competition and a lack of increase in yield. Between years, yield was much higher in 2016 than in 2015 (Figure 2). The low yield in 2015 was likely a result of drought-like conditions at the start of that growing season (Table 1). Similarly, wheat kernel weight was also only affected by year with higher kernel weights in the 2016 growing season, likely as a result of better growing conditions (Figure 2). One concern we had with applications of a selective wild oat herbicide at panicle emergence, which is off label, was that there could be potential reductions in wheat yield or kernel weight. However, we observed neither issue.
Table 2. Significant effects for each tested variable in the panicle removal method experiment based on an analysis of co-variance using the GLIMMIX procedure of SAS 9.4 (SAS Institute 2013).

Bolded P-values indicate significance at α = 0.05.
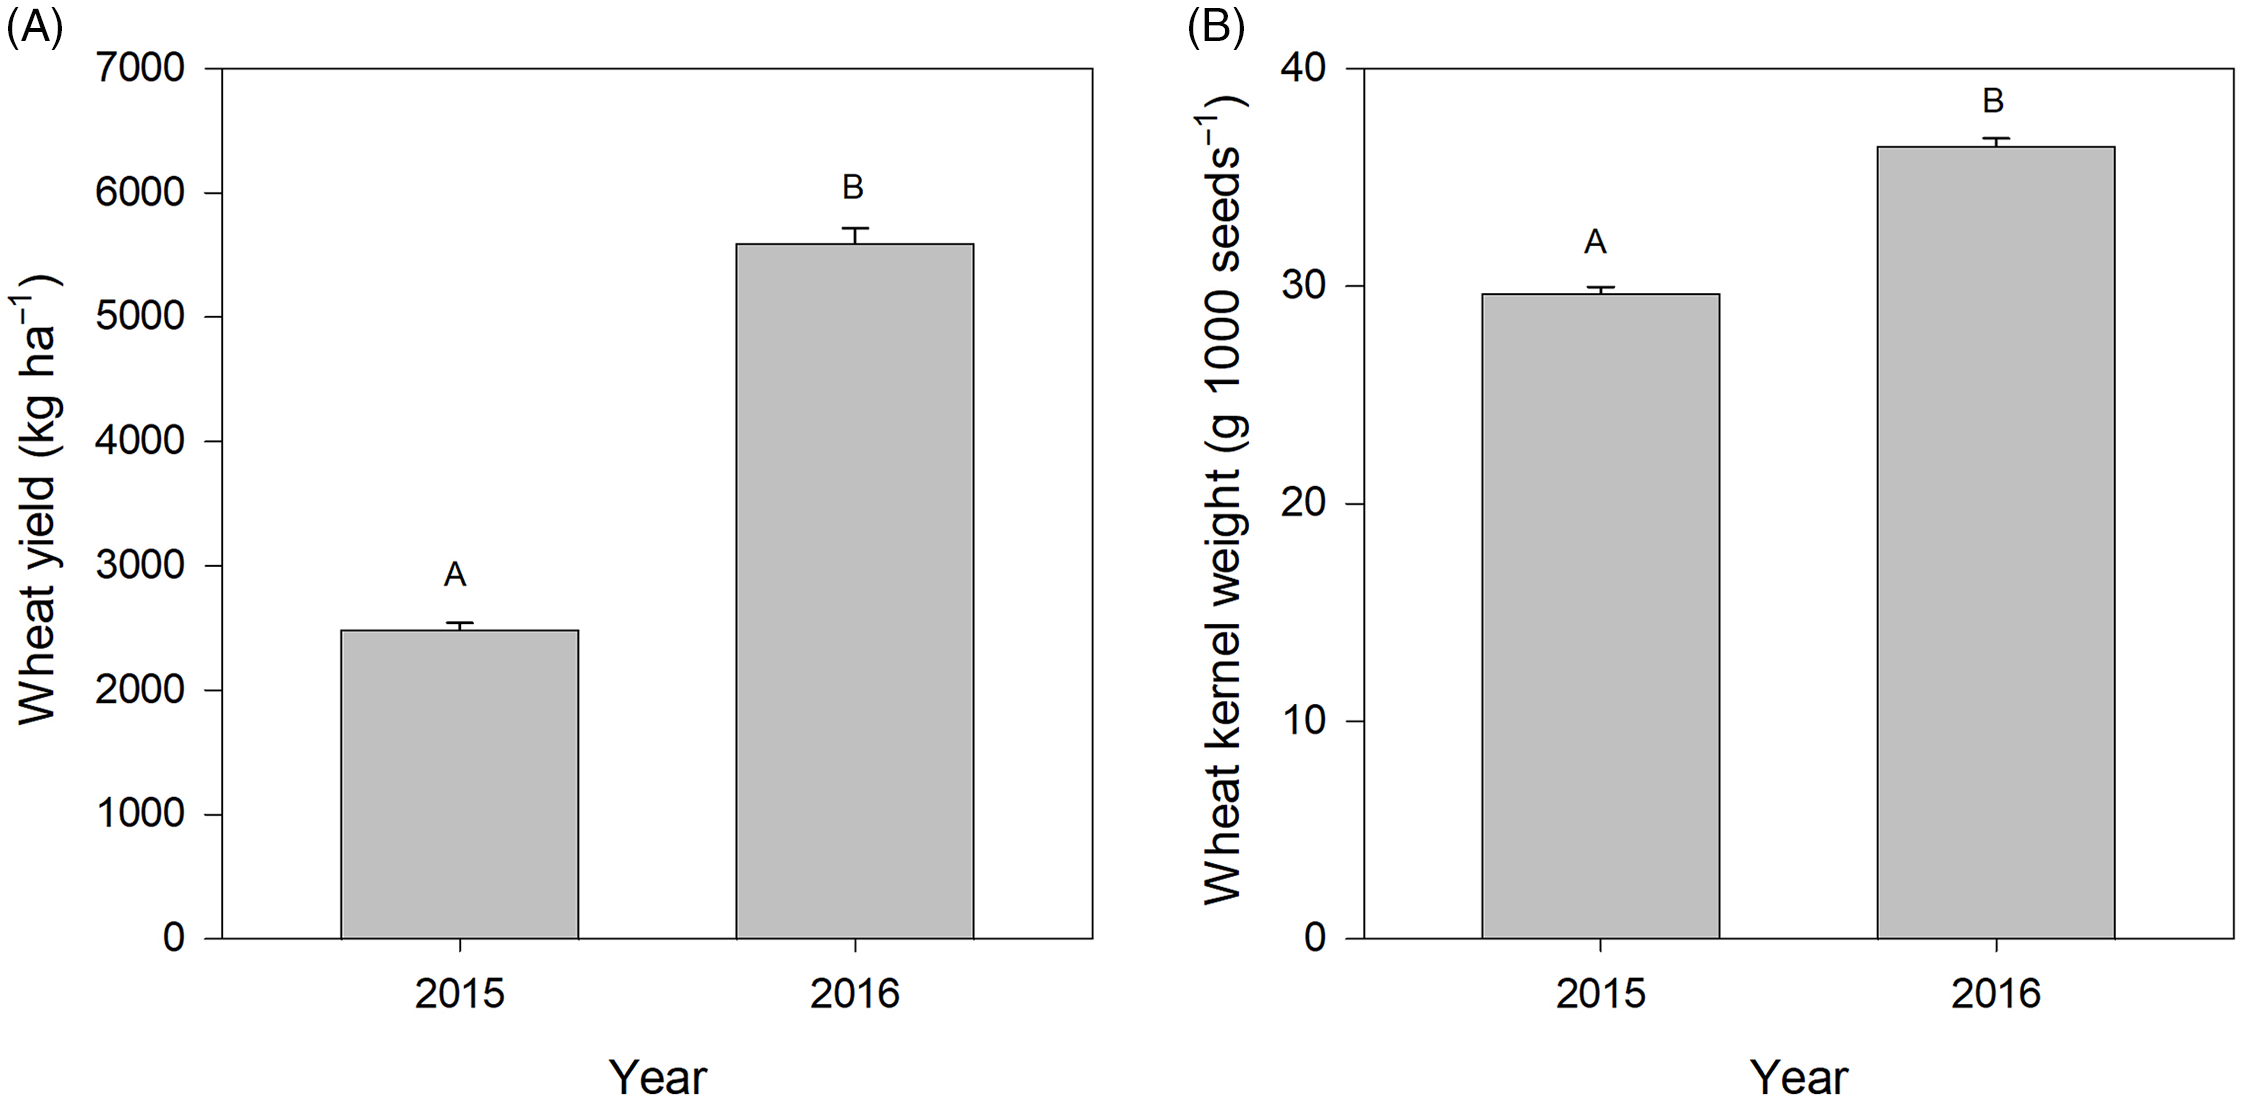
Figure 2. Wheat yield (A) and wheat kernel weight (B) as affected by year. Bars indicate standard errors.
In contrast, wild oat dockage in wheat was significantly affected by treatment and year, and by their interaction (Table 2). When examined by year, wild oat dockage was lowest in 2015 in the industry standard in-crop herbicide treatment and the early and combination herbicide application treatments (Figure 3). In 2016, the late herbicide treatment did not reduce wild oat dockage as much as in the previous year; however, the other treatments with the lowest level of dockage remained the same (Figure 3). When combined across timing factors, the combination treatments were significantly lower in dockage than the late treatment in 2015, and the late treatment was higher than both other timings in 2016. However, the herbicide reduced wild oat dockage compared to hand clipping in both years.
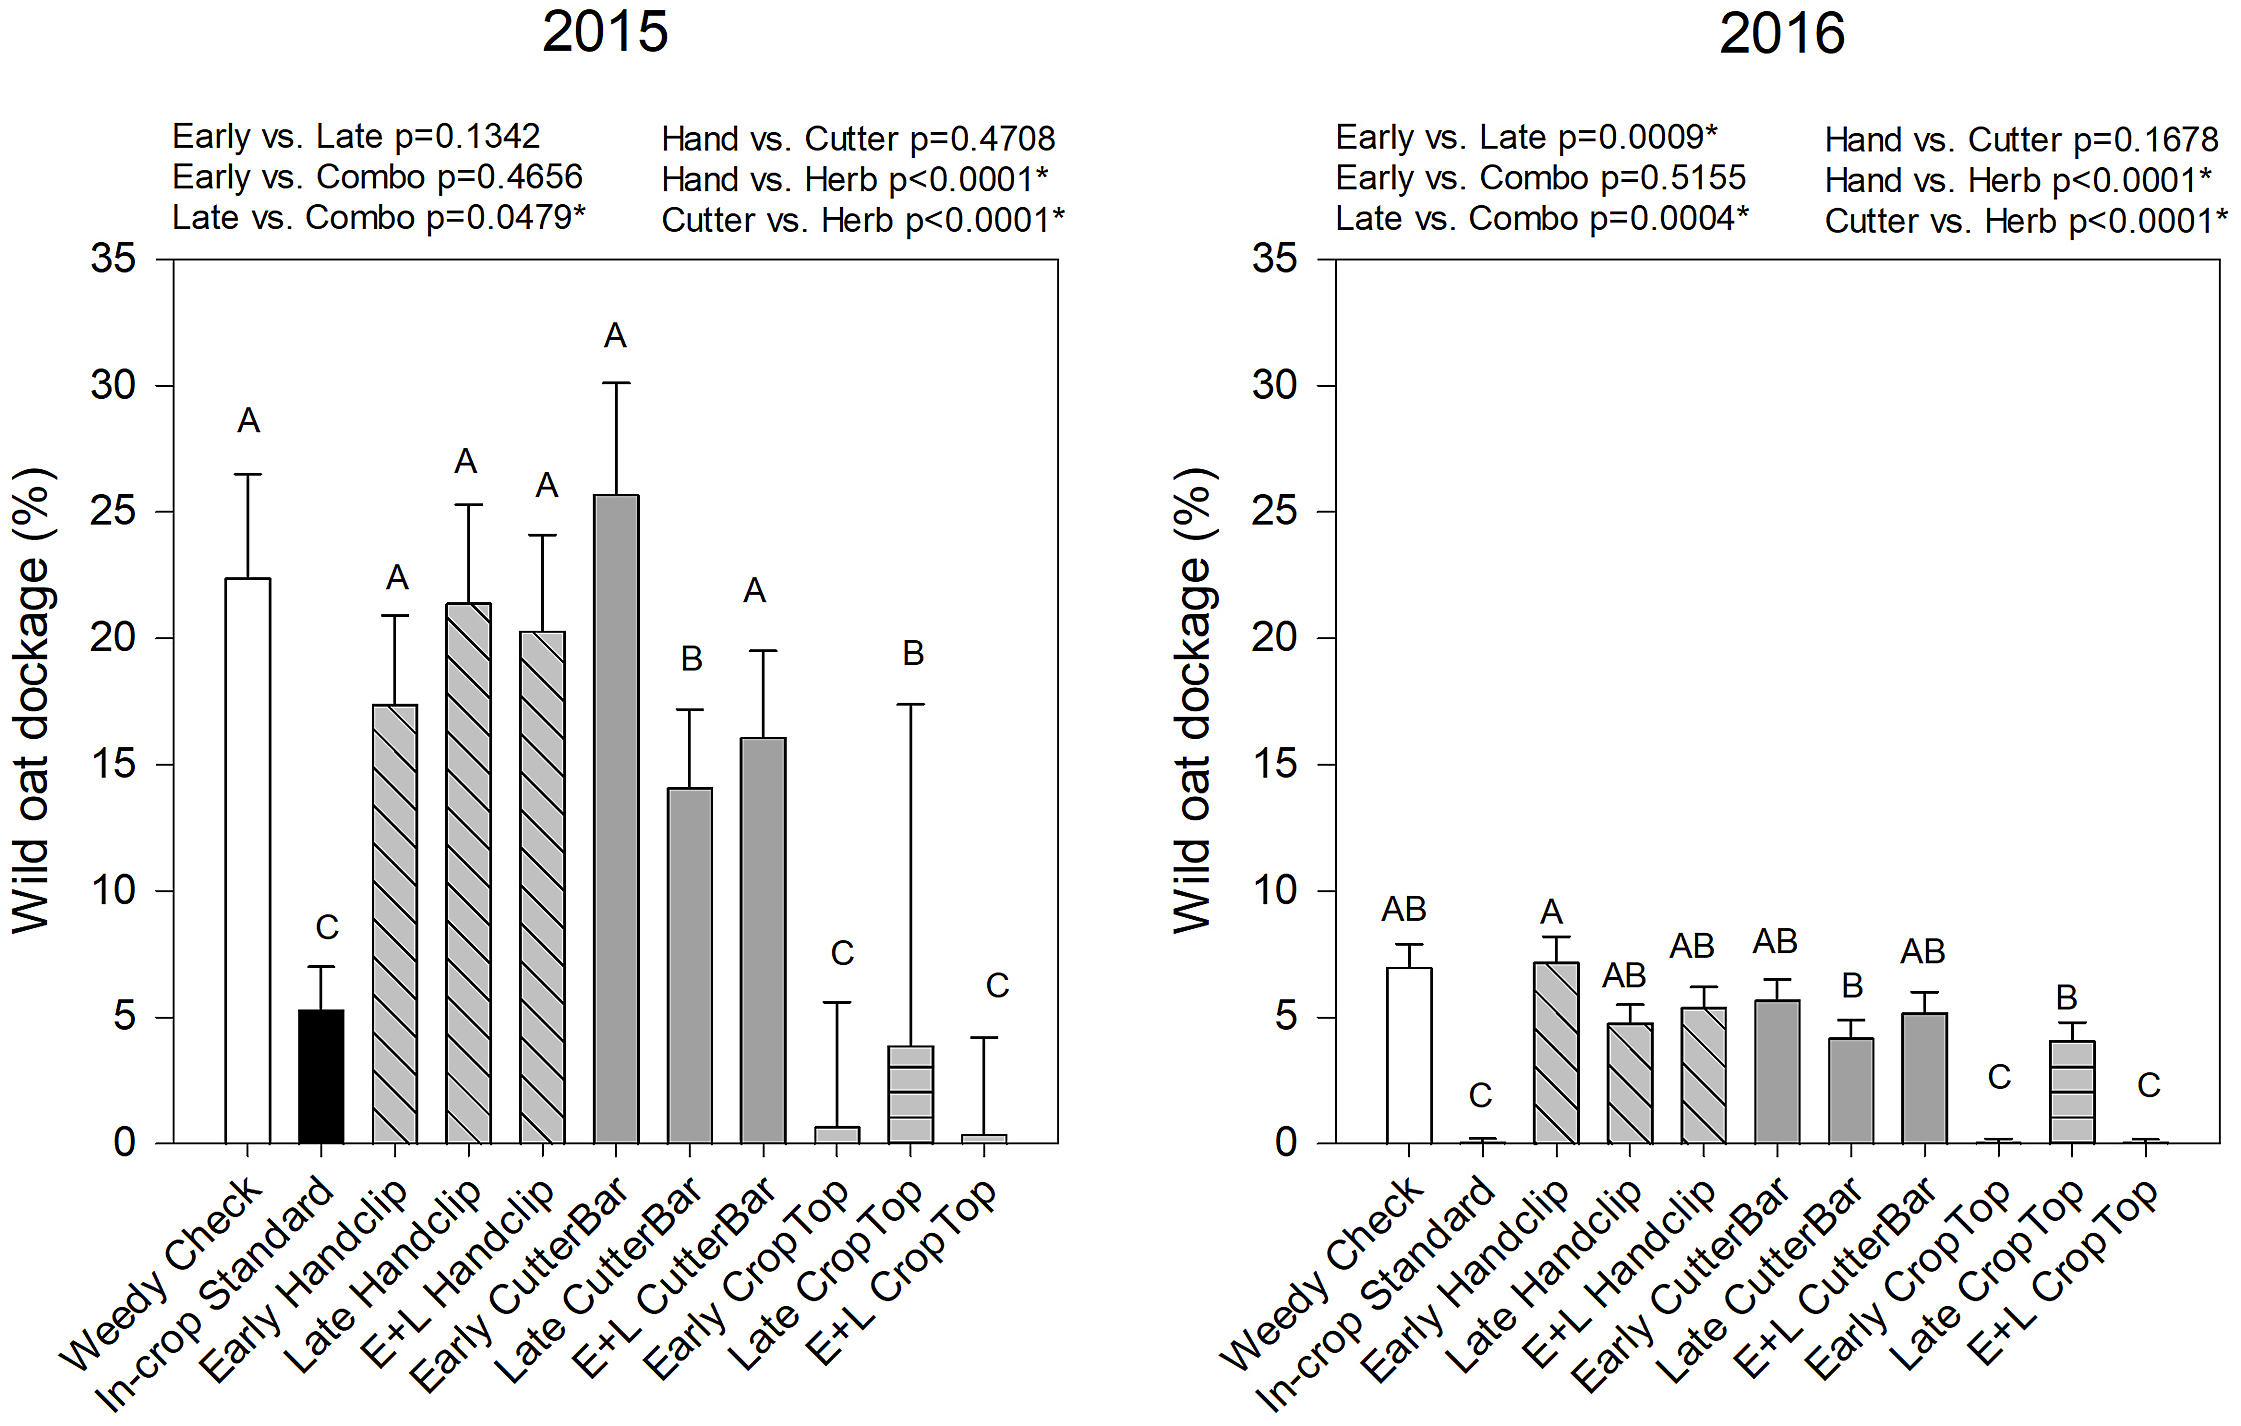
Figure 3. Wild oat dockage from wheat in 2015 and 2016 as affected by the various imposed treatments. Bars indicate standard errors. Treatments with different letters are significantly different based on multiple means comparison using Tukey’s honestly significant difference test. White bars represent the weedy check, black bars indicate the in-crop standard, diagonal hashed bars are the hand-clipping treatments, solid gray bars are the cutter bar treatments, and horizontal lined bars are the crop topping treatments. Comparisons/contrasts by timing of application and type of removal method are listed above graphs for their respective years with comparisons and significance based on LSM estimate statements. An asterisk (*) indicates significance at α = 0.05. E+L indicates the combination early and late treatments.
Year, treatment, and their interaction also had a significant effect on wild oat seed viability (Table 2). In 2015, viability was lowest in those treatments with herbicide application, whether targeting the panicle or with the industry standard comparison (Figure 4). In 2016, the same treatments had the lowest viability, but fewer significant differences among treatments were observed (Figure 4). In both years, timing of treatment application did not have a significant effect on wild oat viability, but herbicide application to the panicle reduced wild oat viability by 10% to 30% compared to hand clipping or cutter bar treatments in both years (Figure 4). Because the herbicide used (pinoxaden) is systemic (Anonymous 2020), it makes sense that it would affect the viability of seeds in the dockage more than the clipping/cutter bar treatments, because the herbicide would be likely to be translocated to the seeds themselves and have some activity. It is interesting, however, that applications of the systemic herbicide not only decreased seed viability but also decreased dockage amounts, suggesting that the treatments reduced seed production in addition to reduced viability of those seeds that were produced.
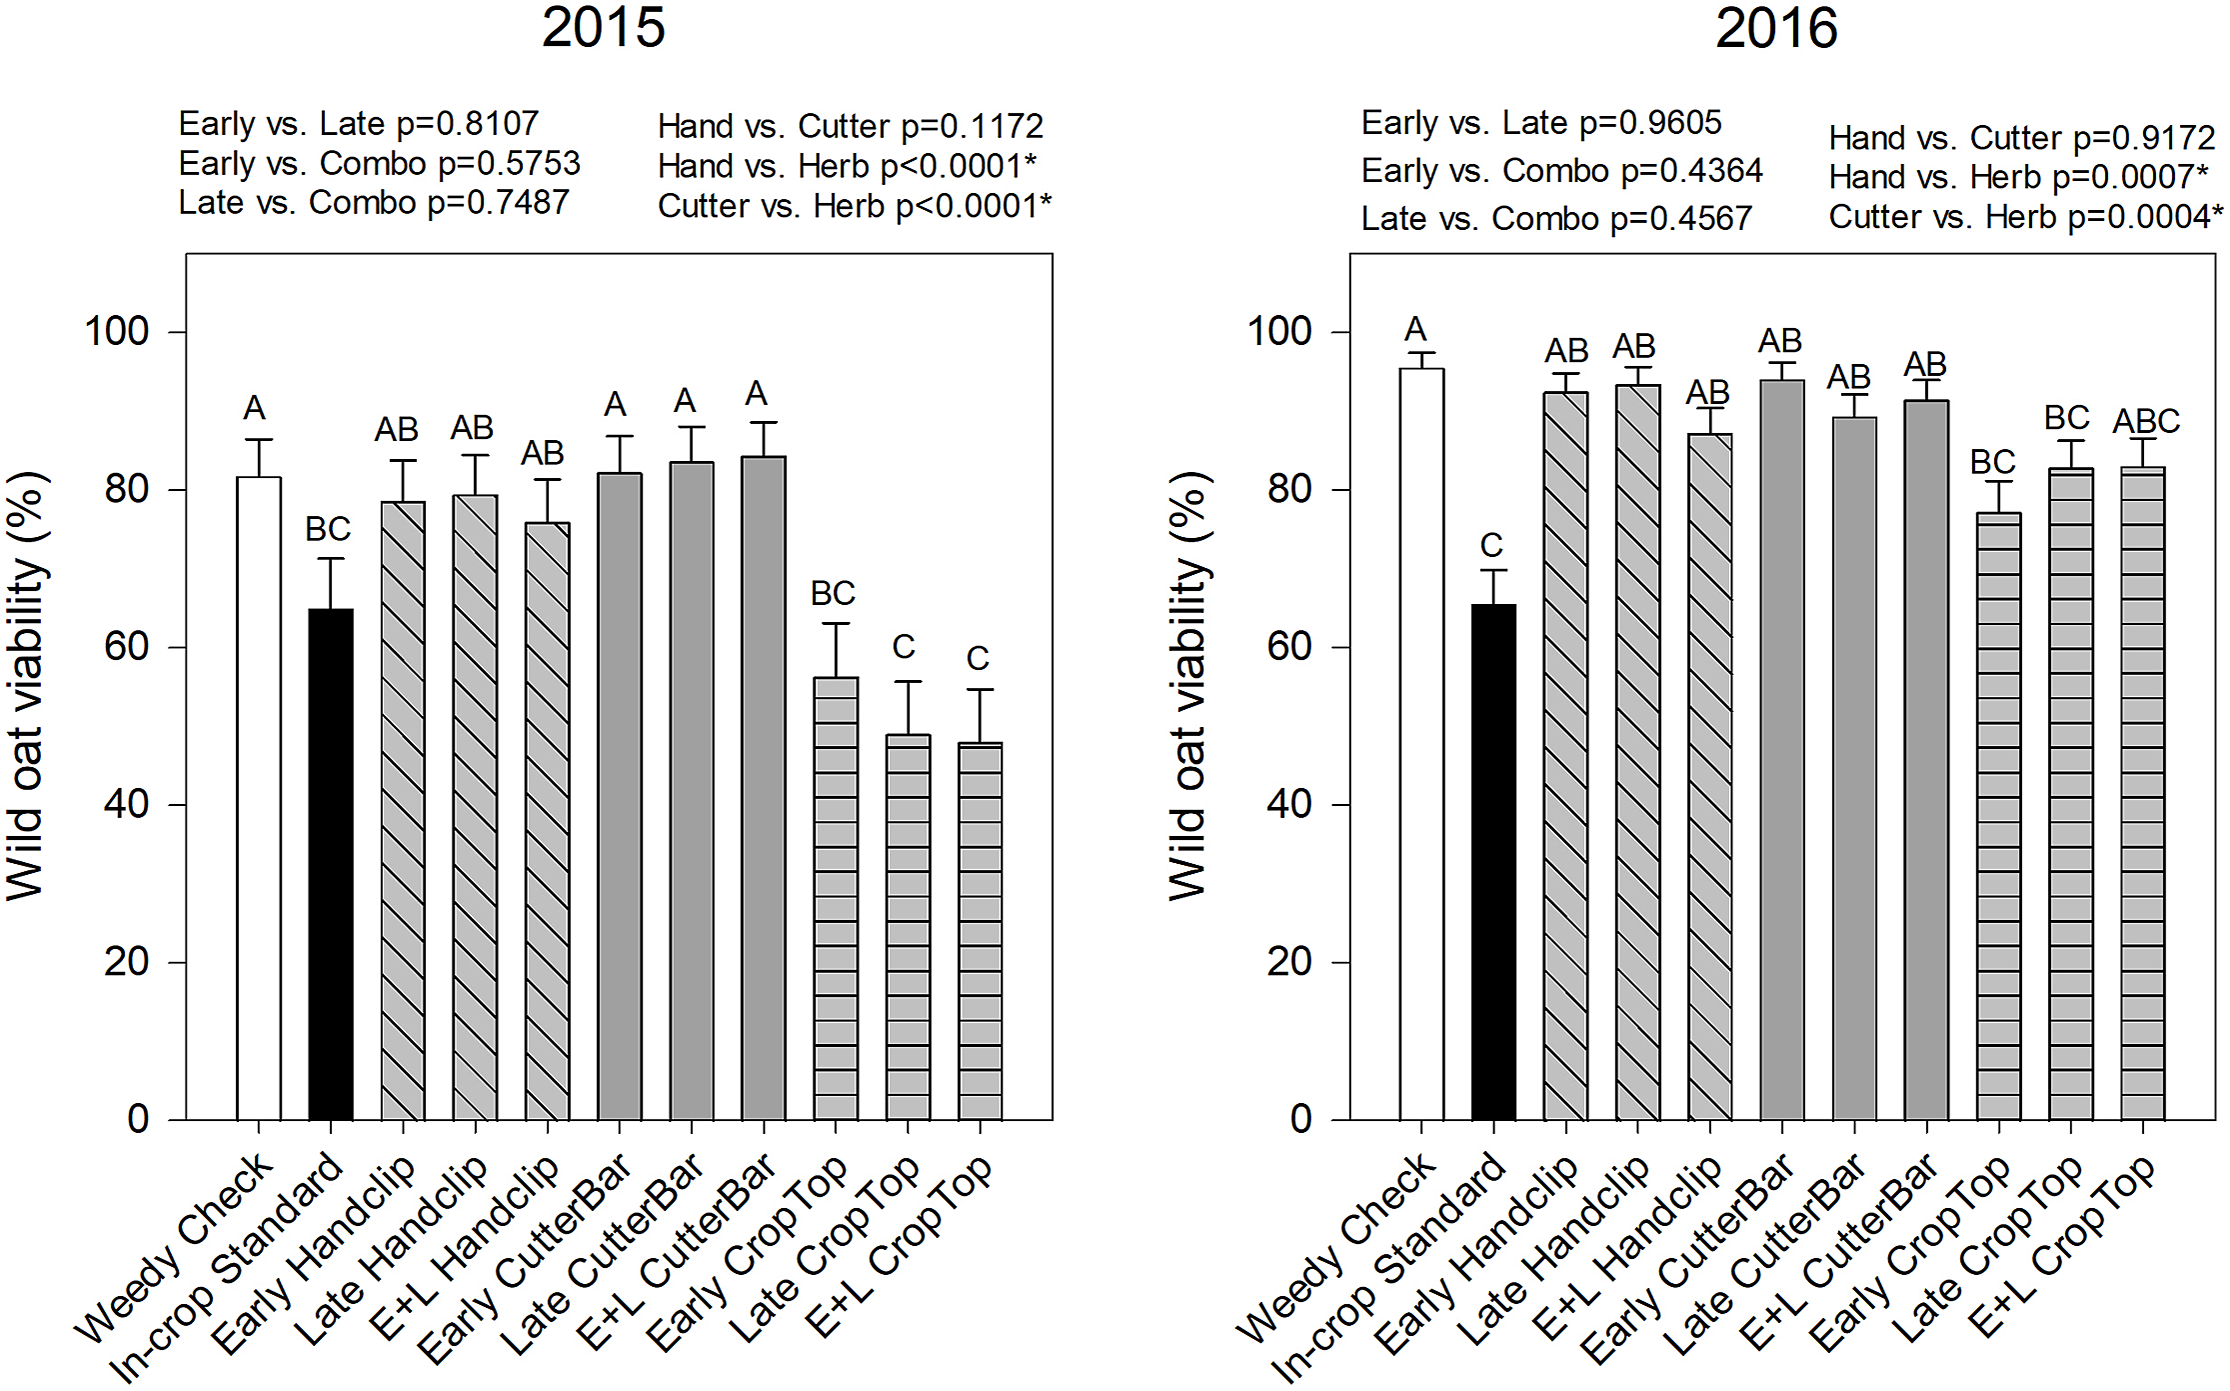
Figure 4. Wild oat viability collected from the wheat dockage samples in 2015 and 2016. Treatments with different letters are significantly different based on multiple means comparison using Tukey’s honestly significant difference test. Comparisons/contrasts by timing of application and type of removal method are listed above graphs for their respective years with comparisons and significance based on LSM estimate statements. An asterisk (*) indicates significance at α = 0.05. E+L indicates the combination early and late treatments.
Wild oat density in the subsequent canola crop was also affected by treatment, year, and their interaction (Table 2). In 2015, the density was lowest in the early and the combination timing crop topping applications of herbicide (Figure 5). These treatments also had the lowest density in 2016 along with the industry standard application of in-crop wild oat herbicide (Figure 5). This indicates that the benefits of the herbicide application timing (reduced seed set and viability) carried through to effects on the wild oat population the following year. The clipping treatments were not significantly different from the weedy check in either year (with the exception of the late cutter bar treatment in 2015; Figure 5). This suggests that while clipping may reduce seed set, subsequent tillering and seed production, or the inability to clip full panicles in cereal crops due to height overlap (Tidemann et al. Reference Tidemann, Harker, Johnson, Willenborg and Shirtliffe2020), reduced the benefit of this practice. In both years, early and combination treatments reduced density more than late-applied treatments. It is possible that late-applied treatments resulted in the deposition of viable clipped seeds into the soil seedbank (Tidemann et al. Reference Tidemann, Harker, Johnson, Willenborg and Shirtliffe2020). In addition, in both years, herbicide was the most effective panicle treatment option.
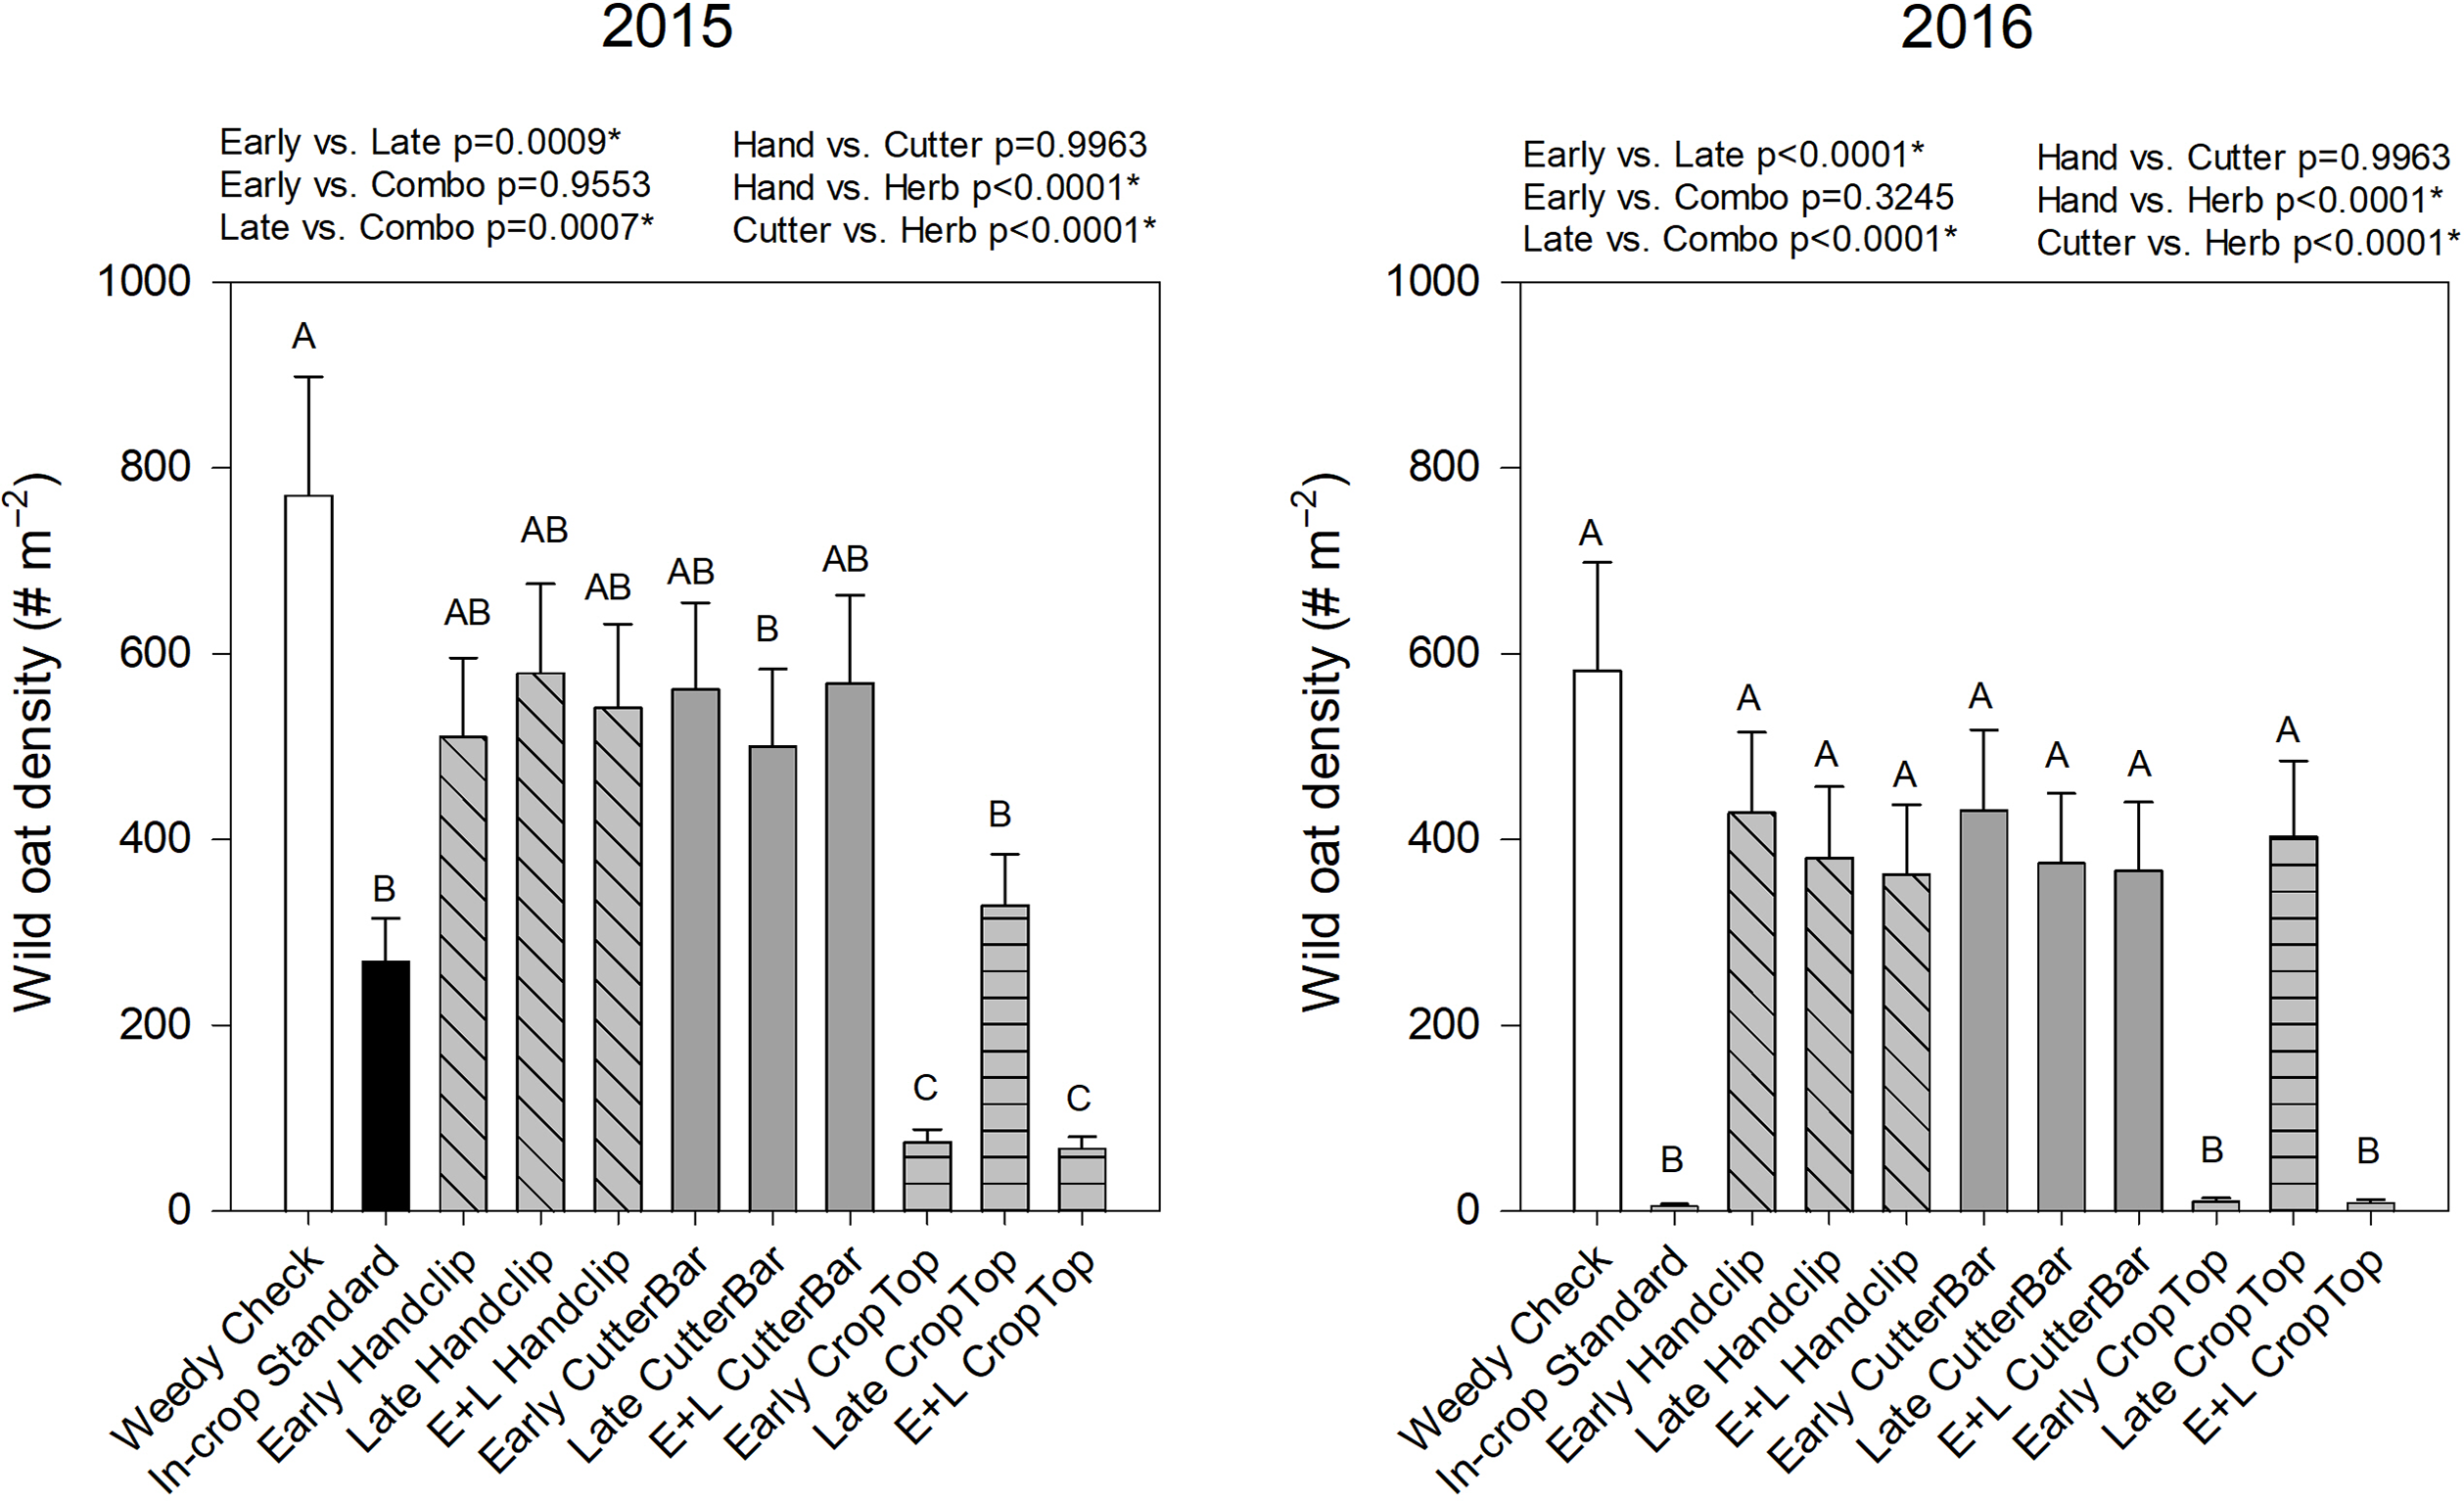
Figure 5. Wild oat density in the canola year (2nd year) of the studies beginning in 2015 and 2016, respectively. Treatments with different letters are significantly different based on multiple means comparison using Tukey’s honestly significant difference test. Comparisons/contrasts by timing of application and type of removal method are listed above graphs for their respective years with comparisons and significance based on LSM estimate statements. An asterisk (*) indicates significance at α = 0.05. E+L indicates the combination early and late treatments.
Wild oat biomass was significantly affected by treatment and the year by treatment interaction (Table 2). In 2015, the early and combination herbicide treatments had the lowest wild oat biomass but were equivalent to the industry standard in-crop herbicide application treatment in 2016 (Figure 6). In 2015, all crop topping treatments reduced wild oat biomass in comparison to the weedy check; however, the late crop topping treatment in 2016 did not significantly reduce the biomass (Figure 6). Only in the 2016 study was biomass significantly lower in early- than in late-applied treatments, whereas combination (early plus late) applied treatments had significantly lower biomass than the late treatments in both years. In addition, the herbicide treatments were significantly different than the hand cutting or cutter bar treatments with the herbicide treatments leading to the lowest biomass. Biomass data again show that the crop-topping treatments applied in Year 1 had a significant effect on the wild oat biomass in the subsequent year, while clipping treatments did not affect biomass.
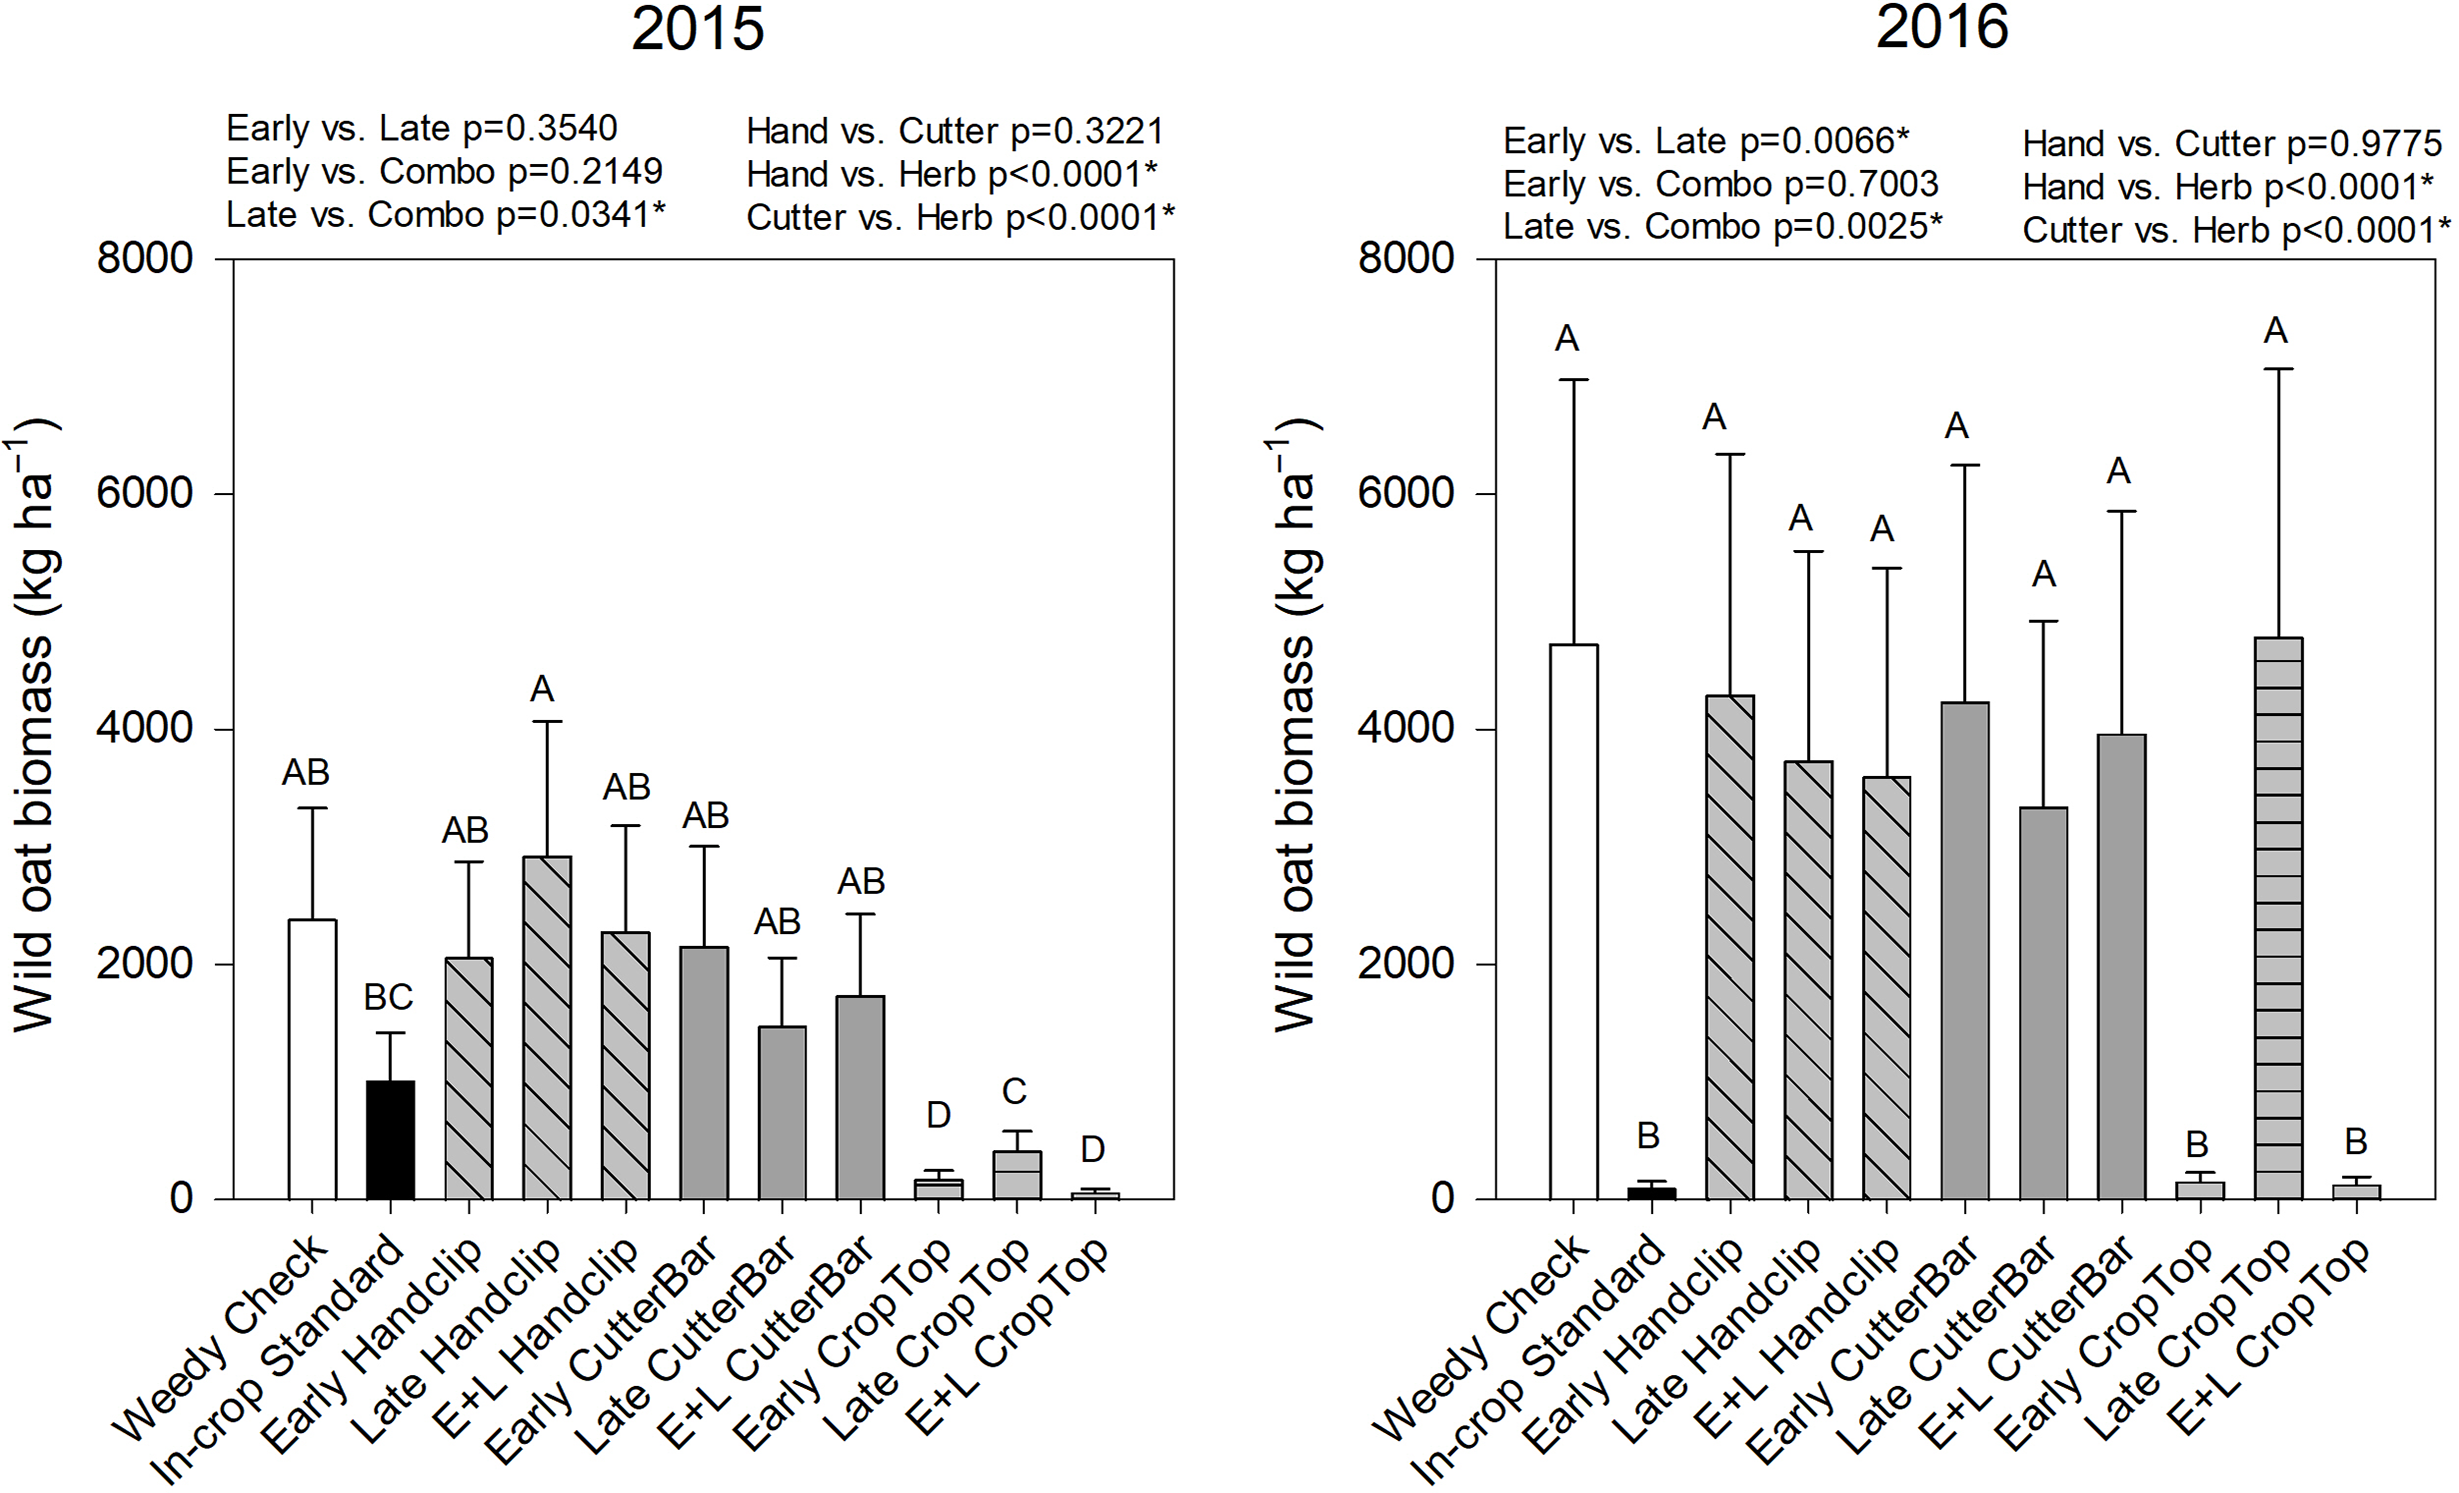
Figure 6. Wild oat biomass in the canola year (2nd year) of the studies beginning in 2015 and 2016, respectively. Treatments with different letters are significantly different based on multiple means comparison using Tukey’s honestly significant difference test. Comparisons/contrasts by timing of application and type of removal method are listed above graphs for their respective years with comparisons and significance based on LSM estimate statements. An asterisk (*) indicates significance at α = 0.05. E+L indicates the combination early and late treatments.
Canola yield was significantly affected by year, treatment, and the year by treatment interaction (Table 2). Yields were generally lower in 2016 than in 2015 (Figure 7). In both years, the industry standard in-crop application, the early crop topping, and the early plus late combination crop topping treatment resulted in higher canola yields than either the weedy check or the clipping treatments (Figure 7). In 2015, the late crop topping treatment also resulted in increased canola yield; however, this difference was not apparent in 2016 (Figure 7). This was potentially due to differences in wild oat tillers being active in reproduction between 2015 and 2016. If more tillers were in the reproductive phase and beginning to produce seed in the 2015 season than the 2016 season during the late crop topping application, the treatment may have reduced additional seed set more in 2015 than it did in 2016. This is pure speculation because we did not study tiller stages during the trial. There is likely some morphology or staging difference that was not observed between years, even though the late application occurred at the same plant phenological stage (initiation of seed shed) to result in the type of difference observed between years. In 2015, there were no significant differences between application timings, although the late was significantly better than combination timings in 2016 (Figure 7). In both years, the crop topping treatments significantly reduced wild oat biomass compared to the hand clipping and cutter bar treatments. Although no treatments were applied in the canola growing year, differences in the wild oat populations were observed based on treatments in the initial year, which resulted in differences in canola yield. The scale of the treatment impact, particularly crop topping, was large enough to be visible at crop yield in the year subsequent to treatment implementation.
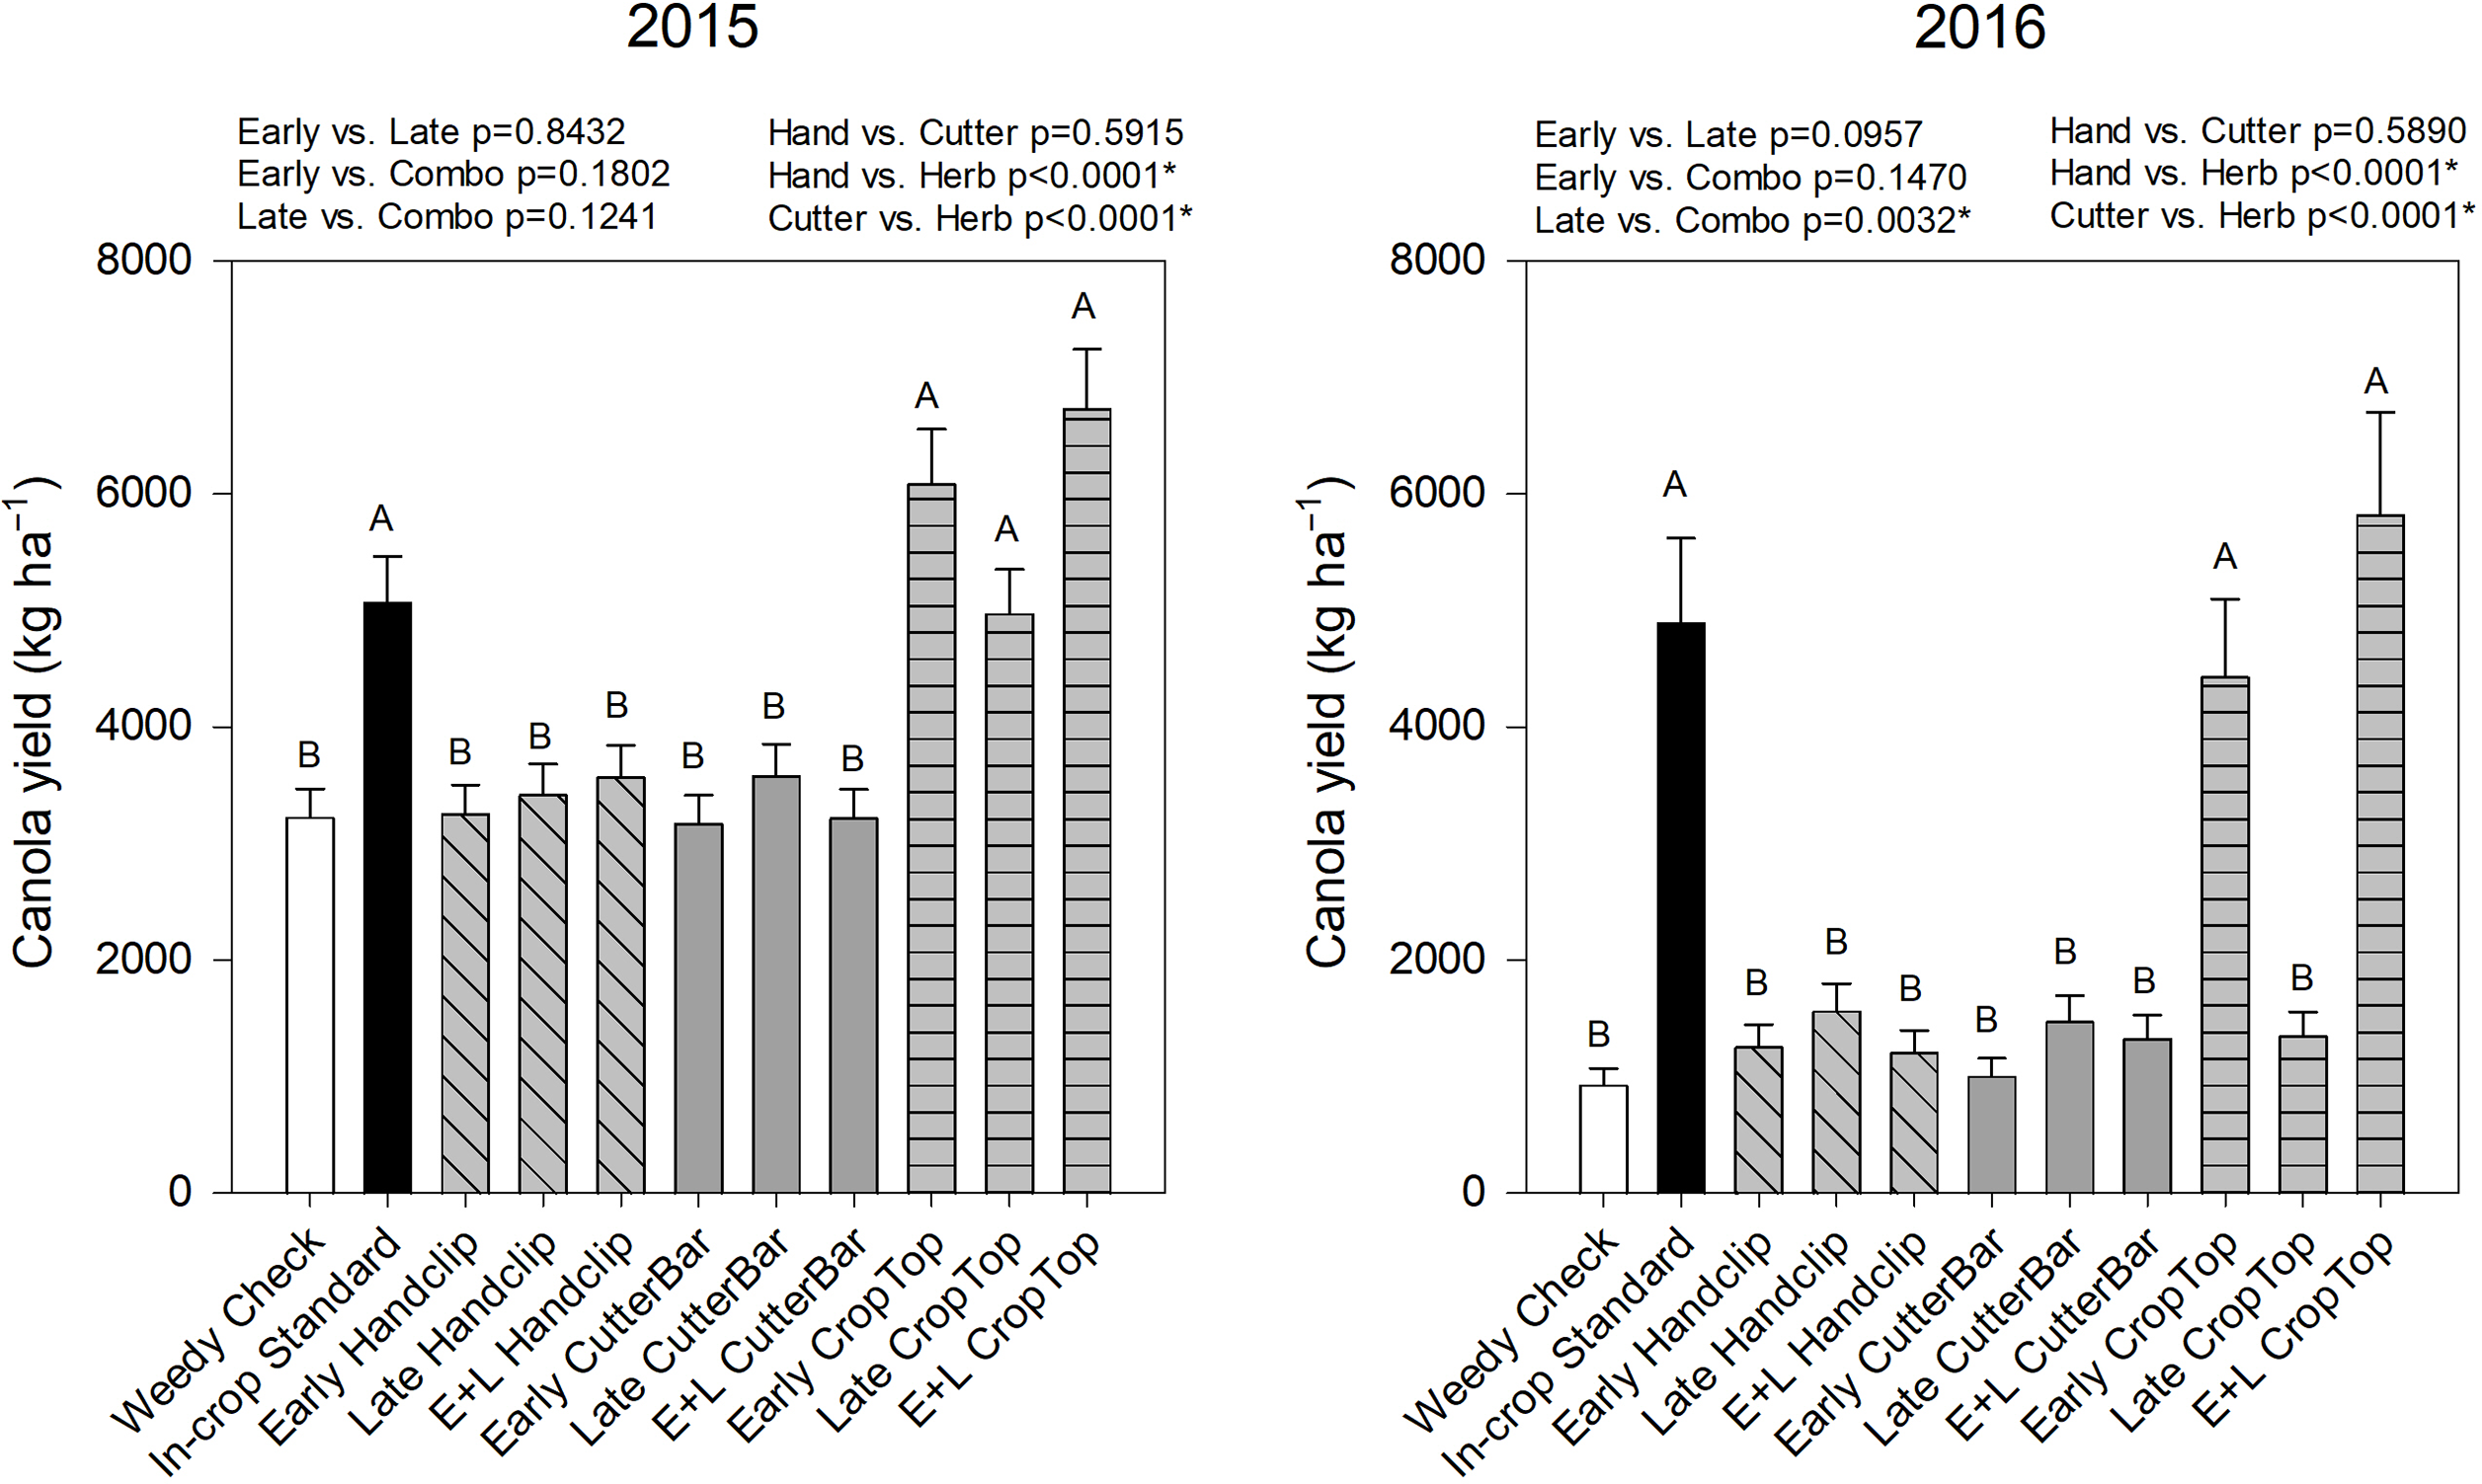
Figure 7. Canola yield in the 2nd year of studies beginning in 2015 and 2016, respectively. Treatments with different letters are significantly different based on multiple means comparison using Tukey’s honestly significant difference test. Comparisons/contrasts by timing of application and type of removal method are listed above graphs for their respective years with comparisons and significance based on LSM estimate statements. An asterisk (*) indicates significance at α = 0.05. E+L indicates the combination early and late treatments.
Wild oat dockage in the canola year was significantly affected by year, treatment, and the year by treatment interaction (Table 2). The 2015 year showed some variability in dockage levels (Figure 8). The lowest dockage was measured in the crop topping treatments, followed by the industry standard in-crop herbicide application (Figure 8). In 2016, the lowest wild oat dockage was only in the early and early plus late crop topping treatments as well as the industry standard in-crop herbicide application (Figure 8). It was evident again here that the late herbicide application was not as effective in 2016 as it was in 2015. In terms of timing of applications, the late treatments were significantly less effective than the combination treatments in both years, and significantly less effective than the early treatment in 2016. In both years, the herbicide crop topping treatment significantly reduced dockage compared to both the cutter bar and hand clipping treatments. These data showed that the effect of the treatments in the first year carried through to the subsequent wild oat population, but they also carried through to seed production as well.
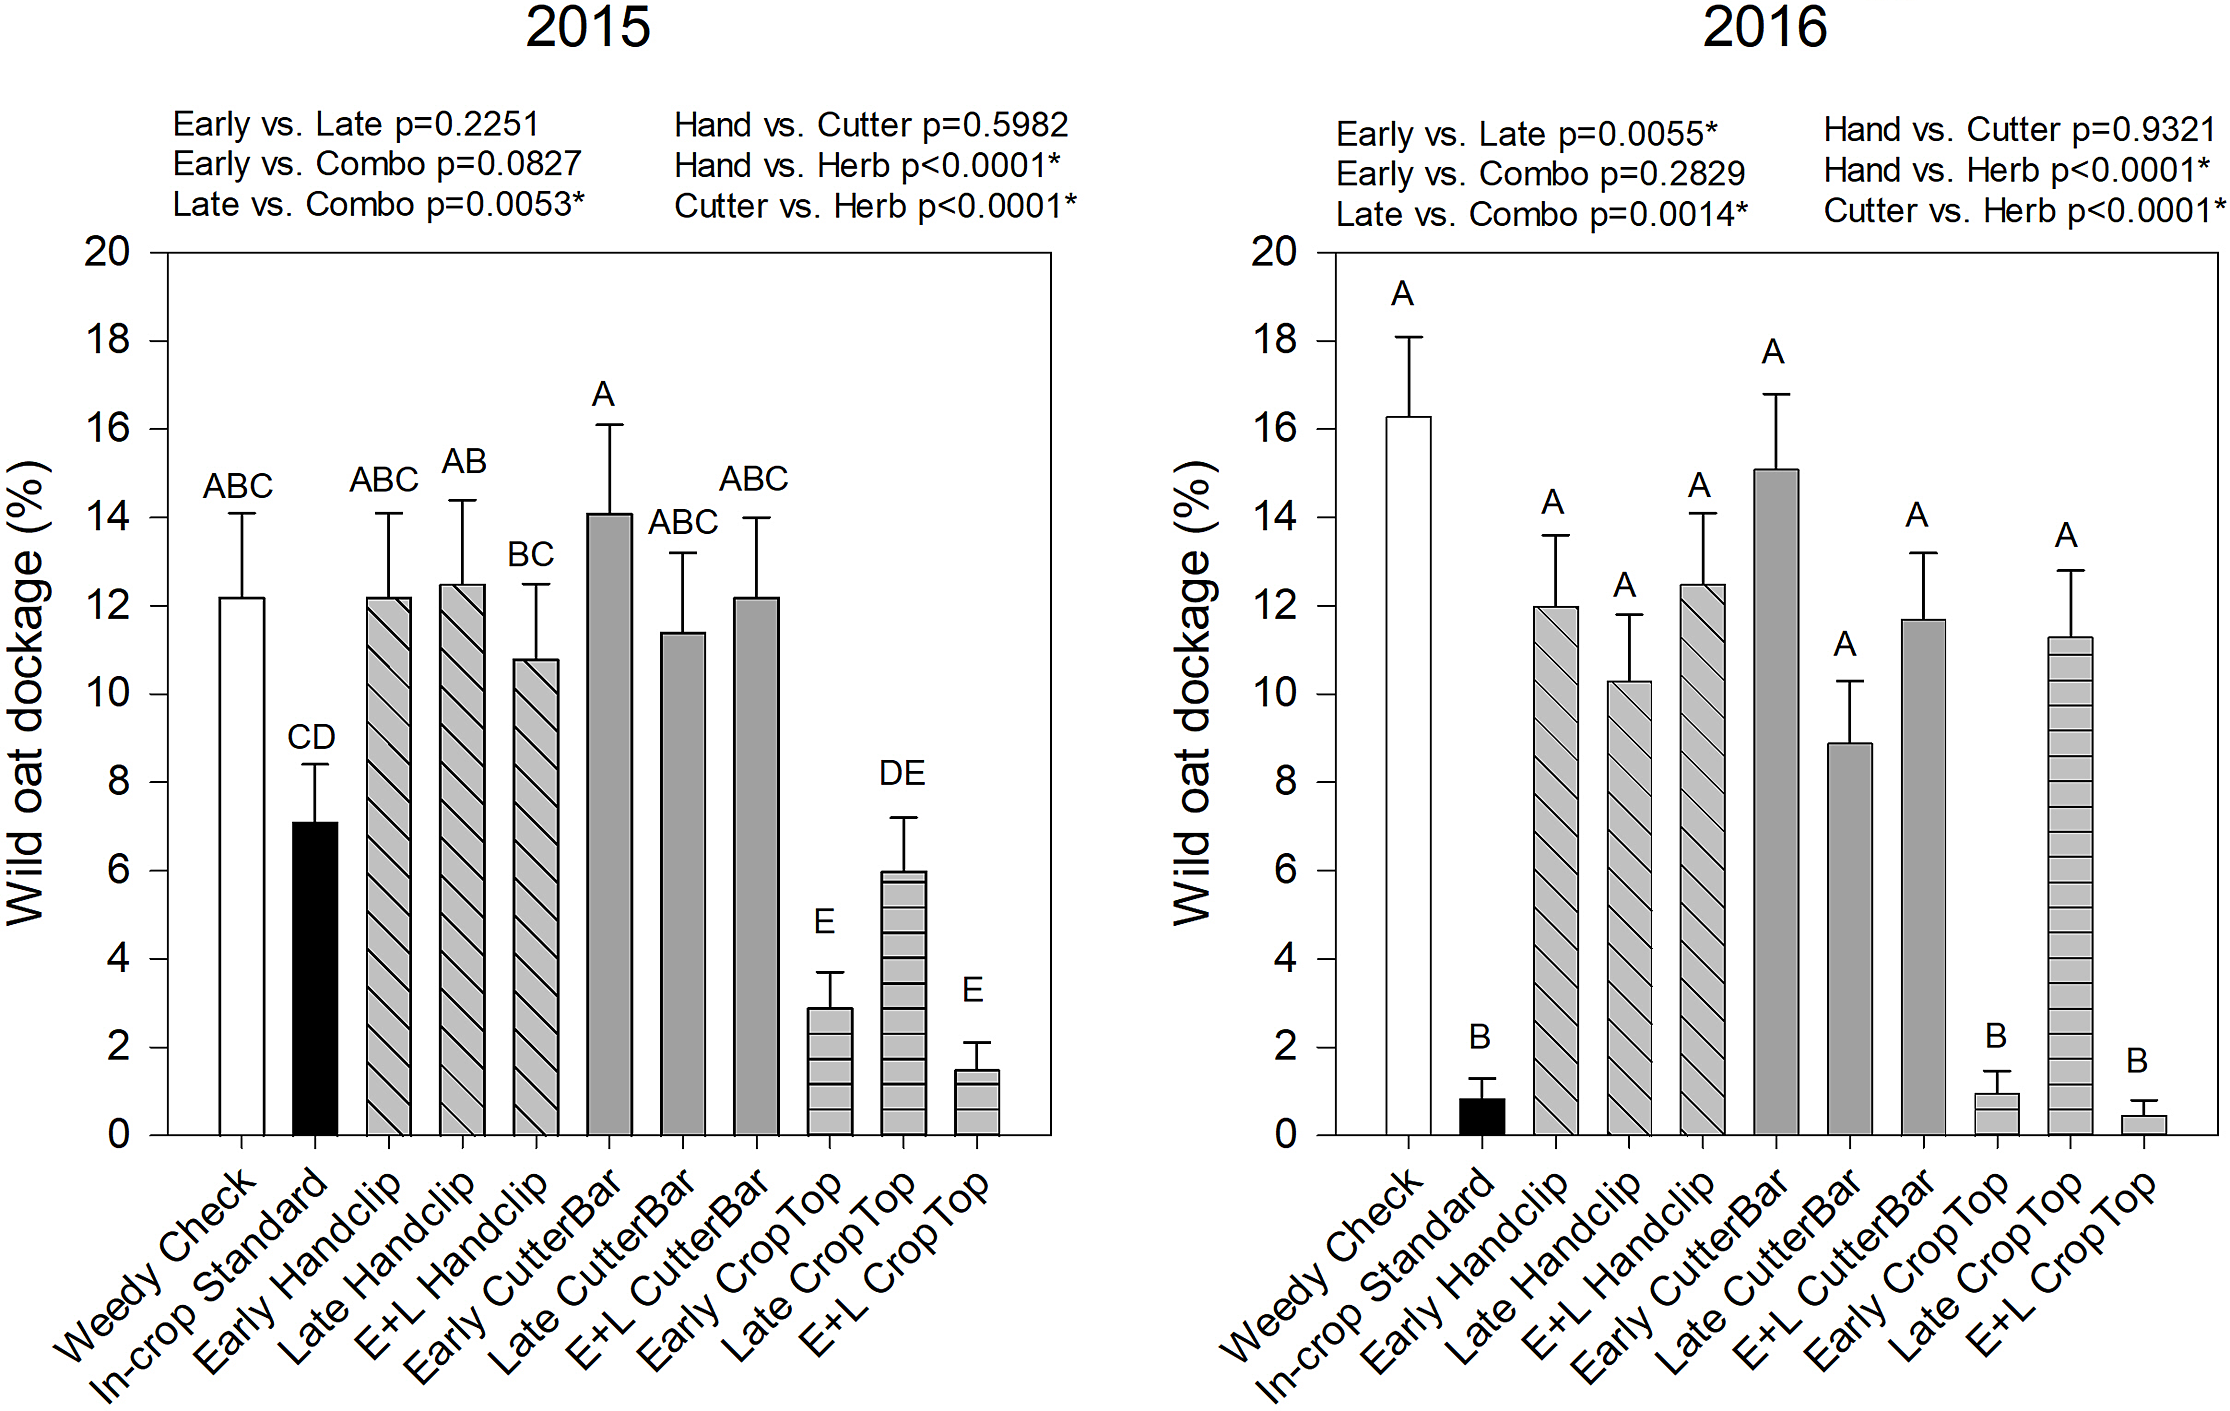
Figure 8. Wild oat dockage from canola (2nd year) of studies beginning in 2015 and 2016, respectively. Treatments with different letters are significantly different based on multiple means comparison using Tukey’s honestly significant difference test. Comparisons/contrasts by timing of application and type of removal method are listed above graphs for their respective years with comparisons and significance based on LSM estimate statements. An asterisk (*) indicates significance at α = 0.05. E+L indicates the combination early and late treatments.
The wild oat seedbank also exhibited similar trends to those previously described. The seedbank density was affected by year, treatment, and year by treatment interaction (Table 2). Seedbank numbers were far higher in the 2016 study than the 2015 study (Figure 9). In 2015, only the early and the combination crop topping treatments reduced the wild oat seedbank while even the industry standard in-crop treatment did not when compared to the weedy check (Figure 9). In the 2016 study, the industry standard in-crop treatment had the lowest wild oat seedbank density, followed by the early and combination crop topping treatments (Figure 9). All three treatments in the 2016 study resulted in significantly lower seedbank densities than the rest of the treatments. In both years, the early and combination treatments resulted in a reduced wild oat seed bank in comparison to the late treatments, while the crop topping treatments resulted in significant reductions compared to hand clipping or cutter bar treatments. It was interesting that with only a single year of application, crop topping impacts were immediately observable, whereas the impacts of the clipping treatments were not.
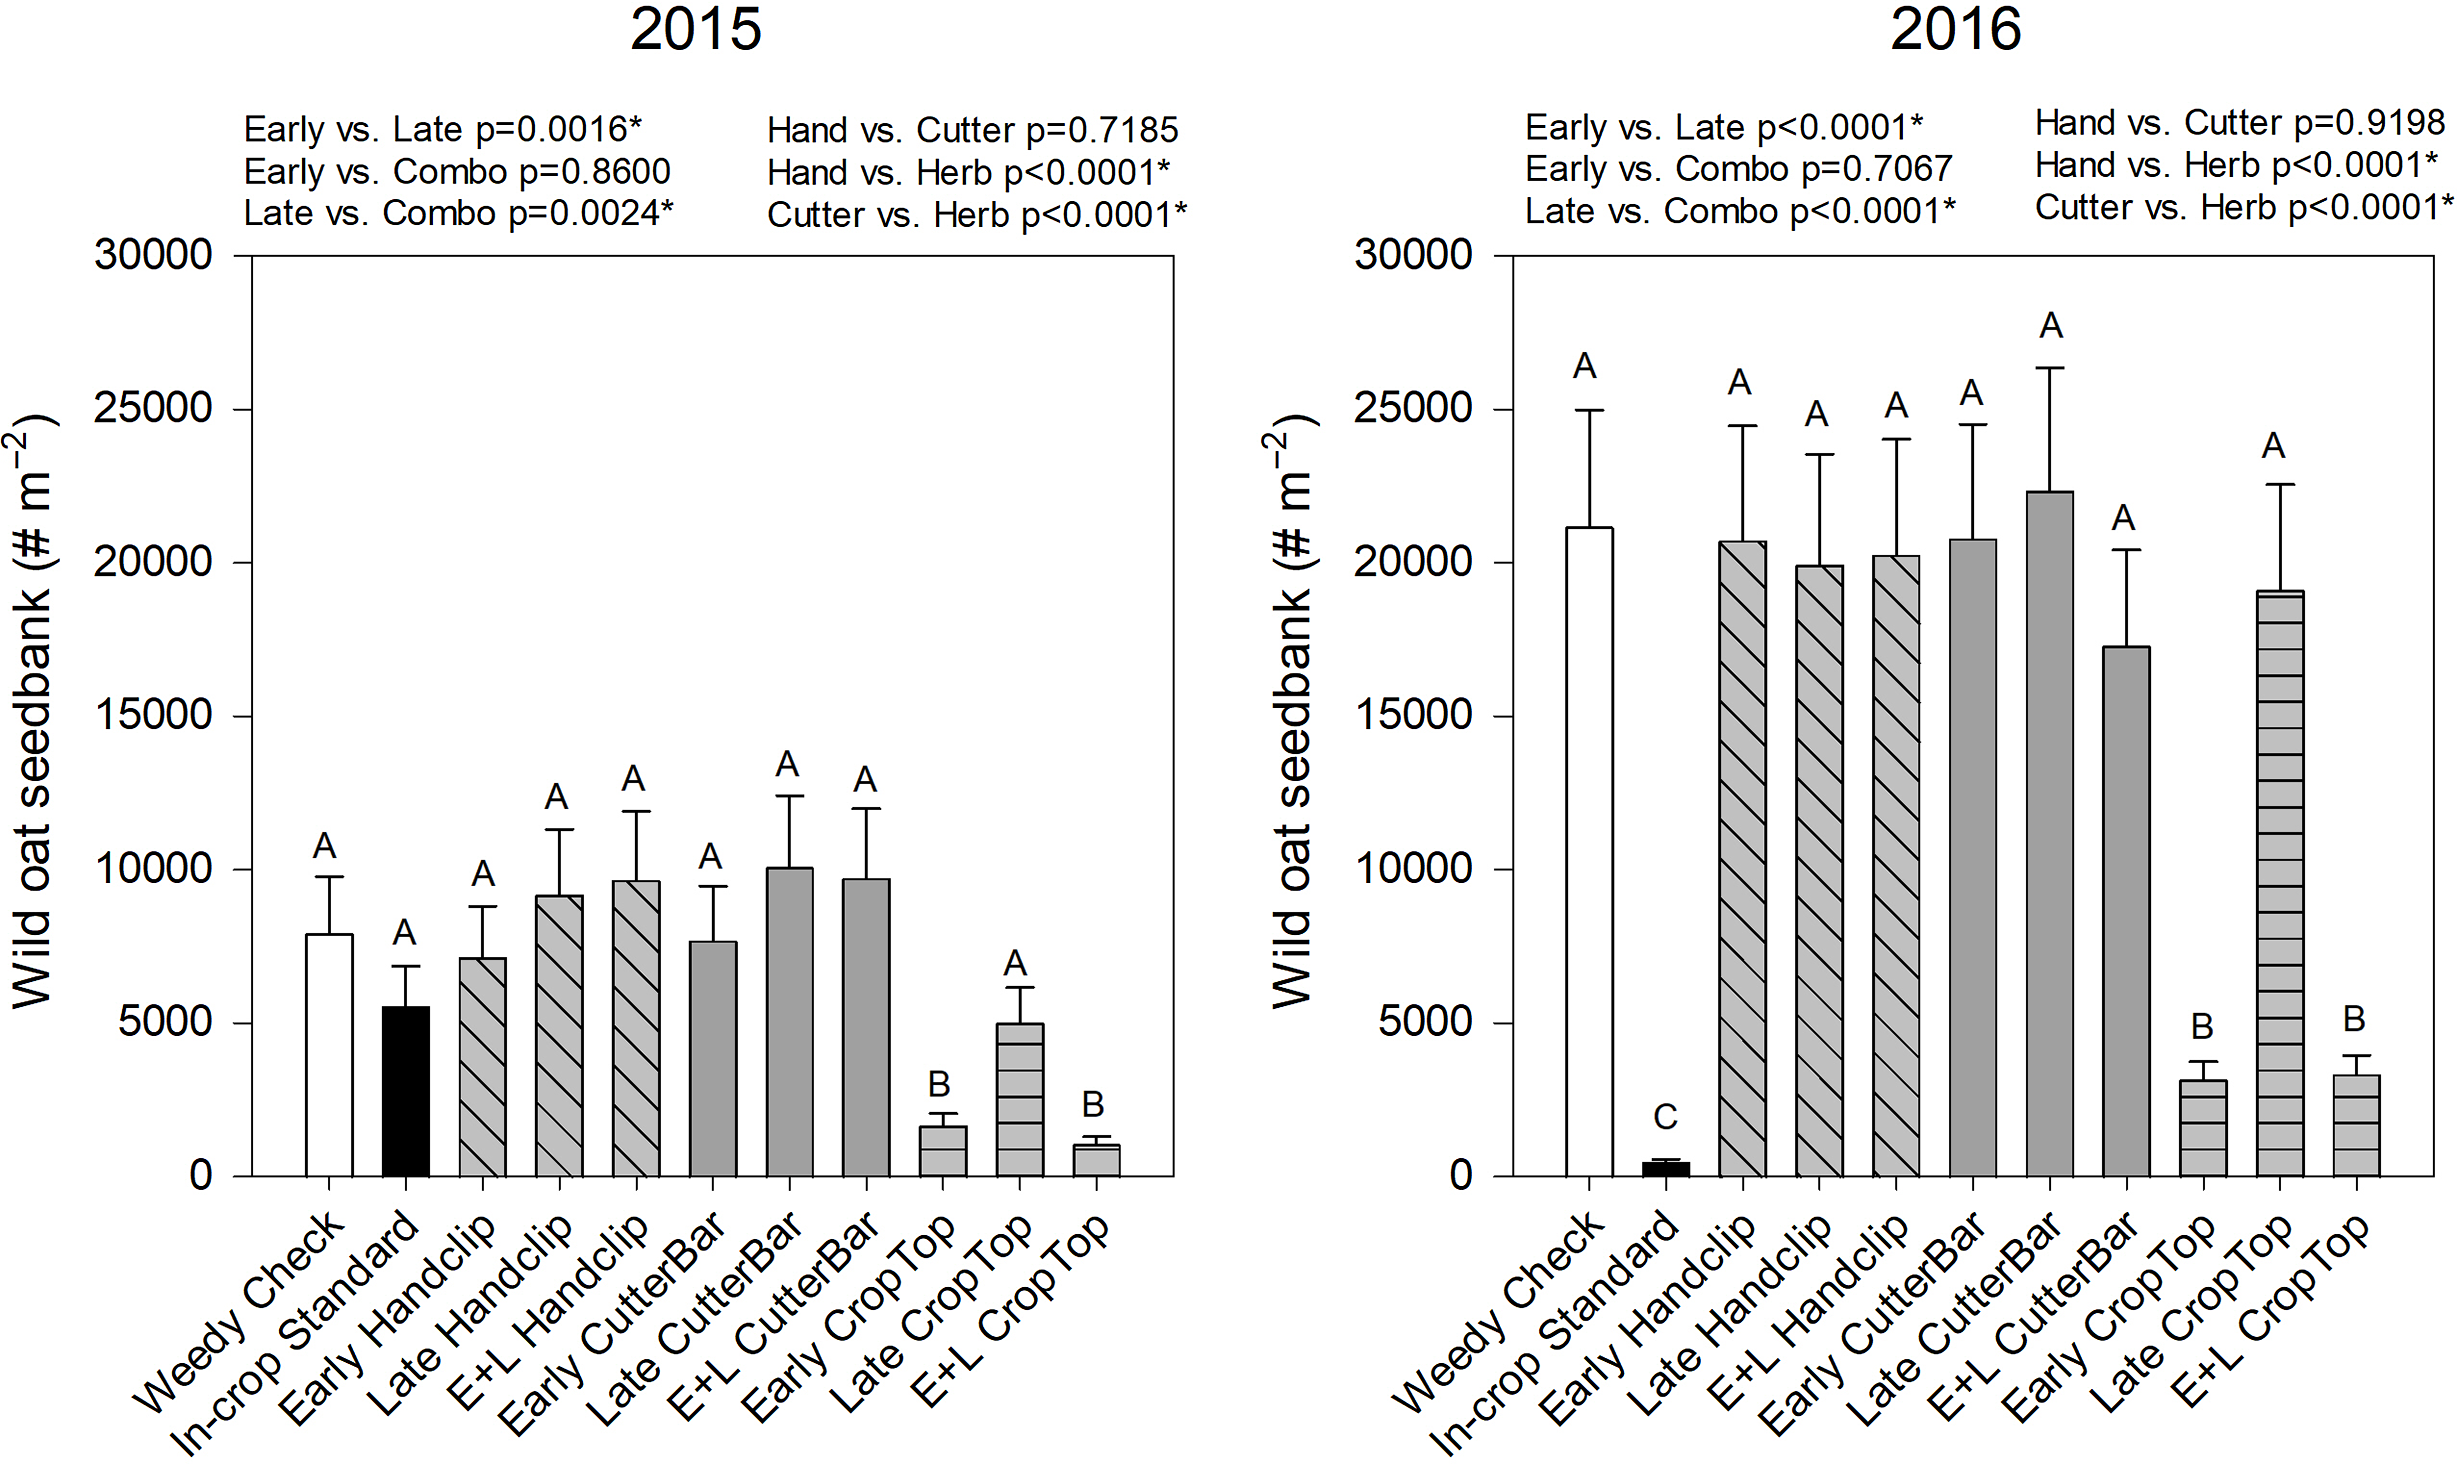
Figure 9. Wild oat seedbank densities following the 2nd (canola) year of studies initiated in 2015 and 2016, respectively. Treatments with different letters are significantly different based on multiple means comparison using Tukey’s honestly significant difference test. Comparisons/contrasts by timing of application and type of removal method are listed above graphs for their respective years with comparisons and significance based on LSM estimate statements. An asterisk (*) indicates significance at α = 0.05. E+L indicates the combination early and late treatments.
Panicle Removal Timing
Unexpectedly, panicle removal timing affected Year 1 (year of treatment) wild oat dockage only (Table 3). There was a significant interaction of location, crop, and clipping timing on wild oat dockage in Year 1 (Table 3). Because wild oat dockage was not measured in Saskatoon in Year 1, this variable is compared only within the Lacombe locations/site-years.
Table 3. Significant effects in the panicle removal timing experiment for each tested variable based on an analysis of variance using the GLIMMIX procedure in SAS 9.4 (SAS, 2013). a

a Bolded P-values indicate significance at an α = 0.05.
b Wild Oat Dockage was measured in Lacombe only; not in Saskatoon.
Overall, dockage was lower in 2015 than in 2016, particularly in lentil, while dockage in wheat between years was more similar (Figure 10). The Tukey’s comparison compares clipping dates within crop and year. There were no significant differences between clipping timings in either crop in 2015 (Figure 10). There were also no significant differences between clipping timings in wheat in 2016 (Figure 10). In lentil in 2016, wild oat dockage in wheat was reduced by clipping in Weeks 3, 4, and 5 (Figure 10). This same trend was clearly not visible in the lentils in 2015. The lack of response in wheat was potentially related to lack of height differentiation between the wheat and the wild oat, limiting the number of seeds exposed to clipping treatments. The difference in the lentils between the two years may be related to higher levels of precipitation in September 2015, which resulted in more regrowth and tillering in that year, which in turn resulted in more wild oat seed production and limited the impact of the clipping treatments on dockage. Plant regrowth was not observed in this study, so it was not possible to confirm this theory. Alternatively, seed shed may have been initiated by the time of harvest in 2015, resulting in an “equalization” of available seeds by the time of harvest. This could again be related to differences in precipitation and heat resulting in different maturity between years (Table 1).
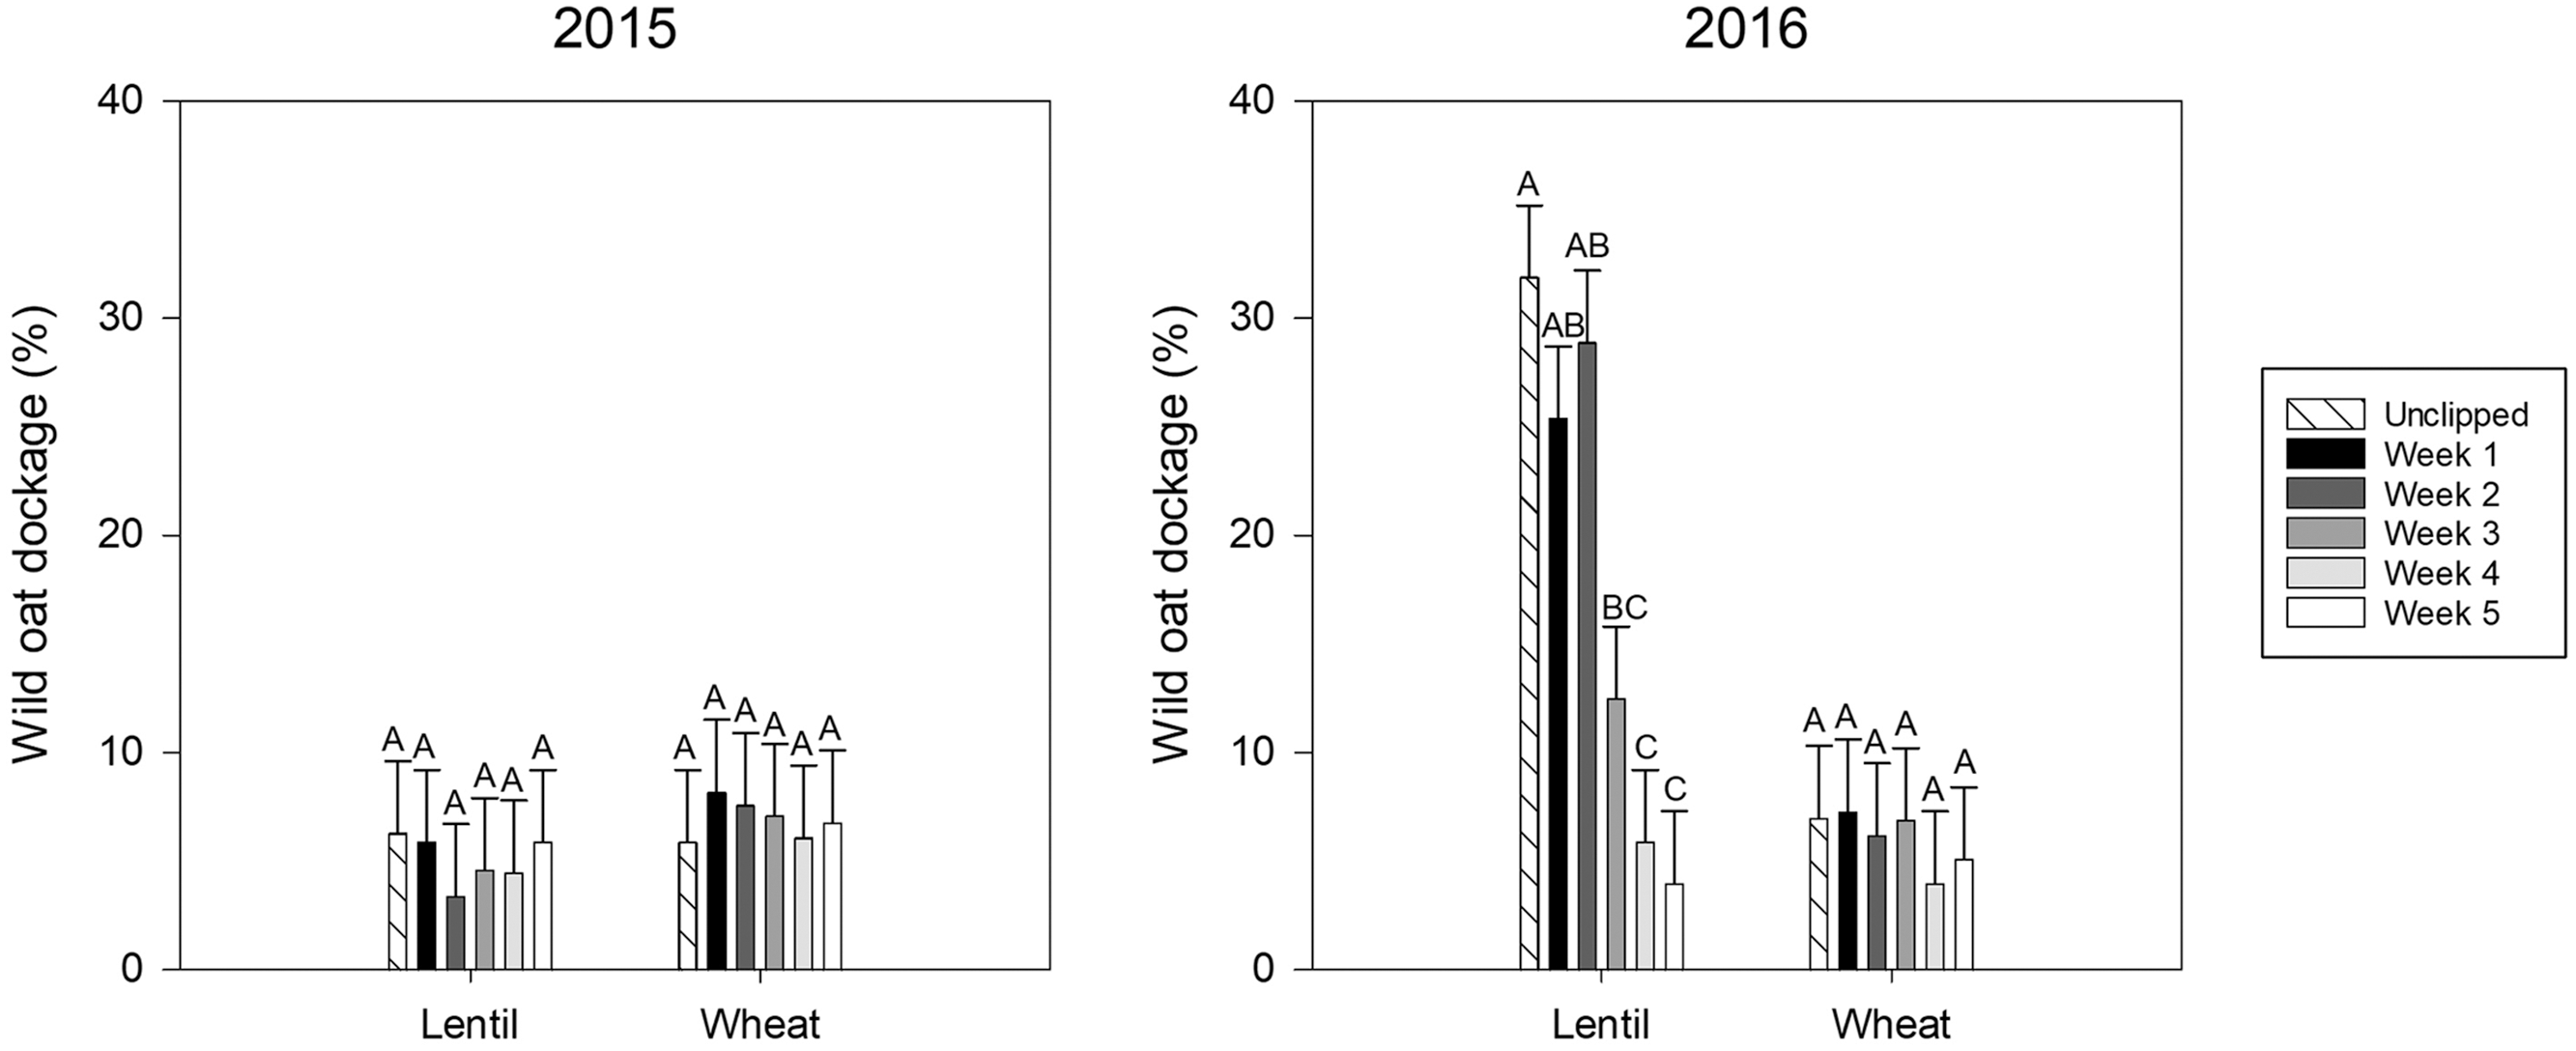
Figure 10. Year 1 (wheat and lentil) wild oat dockage for the panicle removal timing experiment by location, crop, and clipping timing. Bars indicate standard errors. These measurements were taken in Lacombe only.
Beta-spline regressions were not significant for any wild oat variables over clipping timings (data not shown). Overall, clipping timing had limited effects on the measured variables, and no optimal clipping time was clearly identifiable via basic ANOVA or via beta-spline regression. Other wild oat and crop variables (Year 1 wild oat density and crop yield; Year 2 wild oat density, crop yield, wild oat dockage, and wild oat biomass) were significantly affected by location and first year crop but were not affected by clipping timing or its interaction with other fixed effects (Table 3). The LS means for these variables were reported in Table 4; however, the data provided limited insight into our ability to use clipping for wild oat management. We were unable to identify the optimal timing to implement clipping of wild oat panicles in lentil and wheat cropping systems from this study. It is clear that a lack of impact of clipping treatments in the first study is not as a result of nonoptimal clipping time, but a lack of efficacy of the clipping treatments themselves. However, considering the results of the first study, there are some potentially important implications to the limited impact of the weekly clipping treatments.
Table 4. Least squares (LS) means for variables with significant location by crop interactions in the panicle removal timing study. a

a Year 2 variables were measured during the canola growing season but are listed based on the initial year’s crop. La15 represents Lacombe in 2015, La16 is Lacombe 2016, SK is Saskatoon in 2015 and 2016, respectively. Where standard errors were the same for all estimates they are listed above the LS means in parentheses.
First, the impact of clipping on wild oat populations is too small to measure after a single year of implementation. This may be explained in that, for cereal crops, we may not be able to clip enough of the panicle to prevent a large proportion of seed shed (Tidemann et al. Reference Tidemann, Harker, Johnson, Willenborg and Shirtliffe2020). This is less likely to be an issue in lentil. It is also possible that clipping promotes tillering and increased seed production on the tillers after clipping, negating the impact of clipping the main panicle and preventing that seed production. However, this was not measured in this study. It is also possible that repeated clips within a year would increase efficacy of this control measure, although tiller panicles may also be produced under the crop canopy. Research has shown that wild oat seeds produced within a canopy are less viable than those produced above a canopy (Lehnhoff et al. Reference Lehnhoff, Miller, Brelsford, White and Maxwell2013); however, this effect was not large enough to aid in wild oat population management in this study.
The other biological characteristic that might reduce the impact of clipping is wild oat dormancy (Beckie et al. Reference Beckie, Francis and Hall2012). It is possible that the seed production prevented by clipping is a small proportion of the total seedbank that would germinate the following year, minimizing the ability to measure the impact of clipping in the manner tested in this study. Although it is clear that the short-term impact is quite limited, this is not to say that clipping is an ineffective technique or warrants no further research. Indeed, other research has shown variability in clipping efficacy by weed species, so there is reason to believe that clipping can be an effective management technique (Riethmuller and Hashem Reference Riethmuller and Hashem2010). More research is necessary to determine whether the clipping technique affects wild oat populations over time, or whether the proportion of seeds controlled is simply too small to have an effect on the population. A longer-term study with clipping applied repeatedly over multiple years would be valuable to determining the impact of multiple-year panicle clipping. In addition, biological studies could be conducted to examine the response of the wild oat plants to clipping and determine whether regrowth, additional tillering, and seed set are occurring. Another point of consideration would be to evaluate wild oat seed retention after clipping. It is possible that clipping per se causes a delay in wild oat maturity. If more seeds are being retained than has previously been measured (Burton et al. Reference Burton, Beckie, Willenborg, Shirtliffe, Schoenau and Johnson2016, Reference Burton, Beckie, Willenborg, Shirtliffe, Schoenau and Johnson2017; Tidemann et al. Reference Tidemann, Hall, Harker, Beckie, Johnson and Stevenson2017), including clipping within a cropping system may make wild oat a better target for harvest weed seed control (Walsh et al. Reference Walsh, Broster, Schwartz-Lazaro, Norsworthy, Davis, Tidemann, Beckie, Lyon, Soni, Neve and Bagavathiannan2018). This could then increase the potential for HWSC to be used to manage weed seed bank inputs of wild oat, particularly in short crops or shorter crop cultivars.
Crop topping was clearly the superior treatment in the panicle targeting method study. However, the actual product used (pinoxaden) is not labeled for this late application stage. While there was no obvious wheat injury, yield loss, or quality loss, this would technically be an off-label application. Furthermore, there are no published studies on potential herbicide or herbicide metabolite residues when applying pinoxaden this late in the season. In addition, there is significant known resistance to pinoxaden and to other Group 1 herbicides on the Canadian prairies (Beckie et al. Reference Beckie, Shirriff, Leeson, Hall, Harker, Dokken-Bouchard and Brenzil2020). This treatment may never be recommended because many populations of wild oat have already evolved resistance to the product in the Canadian Prairies, and thus the treatment will already be ineffective on many populations, in addition to increasing selection pressure for resistance to one of our few selective in-crop products.
The crop topping treatment, however, does highlight the need to develop other products or other chemicals because selective, systemic products can clearly have a large impact on seed production and the overall wild oat population. This may require reviewing methods of applying nonselective herbicides, such as wick wipers/rope-wicks as discussed by Bagavathiannan and Norsworthy (Reference Bagavathiannan and Norsworthy2012), establishing new application timings for novel herbicides or modes of action as they are discovered by chemical companies, or investigating natural products that may affect seed set. Investigations of methods that can penetrate throughout the plant, such as electricity, where electrical weeders are already available on the market that could have some potential effect, may also be warranted in addition to the chemical-based investigations described above. Although the exact treatment used in this study should not be suggested for producer practice, it clearly highlights the opportunity available to target the panicle, prevent seed set, and have a significant effect on the following year’s populations. It could be particularly effective if combined with an industry standard in-crop application, with a panicle timing strategy used to manage those plants with resistance or those that escaped control (late emergence, shielded by residue or other plants, etc.). Overall, this research highlights the need for additional studies on wild oat and its response to clipping, but also further investigation into technologies that could be used at panicle emergence timing to manage wild oat seed production. While preventing seed set is not a new concept for wild oat management it is not one that has received much attention or focus in IWM studies, particularly at this late timing of panicle emergence. This research indicates that additional focus and study on targeting the wild oat panicle is warranted.
Acknowledgments
We gratefully acknowledge funding from the Alberta Crop Industry Development Fund via grant 2015C005R. We thank Aaron Gerein, Gerry Stuber, Shaun Campbell, and Taryn Zdunich in Saskatoon; Larry Michielsen and Patty Reid in Lacombe; and summer student and co-op student assistance at all site-years for their technical support. We thank Dr. F.C. Stevenson for his assistance with the statistical analysis of the panicle removal timing study, and the anonymous reviewers for their helpful comments and critiques resulting in an improved manuscript. No conflicts of interest have been declared.


