


Child nutritional status has been the subject of numerous studies at population level in the world since 1950. Most studies are static, focusing on distributions of weight and height in populations, age patterns (child growth), sex differences, socio-economic differentials and country differences, not counting the numerous studies on biological determinants and on the aetiology of undernutrition or obesity(Reference Bogin1–Reference Falkner and Tanner3). In contrast, few studies focus on the dynamics of nutritional status, that is the temporal changes in weight, height and BMI among pre-school children. Indeed, most dynamic studies are devoted to trends among older children (school-aged children, adolescents) and among adults, with main focus on adult height and more recently on overweight and obesity(Reference Malina4–Reference Yatsuya, Li and Hilawe6).
Child nutritional status is generally analysed with anthropometric measures based on height and weight. In developing countries, where the main challenge is undernutrition, anthropometric indices focus on weight-for-age, height-for-age and weight-for-height. In particular, low height-for-age defines stunting (retarded linear growth) and low weight-for-height defines wasting, two powerful analytical categories introduced in the literature by Waterlow in the 1970s(Reference Waterlow7,Reference Waterlow8) . Linear growth and weight are regulated by complex dynamic hormonal mechanisms (e.g. growth hormone, insulin-like growth factor-1, insulin-like growth factor-binding protein-3), which react to foods (e.g. milk, proteins), micronutrients (e.g. zinc, iodine), infection and inflammation, which may involve some epigenetic effects, and may differ by genetic endowment(Reference Veldhuis, Roemmich and Richmond9–Reference Millward13). Numerous studies in developing countries showed that stunting and wasting are both sensitive to infections, in addition to foods and micronutrients(Reference Briend, Khara and Dolan10–Reference Vonaesh, Morien and Andrianonimiadana16). Moreover, differences in height and body shape across populations seem to have a genetic component, although less important for pre-school children than for adults(Reference Habicht, Martorell and Yarbrough17–Reference Post and Victora20).
With the health transition, economic development and improving diet, the heights of children under 5 years of age (under-5s) tend to increase over time. Virtually all studies available in developed as well as developing countries show an increase in height-for-age and weight-for-age of under-5s in the past half a century(Reference De Onis, Frongillo and Blossner21–Reference Stevens, Finucane and Paciorek25). In some countries, particularly in Asia, increases in height were outstanding. For instance, in Korea, the height of children at age 5 years increased by some 10 cm between 1965 and 2005, starting from very low values and reaching international standards within 40 years(Reference Choi, Kim and Preedy26). These positive changes are associated with the control of infectious diseases and with improving diet in infancy and childhood (larger quantity, more diversity, fewer deficiencies). In addition, better nutritional status of parents could have an impact on that of their children, revealing a cohort effect due to heredity, because the height of children is influenced by that of their parents(Reference Galton27–Reference Cole30). Since the height of adults has been increasing in most places in the world over the past century, one could expect the height of children to increase simply because of this epigenetic effect.
Trends in body shape of young children, as measured by BMI or by weight-for-height Z-score (WHZ), have been even less studied. Available data indicate either a stable BMI or a somewhat increasing BMI over time. This was found in several places in the world. For instance, in the USA, the average BMI of children aged 1–4 years increased steadily from 16·1 kg/m2 in 1971–1974 to 16·8 kg/m2 in 2016. In Korea, the average BMI of 1–4-year-old children increased from 15·9 to 16·4 kg/m2 from 1965 to 2005(Reference Choi, Kim and Preedy26). In Maharashtra, India, the average BMI of 1–4-year-olds increased from 14·9 to 15·4 kg/m2 between 1985 and 2001(Reference Rao, Kanade and Joshi31). In published data from the Demographic and Health Surveys (DHS) conducted in seventy-four countries, WHZ tended to increase by +0·08 on average from one survey to the next (mean interval = 6·3 years), and in most countries it was either stable or increasing, including in countries starting with very poor nutritional status (such as India, Bangladesh, Nepal, Guatemala, Ethiopia, Rwanda, Burundi, Malawi and Tanzania). In Yemen, a country under severe stress, WHZ declined between 1991 and 1997, but weight-for-age Z-score (WAZ) and height-for-age Z-score (HAZ) also declined over the same period. Senegal appears as an exception to this pattern, with increasing HAZ but decreasing WHZ(32).
The aim of the present study was to investigate trends in child anthropometry (weight, height, BMI) in Senegal over the past 25 years, with main focus on divergent stunting and wasting dynamics. Since results were unexpected, an international perspective is provided by a comparison with the USA. Health and socio-economic correlates of this pattern are also explored.
Data and methods
Data were drawn from the DHS. Nine DHS surveys with anthropometric measures among under-5s are available in Senegal (Table 1). This set provides a large sample of 37 670 children aged 12–59 months, which offers ample opportunities for detailed analysis of trends in weight, height and related indicators. In the present study, raw measures of weight (kg), height (cm) and BMI (kg/m2) were used, as well as Z-scores calculated using the CDC-2000 standard of the Centers for Disease Control and Prevention(33–Reference Kuczmarski, Ogden and Grummer-Strawn35). This standard was shown to be more stable and more sensitive to screen for children at high risk of mortality because of their poor nutritional status(Reference Garenne, Maire and Fontaine36). Prevalence of low nutritional status was defined by the threshold of Z-score < −2·0: stunting by HAZ ≤ −2·0 and wasting by WHZ ≤ −2·0. The present study focuses on the age group 12–59 months where undernutrition is most prevalent.
Table 1 List of Demographic and Health Surveys, with sample size and mean child anthropometry, for children aged 12–59 months, Senegal
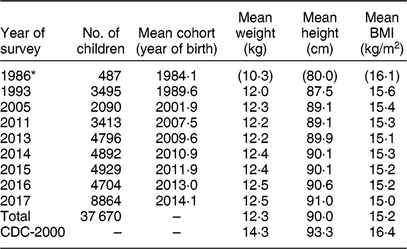
CDC, Centers for Disease Control and Prevention.
* The 1986 survey was restricted to children aged 12–36 months. Totals computed on the 1993–2017 surveys. CDC-2000 is the average for boys and girls aged 12–59 months.
Trends in child anthropometry were compared with trends in selected demographic and social indicators (mortality, level of education, household wealth), all derived from DHS surveys. They were also compared with socio-economic indicators (income per capita) derived from international databases (World Bank Development Indicators).
Comparison with trends in the same anthropometric indicators in the USA was made with data from the available National Health and Nutrition Examination Surveys (NHANES; from 1971–1974 to 2015–2016). These surveys provide the same indicators (weight, height, BMI) for a large sample of 12 521 children aged 12–59 months.
Trends in nutritional status (dependent variables based on weight and height) were investigated by performing linear regression v. several independent variables: cohort (year of birth), age (in months), gender and socio-economic status. In Senegal, socio-economic status was defined by three variables: urban residence, mother’s level of education (number of years of schooling) and household wealth (defined by the number of modern items out of a list of ten items). More details on statistical methods are available elsewhere(Reference Garenne and Gakusi37–Reference Hohmann and Garenne41). For the comparison with the USA, socio-economic status was defined by similar variables: level of education of the head of household (in five groups of years of schooling), annual family income (in ten groups) and race/ethnicity (in four groups), as defined in the NHANES. Calculations were done with the statistical software package SPSS Statistics version 17.
Results
Samples
The nine surveys available in Senegal were conducted between 1986 and 2017. Note that the 1986 survey included only children under 36 months of age. So, the sample covers cohorts born between 1984 (children age 2 years at the 1986 survey) to 2015 (children age 1 year at the 2017 survey) and coverage is adequate only for the cohorts born between 1990 and 2015, the main focus of the current analysis. On average, for the eight last surveys, the mean anthropometry of Senegalese children was lower than that of the reference data set (CDC-2000): −2·0 kg lower weight, −3·3 cm lower height and −1·2 kg/m2 lower BMI (Table 1).
Trends in anthropometric indicators
Results of the regression analysis of anthropometric indicators v. cohort, after controlling for age, sex and socio-economic status, are displayed in Table 2. Note that all coefficients for cohorts were highly statistically significant, with P < 0·0001 for weight, height, BMI and related Z-scores. Over the 25 years of the study, the average height of children aged 12–59 months tended to increase by +1·88 cm, weight by +0·10 kg, and BMI declined by −0·53 kg/m2. By age 60 months, children were +3·31 cm taller and hardly heavier (+0·240 kg), therefore leaner (BMI −0·73 kg/m2).
Table 2 Net effect of cohort on anthropometric indicators for children aged 12–59 months, Senegal, 1990–2015 (data from Demographic and Health Surveys)

HAZ, height-for-age Z-score; WAZ, weight-for-age Z-score; WHZ, weight-for-height Z-score.
Model: Indicator = Cohort + Age + Sex; Cohort = year of birth; for sd, the regression was performed only v. year of survey.
* P < 0·05.
In terms of Z-scores, Senegalese children gained on average +0·454 in HAZ and +0·109 in WAZ, but lost −0·302 in WHZ. These changes were associated not only with a shift from the distributions, but also with a reduction of the sd, significant only for WHZ. The prevalence of indicators of malnutrition associated with retarded growth declined: stunting (HAZ ≤ −2·0) declined by –46·2 %, underweight (WAZ ≤ −2·0) declined by –8·3 %, combined wasting and stunting (HAZ and WHZ ≤ −2·0) declined by –38·7 %; however, wasting (WHZ ≤ −2·0) increased by +25·8 %. Another consequence of the shift in the distribution of WHZ towards lower values was a decline in the proportion of children with WHZ ≥ +2·0 (defining overweight) from 1·66 % in 1993 to 0·30 % in 2017 (P trend < 0·0001); and a decline in the proportion with WHZ ≥ +3·0 (defining obesity) from 0·57 % in 1993 to 0·05 % in 2017 (P trend < 0·0001). In brief, Senegalese children grew taller (faster), but thinner over the 25 years. These trends are displayed in Fig. 1.

Fig. 1 Trends in Z-scores of anthropometric indicators (![]() , height-for-age (HAZ);
, height-for-age (HAZ); ![]() , weight-for-age (WAZ);
, weight-for-age (WAZ); ![]() , weight-for-height (WHZ)) among children aged 12–59 months, Senegal, using data from nine Demographic and Health Surveys. Trends were computed by cohort from regression models; they were matched with period (survey) data at the corresponding mid-point.
, weight-for-height (WHZ)) among children aged 12–59 months, Senegal, using data from nine Demographic and Health Surveys. Trends were computed by cohort from regression models; they were matched with period (survey) data at the corresponding mid-point.
Interaction with sociodemographic and economic correlates
The cohort analysis of height-for-age (HAZ) and weight-for-height (WHZ) was repeated for a variety of sociodemographic and economic correlates (Table 3). Overall results were consistent for the categories investigated. The anthropometry of boys and girls had the same trends, the difference being not significant. The net effect of cohort on both HAZ and WHZ was more marked for the older children (aged 36–59 months) than for the younger children (aged 12–35 months). The HAZ of rural children increased more (+0·555 cm) than that of urban children (+0·311 cm), the difference being significant (P < 0·0001). Furthermore, their WHZ decreased less (−0·256) than that of urban children (−0·375), which means that rural children benefited more from the improvements than urban children. Likewise, the HAZ of children living in poorer households (+0·418) and with lower level of education of their mother (+0·479) increased more than that of wealthier households and more educated mothers, the differences being statistically significant (P < 0·0001 in both cases). In contrast, the HAZ of children in the highest categories of household wealth and mother’s education hardly changed. Similarly, the losses in WHZ were smaller for children living in poorer households or with less educated mothers. All these changes are associated with the faster mortality decline in rural areas and among the poorer households over the past 25 years(Reference Garenne and Gakusi37, Reference Garenne, Ramiro-Fariñas and Oris42).
Table 3 Cohort trends in height-for-age Z-score (HAZ) and weight-for-height Z-score (WHZ), by demographic and socio-economic characteristics, for children aged 12–59 months, Senegal, 1990–2015 (data from Demographic and Health Surveys)

Model in each category: Z-score = Cohort + Age + Sex + Urban (variable was omitted when used in the category).
* P < 0·05.
Considering the changes in the past 25 years, the elasticity of anthropometric indicators to cohort was reduced when urban residence, household wealth and level of education were added in the regression analysis. The full model including demographic and socio-economic variables showed that only 35 % of the changes in height-for-age could be explained by changes in socio-economic characteristics, whereas changes in weight-for-height appeared independent(Reference Garenne43).
Comparison with other data
Since the changes in child anthropometry observed in Senegal were surprising (taller and leaner children), they were compared with American data. The NHANES surveys conducted in the USA provide a comparable data set for developed countries. In the USA, over 25 years, children aged 12–59 months continued to grow taller (+0·529 cm) and heavier (+0·475 kg) and with increasing BMI (+0·280 kg/m2), all changes being highly significant (P < 0·0001; Table 4). Results were similar when restricted to Black/African children: height increased by +0·702 cm, weight by +0·568 kg and BMI by +0·320 kg/m2. The other race/ethnicity groups (White/European, Hispanic, Asian) had the same changes of increasing weight, height and BMI. Only the Asian group who grew more in height (+0·868 cm) and less in weight (+0·317 kg) had a non-significant change in BMI, but still positive (+0·028 kg/m2). Nothing compared with changes seen in Senegal.
Table 4 Net cohort effects on weight, height and BMI among children aged 12–59 months, USA, 1971–1974 to 2015–2016 (data from National Health and Nutrition Examination Surveys)

Model: Indicator = Cohort + Age + Sex + Income + Education + Race/ethnicity; Cohort = year of birth. For BMI an Age2 term was added.
* P < 0·05.
Another comparison was conducted with other Sahelian countries, using DHS surveys (Mali, Burkina-Faso, Niger and Chad)(Reference Garenne43). In the four other Sahelian countries children also grew taller and heavier over the same cohorts. BMI tended to increase in Mali and in Niger, stayed about the same in Burkina-Faso, and decreased only in Chad, but much less than in Senegal (−0·17 kg/m2 instead of −0·53 kg/m2). Senegal appears therefore as the country where the changes were the most atypical and outstanding.
Lastly, a comparison with historical data in rural areas from Senegal and nearby Gambia showed that the trend towards thinner children is ancient and probably goes back to the 1960s, when the BMI at age 60 months was close to international standards: 15·2 kg/m2 in Khombole (1959–1966), 15·3 kg/m2 in Keneba (1962–1964), 14·9 kg/m2 in Niakhar (1983–1984), as compared with 14·4 kg/m2 at the 1993 DHS and 14·0 kg/m2 at the 2017 DHS, much less than 15·5 kg/m2 in the CDC-2000 standard(Reference Garenne43–Reference McGregor, Rahman and Thompson46).
Discussion
Changes in child anthropometry in Senegal over the past 25 years appeared atypical: children grew taller but became thinner over time. The trend towards increasing height and declining BMI in Senegal has a long history and seems to go back to the 1960s(Reference Garenne43). A literature review did not reveal any other documented case of similar changes among children aged 1–4 years. In Korea, between 1965 and 1984, the average height of children aged 3–5 years increased by +6·6 cm, their weight by +1·7 kg, while their BMI decreased by −0·3 kg/m2. However, when the whole age group of 1–4 years was considered, the average BMI stayed constant(Reference Choi, Kim and Preedy26). In India, according to published data from DHS surveys conducted in 1998, 2005 and 2015, some twenty-one out of twenty-six states exhibited situations of decreasing WHZ while increasing HAZ, and in seven states prevalence of wasting was increasing while that of stunting was decreasing; however, no statistical testing was done and these cases require further investigation(Reference Das47).
Reasons for these diverging trends could be discussed in a broad public health context of changing health status, income and diet. In fact, the situation of Senegal is quasi-experimental, with evidence of major improvements in health despite virtually no change in income and diet. From a theoretical perspective, the hormonal regulation of height and weight remains poorly understood and we know little on adaptation to changes in its many factors (diet, diseases, physical activity, intra-uterine environment, genetic endowment). What is well documented on empirical grounds is that child anthropometry reacts positively to improving health, to infectious diseases control and to improving diet. In Senegal, child mortality decline has been dramatic since independence, especially in rural areas. According to DHS surveys, over the study period (1990–2015), under-5 mortality declined from 99 to 42 per 1000 in urban areas, and from 165 to 64 per 1000 in rural areas. This mortality decline occurred mainly because of better prevention and treatment of infectious diseases (vaccinations, antibiotics, antimalarial drugs, anti-diarrhoeal treatments, bed nets, etc.), and possibly treatment of severe malnutrition (marasmus, kwashiorkor). Similarly, again according to DHS surveys, child morbidity, measured by the prevalence of fever and diarrhoea, declined from 1992 to 2017, and malaria prevalence was strongly reduced between 2010 and 2017. In contrast, income per capita hardly changed for a long time in Senegal, despite ups and downs. According to World Bank Development Indicators, per capita gross domestic product at purchasing power parity was $US 2922 in 2015, compared with $US 2314 in 1990 and $US 2703 in 1960. Over the study period (1990–2015), income per capita growth rate was below 1 %, so unlikely to explain changes in child anthropometry. Little is known about trends in child feeding practices and quality of the diet. What is better documented is the anthropometry of women aged 20–39 years: their average BMI did not change significantly between 1993 (21·9 kg/m2) and 2011 (22·1 kg/m2), indicating no obvious change in the diet. If the BMI of the poorer strata of the population remained constant (about 21·5 kg/m2), it tended even to decrease somewhat (from 24 to 23 kg/m2) for the highest strata, representing only a small fraction of the population (20 %). In comparison, in the USA the BMI of 20–39-year-old women increased from 24·1 to 29·2 kg/m2 between 1976–1980 and 2015–2016, while income per capita increased by 83 %. To explain changes in child anthropometry in Senegal, a possible hypothesis is therefore that children’s heights increased mainly because of a better control of infectious diseases, while BMI did not follow because increases in income and food intake were not enough to compensate for the rising heights.
In theory, trends in parents’ height could also have played a role, but available data do not support this hypothesis. First, the increase in adult height was small and irregular in Senegal. According to DHS surveys, the mean height of women increased from 161·0 cm for women born in 1940 to 163·0 cm for women born in 1965, after which date female height remained stable. Likewise, the mean height of men increased from 173·0 cm for men born in 1950 to 175·0 cm for men born in 1970, after which male height remained stable. Multiplying these cohort trends by the age distribution of mothers and fathers (also obtained from DHS surveys) showed only a minor increase of 1·03 cm in the mid-parent stature. Second, the elasticity of children’s height to their parents’ height is small: 0·199 for mothers and 0·077 for fathers (calculated from DHS surveys). Therefore, one could expect only a tiny increase (+0·19 cm) in children’s height given the rise in adult heights, about 10 % of that observed (+1·88 cm).
The health significance of smaller BMI combined with larger heights is puzzling. There does not seem any documented pathology associated with this pattern. In the Niakhar study, child mortality was independently related with stunting and wasting, with similar elasticities(Reference Garenne, Maire and Fontaine36, Reference Garenne, Maire and Fontaine44, Reference Garenne, Maire and Fontaine48, Reference Garenne, Myatt and Khara49). So, the net effect of a +0·454 increase in HAZ and a −0·302 decline in WHZ would be almost neutral, and translates into a −5·1 % mortality reduction among children aged 12–59 months, almost equivalent to the effect on mortality (−6·2 %) of a +0·109 increase in WAZ, producing overall beneficial changes on child survival.
The differential analysis showed that boys and girls had the same trends in height and weight. What was striking was that the poorer strata of the population, who were those with the lowest anthropometric indicators at baseline, were those who benefited the most from the increase in height: rural population, children of less educated mothers and children from poorer families. This observation is again consistent with the faster mortality decline among the poorest strata over the same period. In contrast, the height of children in the wealthiest strata hardly changed. This pattern suggests that children with retarded growth were catching up, while those more advanced did not show much increase, probably because they were close to their maximum genetic potential.
Surprisingly, the decline in weight-for-height was more pronounced among the highest socio-economic strata (urban population, more educated mothers, wealthier families). This latter pattern deserves more investigation. It could be a consequence of some complex hormonal or immunological phenomenon.
Height and body shape have a variety of genetic and environmental components. Some of the changes could have originated from intra-uterine growth, but there are no reliable data on this issue in Senegal. According to DHS data, there was no evidence of any change in breast-feeding between 1986 and 2013: median duration stayed constant at 20·5 months over the years; there was no obvious documented change in the diet of under-5 children either. Furthermore, the changing body shape may also have an epigenetic component and may be an adaptation to better health specific to this population. Let us remind that Sahelian populations are among the tallest and thinnest in the world. What the precise mechanisms are remain to be studied.
Other studies have documented the lack of impact of diet on stunting in certain circumstances. For instance, in 19th century Germany, growth in height was largely independent of the extent and nature of the diet(Reference Hermanussen, Bogin and Scheffler50). In a comparative study of four developing countries, the net effect of diet, measured by its monetary value, on linear growth (HAZ) was found to be negligible(Reference Mumm and Scheffler51).
Conclusion
In conclusion, trends in child anthropometry in Senegal were surprising. They could be explained by the specific context of the country: rapid improvements in the health status of children due to the control of infectious diseases, while virtually no improvement in income and diet. This situation reveals some of the fundamental determinants of stunting and wasting. Data quality was not an issue, since patterns were clear and statistical significance was high. These data tell us an interesting story, which remains difficult to interpret. In particular, in a context of increasing height, whether an increasing proportion of children with low weight-for-height should be interpreted as an increase in pathological wasting remains an open question.
Acknowledgements
Acknowledgements: The author wishes to thank Dr André Briend for providing many suggestions and for a careful reading of the draft manuscript. Financial support: This research received no specific grant from any finding agency in the public, commercial or not-for-profit sectors. Conflict of interest: None declared. Authorship: M.G. is responsible for data analysis and writing the paper. Ethics of human subject participation: Not applicable. This study is a secondary analysis of data made publicly available by the DHS program.


