Introduction
The Antarctic ice sheet constitutes a unique archive of past climate, now extending to the last four climatic cycles (Reference PetitPetit and others, 1998). It is also an important component of the climate system, fluctuations of the ice-sheet mass balance through the hydrological cycle having straightforward consequences for sea level on short and long time-scales (Reference Warrick, le Provost, Meier, Oerlemans, Woodworth, Houghton, Filho, Callander, Harris, Kattenberg and MaskellWarrick and others, 1996).
The reconstruction of past Antarctic climate is largely based on an empirical link between the isotopic content of precipitation (oxygen-18 (δ 180) and deuterium (δD)) and local temperature. This spatial relationship has been substituted for a temporal one to interpret the isotopic ice records in terms of past temperatures. This use is challenged by alternative estimates of glacial to interglacial temperature changes inferred from borehole thermometry (Reference Salamatin, Lipenkov, Barkov, Jouzel, Petit and RaynaudSalamatin and others, 1998). Other factors could contribute to the difference between spatial and temporal isotope-temperature relationships. Reference Krinner, Genthon and JouzelKrinner and others (1997) used a high-resolution general circulation model to show that the precipitation seasonality and the vertical atmospheric structure probably have a limited impact on this difference. Also moisture origin and transport history confer a specific fingerprint on the isotopic precipitation content, and are likely to control the isotope-temperature relation to some extent (Reference DansgaardDansgaard, 1964). Moreover, were this fingerprint different from basin to basin, the isotopic record might vary from place to place in Antarctica, independently of the local temperature but according to the dominant basin. Better knowledge of the spatial and temporal distribution of the moisture origin should thus help in analyzing the isotopic profiles at the various Antarctic sites where deep drilling has been achieved (Byrd Station, Dome Concordia, Dome B, Vostok and a few coastal sites) or is ongoing or planned (Dome Fuji, Siple Dome, Dome Concordia and Dronning Maud Land, these last two drillings being undertaken in the frame of the European Project for Ice Coring in Antarctica (EPICA)). Also important is the fact that the deuterium excess (d) of Antarctic snow strongly depends on the conditions (temperature, humidity, wind speed) prevailing in the moisture-source regions.
Several studies have already focused on determining indirectly Antarctic precipitation origin, based on either hydrological or isotopic considerations (see Reference BromwichBromwich, 1988, for a review). Since then an estimation of storm tracks across the Southern Hemisphere (Reference Jones and SimmondsJones and Simmonds, 1993) has brought new longitudinal constraints on vapour origin. Using the link between deuterium-excess (d = δl-8– δ18O) and precipitation sources, Reference Petit, White, Young, Jouzel and KorotkevichPetit and others (1991) and Reference Ciais, White, Jouzel and PetitCiais and others (1995) used a Rayleigh-type isotopic model to match deuterium-excess measurements in surface snow from coastal to central Antarctica. They inferred a major subtropical source, but could not exclude an additional coastal contribution. Using the same model, Reference DelmotteDelmotte (1997) suggested seasonally varying sources for the coastal Antarctic site of Law Dome. Yet the main limitation of all these studies is that they basically fail to account for a realistic moisture history (precipitation and mixing) along the trajectory from ocean to ice sheet. Atmospheric general circulation models (AGCMs) provide a unique means to trace the moisture through a far more complete description of the vapour history. Reference Koster, Jouzel, Suozzo and RussellKoster and others (1992) have already simulated the Antarctic precipitation origins for modern July conditions. Here, we use the same model over a complete seasonal cycle and test different glacial conditions to assess the spatial, seasonal and climatic variability of Antarctic moisture sources.
Tracing Moisture with an AGCM
The AGGM used here was developed at the NASA/Goddard Institute of Space Studies (NASA/GISS). The present version, model II, has been used with its standard horizontal low resolution: 8° x 10° latitude by longitude (24 x 36 gridpoints), and nine vertical a levels. Each grid box has realistic elevation and geography, and is divided into fractions of open sea, sea ice, land and continental ice. The atmosphere dynamics is forced by its boundary conditions: insolation, atmospheric composition, sea-surface temperature (SST) and ice cover, and land-surface description. The model has annual and diurnal cycles. Although it has very coarse resolution, the model reasonably simulates the main atmospheric features. Description and discussion of its performance can be found in Reference HansenHansen and others (1983).
Tracer diagnostics have been implemented in the model (Reference Koster, Eagleson and BroeckerKoster and others, 1988) in order to "tag" the water evaporating from specific regions, and to follow it along its transport. The model then calculates for each grid box the contribution of each region to local precipitation. This diagnostic was applied to water isotopes by Reference Jouzel, Russell, Suozzo, Koster, White and BroeckerJouzel and others (1987). The realistic distribution of these tracers is a strong indication that the model is able to reproduce the main features of the hydrologic cycle. Due to the singularity of the polar gridpoint, atmospheric transports across it are not well described, which could bias our results. In fact the very low temperature of this area reduces the air-moisture content on average to one-half of the surrounding points.
As vapour supply from the Northern Hemisphere is found to be quite negligible in high southern latitudes (<1%), we defined 19 moisture sources located only in the Southern Hemisphere. Seventeen sets of homogeneous marine gridpoints were defined according to annual SST and basin geography considerations. The Antarctic ice sheet was marked separately in order to assess the importance of snow sublimation as a moisture source. These sets were gathered to form geographically or latitudinally "homogeneous" zones. From the Equator to 63° S, we distinguished either the three oceanic basins or latitudinal bands. At higher latitudes the glacial (i.e. seasonally sea-ice-covered) ocean was considered as a separate zone. These various zones are shown in Figure 1. They were kept unchanged for all simulations.
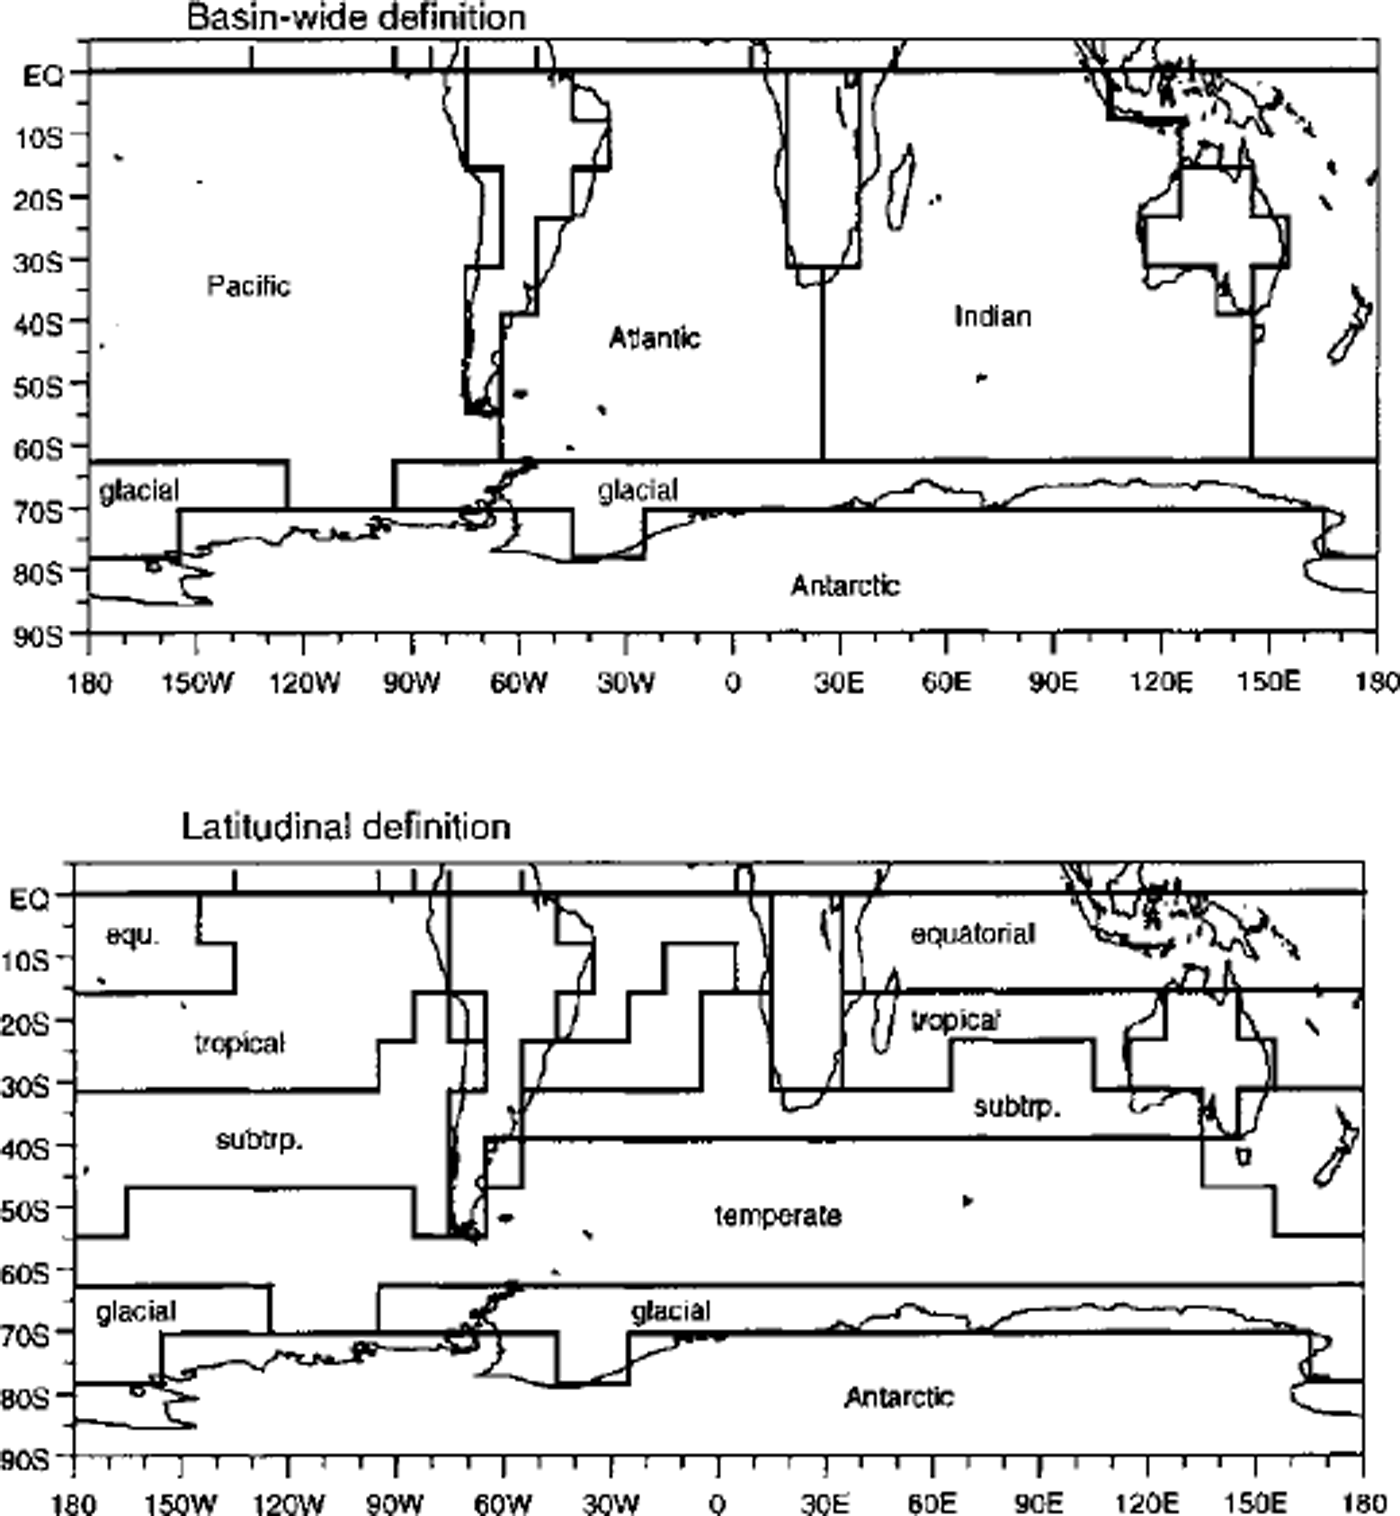
Fig. 1. Definition of the moisture sources for the simulations: between the Equator and 63° S, the partition is based either on basin geography or on annual sea-surface temperature. A "glacial" source is defined as the seasonally sea-ice-covered oceanic zone.
Sensitivity Study to Climatic Changes
Our 10 year present-day climate simulation is based on the Atmospheric Model Intercomparison Project (AMIP; Reference GatesGates, 1992) oceanic observations. To test the validity of the simulated atmospheric trajectory, and thus of the precipitation origin, we compare the simulated hydrological cycle with observations. Figure 2 shows the zonally averaged meridional transport of vapour in the Southern Hemisphere from our simulation, compared to estimates from operational analyses of the European Centre for Medium-range Weather Forecasts (ECMWF) model (Reference Bromwich, Robasky, Cullather and vanWoertBromwich and others, 1995). Rather good agreement is found, except for latitudes corresponding to the Antarctic coast (65-75° S) because a coarse description of the coast allows too much moisture to penetrate the continent. A more complete comparison can be found in Delaygue and others (in press). As a whole, the model simulates a correct transport of moisture, which makes it a reasonable tool for moisture-origin estimate.
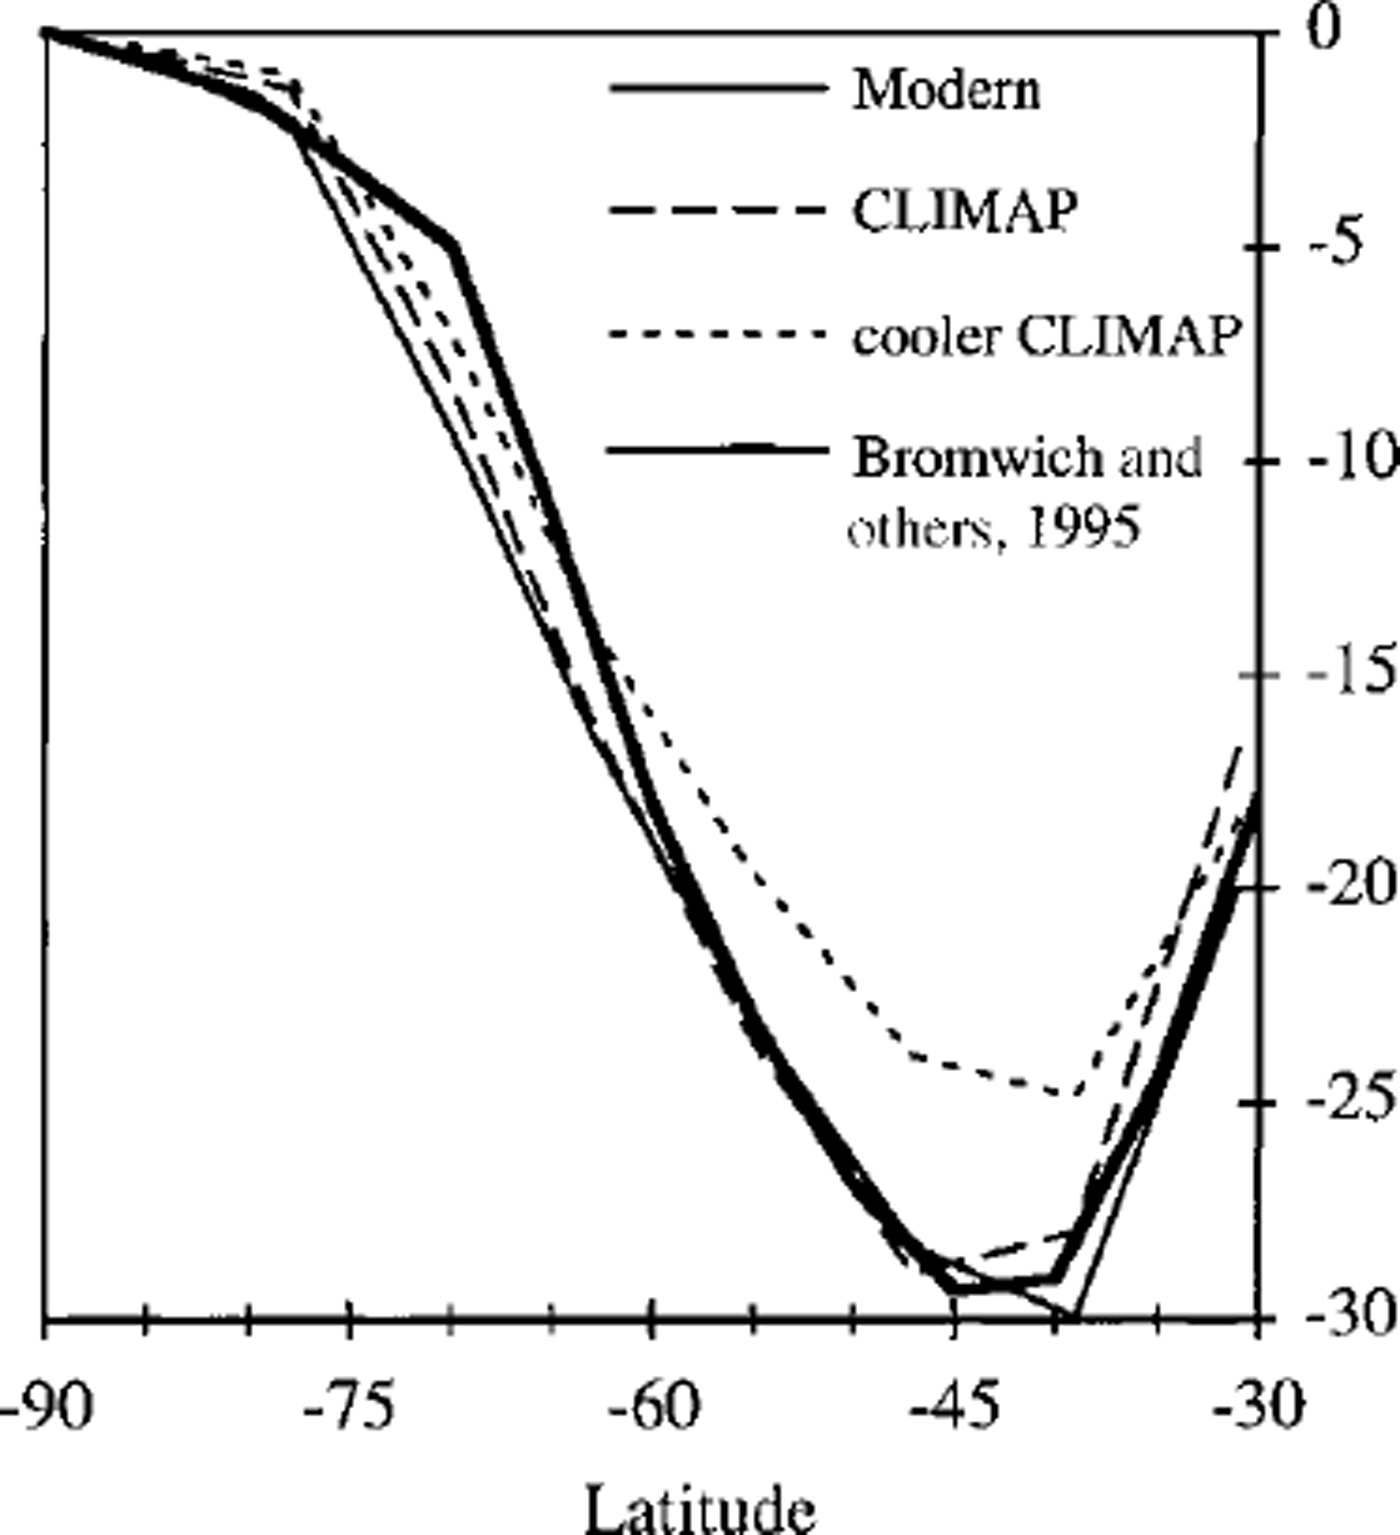
Fig 2. Annual northward transport of moisture by the atmosphere in the Southern Hemisphere: ECMWF-based estimations by Reference Bromwich, Robasky, Cullather and vanWoertBromwich and others (1995), simulations with the GISS 8° × 10° AGCM.
We have tested the sensitivity of the precipitation origins and some hydrological parameters to two types of climatic parameters: the meridional temperature gradient and the seasonality of the prescribed conditions. First, the meridional gradient of surface temperature was strongly increased by applying the CLIMAP (1981) reconstruction of the Last Glacial Maximum (LGM) (Fig. 3). Reference RindRind (1987) gave a complete description of the climatic changes induced by CLIMAP conditions. We also apply an intermediate gradient by cooling (by 2-3°C) the CLIMAP intertropical SSTs, considering that CLIMAP interpretations are less reliable there than others, for instance based on alkenones (personal communication from E. Bard, 1997). Secondly, the seasonality of the CLIMAP reconstruction (extrema arbitrarily in February and August) was shifted forward by 1 month, given that in the present climate the extrema of SSTas well as sea-ice cover are later, in spring and fall, i.e. given that the lag behind insolation is longer. Reconstructions of the CLIMAP sea-ice cover and topography were common to all glacial simulations. C02 concentration was lowered to 200 ppmv (Reference Raynaud, Jouzel, Barnola, Chappellaz, Delmas and LoriusRaynaud and others, 1993) and orbital parameters to their values 21 ka BP (Reference BergerBerger, 1978).
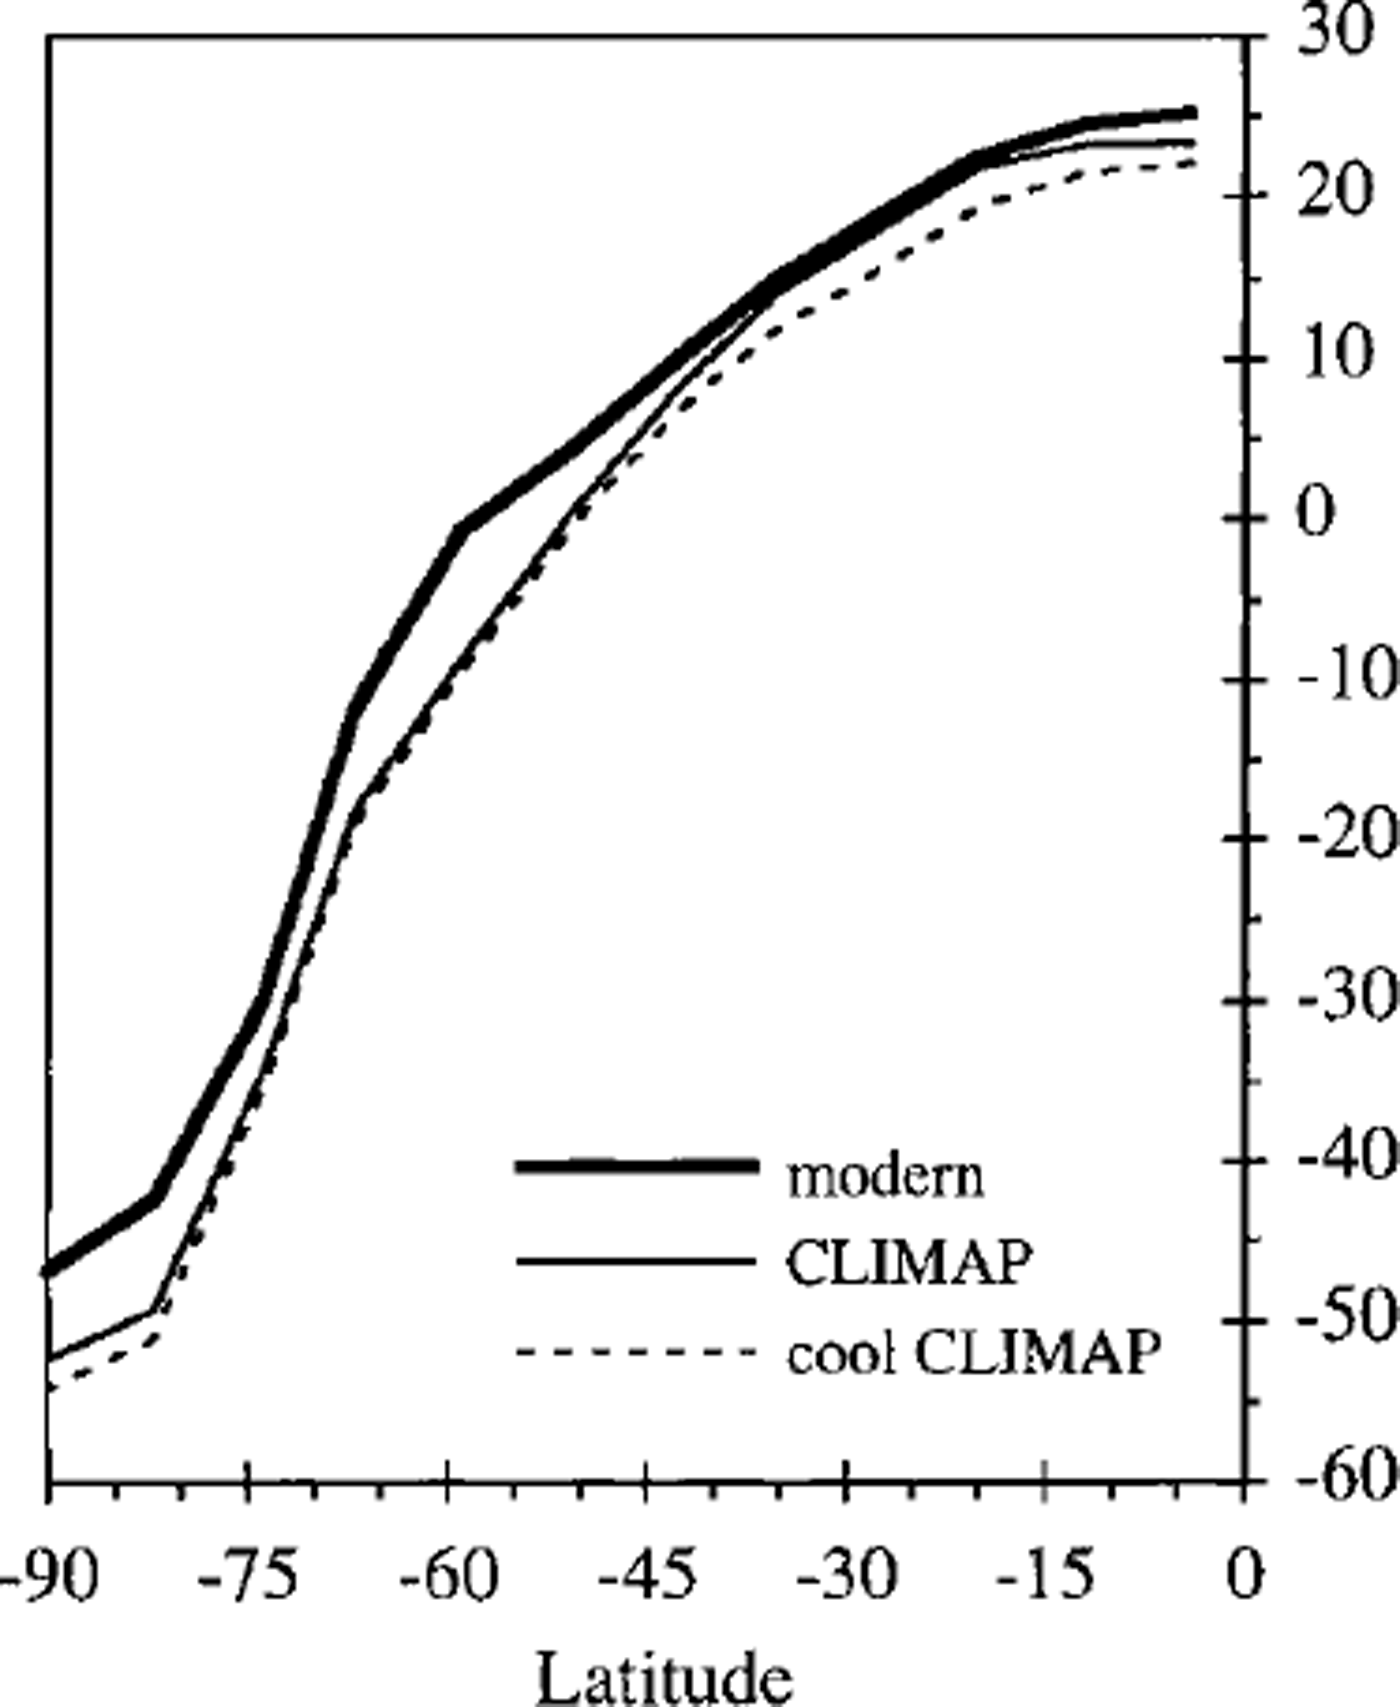
Fig. 3. Annualzonally averaged surface air temperature (°C) in the Southern Hemisphere from the different simulations.
The meridional moisture flux simulated with CLIMAP conditions is very similar to the present-day flux (Fig. 2), because there is a balance between the decrease of evaporation (general cooling) and the increase of the temperature latitudinal gradient and thus of the atmospheric transport. With cooler tropics the decrease of global evaporation is not equilibrated by a smaller increase of the meridional gradient, and the southward flow is largely reduced (by 25%). Shifting the CLIMAP conditions in time increases slightly the southward moisture transport (not shown).
Although the moisture transport is about the same over low to medium latitudes for modern and glacial conditions, the amount reaching Antarctica is quite different (Fig. 4). Under LGM conditions, the global precipitation decrease is due to the cooling, more intense with cooler tropics. Precipitation is mainly controlled by the moisture air content (through the temperature dependency), except over regions where stationary lows bring warm, moist oceanic air (Weddell and Ross Seas, and more generally West Antarctica). A semi-annual tendency of the accumulation is due to a summer precipitation compensation by the simulated high evaporation. Shifting CLIMAP conditions in time changes significantly the moisture supply to Antarctica (Fig. 4), with an increase (15%) of fall accumulation but no noticeable time lag. The only atmospheric anomalies in phase with this change are the evaporation rate and the ground-surface air-temperature gradient in the subtropics (20-40° S). These anomalies take place in the three main basins, slightly northern in the Atlantic. Further work is needed to understand how insolation and SST interact to change both evaporation and moisture transport to higher latitudes.
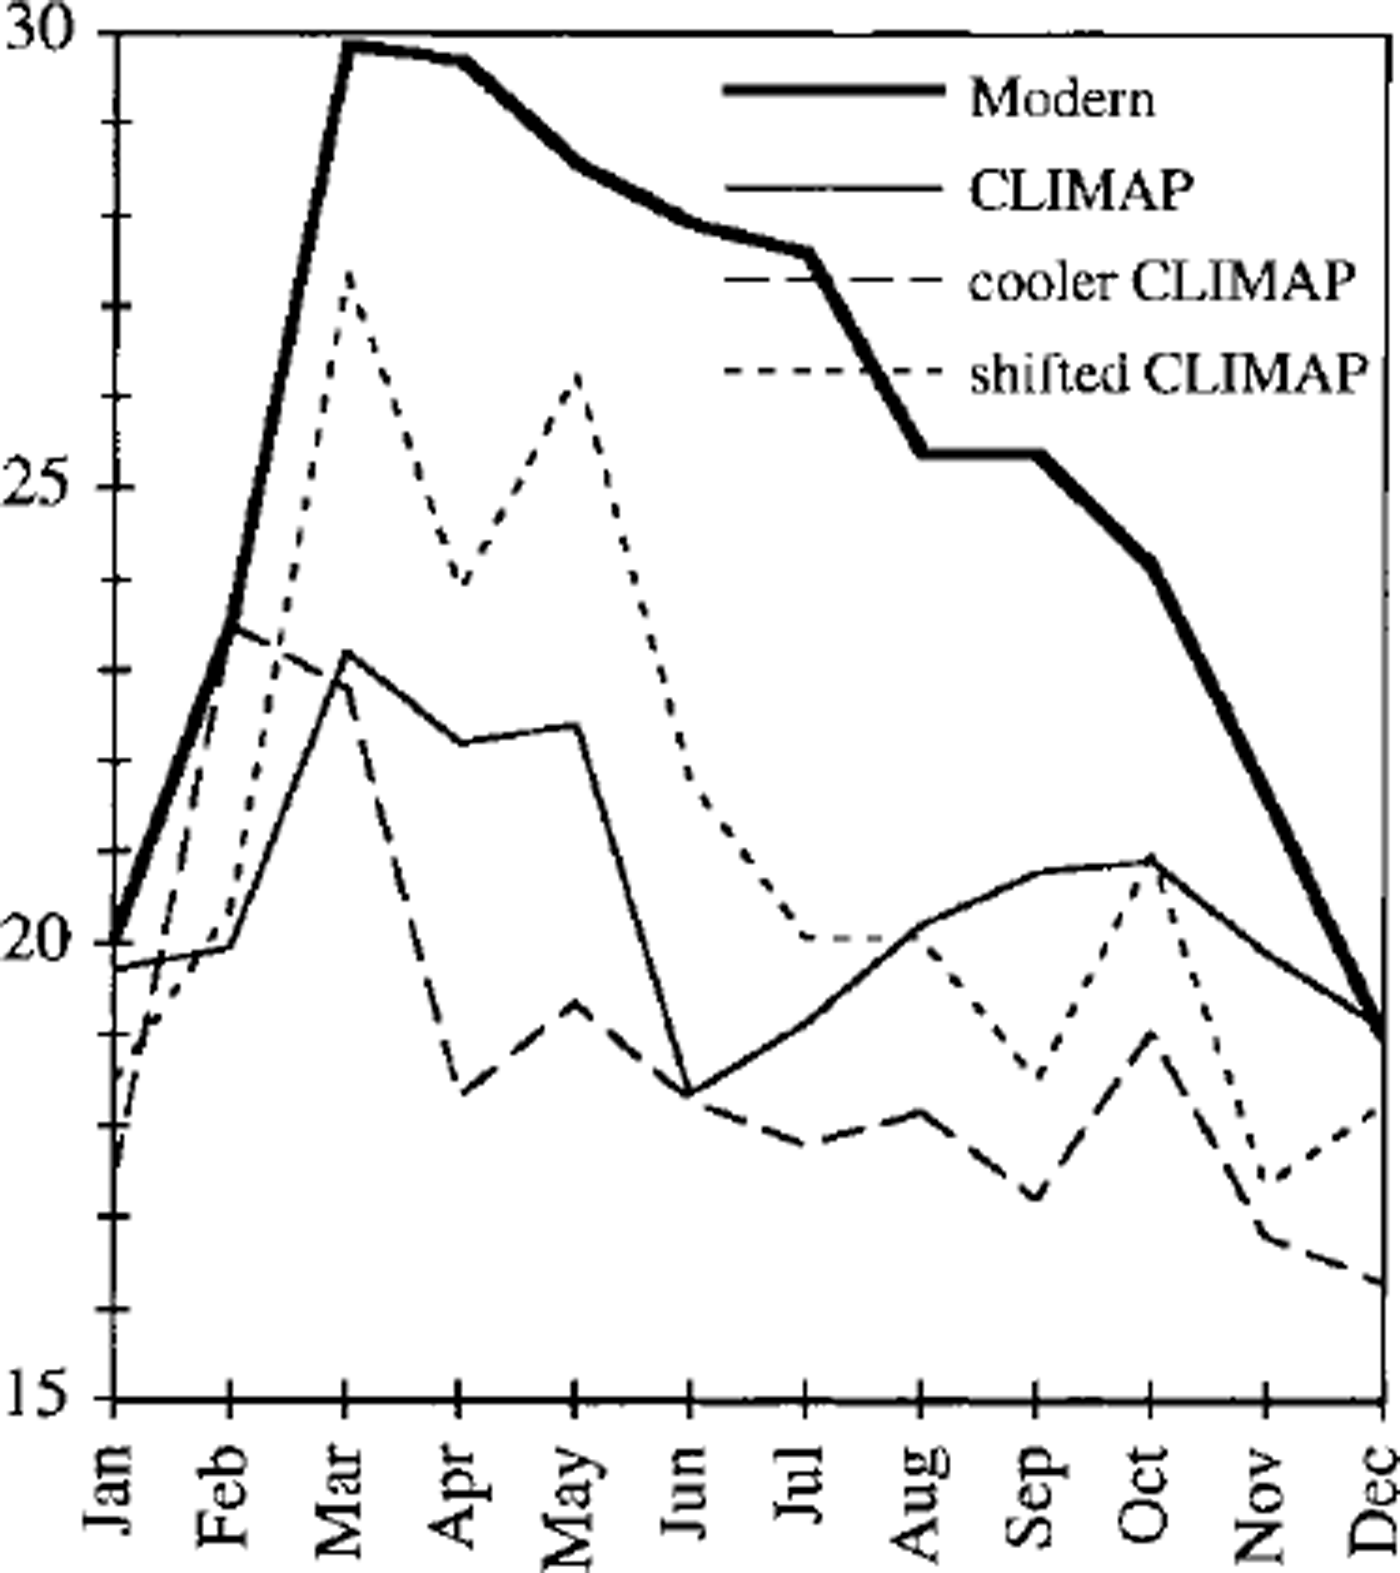
Fig. 4. Seasonal variation of the simulated Antarctic accumulation, in mm month−1 (average over 10 years for modern conditions, 5yearsfor LGM).
Table 1 shows the annual averages of the oceanic and latitudinal contributions to Antarctic precipitation. Moisture from the Antarctic snow sublimation and from the glacial ocean contributes significantly during the austral summer and fall. The other contributions present fewer variations over the year. Consistently with the Hadley circulation which keeps moisture inside the intertropical zone, the precipitation is dominated by subtropical and subglacial vapour, whatever climatic change is considered. The contributions of the cooler ice sheet and extended sea-ice cover decrease by a factor of two with LGM conditions. Conversely, the less cooled low latitudes participate more, particularly the subtropical region kept almost as warm as today in the CLIMAP reconstruction (Fig. 3). The higher meridional temperature gradient with all LGM conditions (Fig. 3) also increases this contribution through the meridional transport. The tropical cooling spreads over the other latitudes, but the main effect is to lower the contribution of tropical-to-subtropical zones. Shifting the CLIMAP conditions by 1 month has no great effect on the precipitation origins, except a seasonal shift of the subtropical/subglacial ratio which is higher in fall.
Table 1. Annual average (%) of the source contributions (cf. Fig 1) to Antarctic precipitation, under different climatic conditions. The difference from 100% comes from the continents
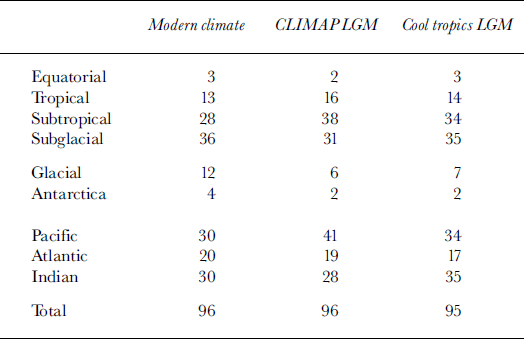
The oceanic contributions to Antarctic precipitation are distributed between the largest oceans, in relation to their latitudinal positions. The CLIMAP LGM interpretation promotes a warming of the Pacific tropical/subtropical SSTs, stability of the Indian SSTs and a slight cooling in the Atlantic. Qualitatively, these SST variations appear to explain the simulated variations of the oceanic contributions. Cooling this tropical CLIMAP reconstruction brings these relative contributions closer to those of the present day, given a higher cooling of high latitudes and of the Atlantic compared to the Indian and Pacific (3° less prescribed rather than 2° elsewhere). Shifting the CLIMAP conditions has almost no impact on the contributions.
Conclusion
Different mechanisms seem to control the simulated climatic and seasonal variations of the Antarctic hydrological cycle. At the evaporation site, the SST and sea-ice cover play a major role. The atmospheric transport is mainly controlled by the meridional SST temperature gradient. At the precipitation site the local temperature plays an important role, especially for East Antarctica. Even if the transport mode changes with glacial conditions (stronger eddy circulation, etc.), the moisture transfer is very close to the modern one and the differences can be explained basically by the source conditions, namely, SST-controlled evaporation.
Two important caveats must be emphasised. First, this AGGM has a low horizontal resolution and is not specially parameterised for high latitudes. Future simulations should use a high-resolution model (stretched-grid version) and take into account proper atmosphere-sea-ice-ocean interactions. Secondly, the realism of our simulations can be estimated only indirectly by comparing the results to observed hydrological variables. Our simulation of the present-day hydrological cycle is consistent with recent descriptions of the Southern Hemisphere and Antarctica based on numerical analyses (e.g. Reference Jones and SimmondsJones and Simmonds, 1993; Reference Bromwich, Robasky, Cullather and vanWoertBromwich and others, 1995).
Delaygue and others (in press) have shown that apart from the coastal areas, most of Antarctica receives a combination of different moisture sources. The eastern part of the Antarctic Plateau is dominated by the Indian Ocean origin, with a weak seasonal cycle due to coastal and local (ice-sheet) supplies. The western part receives moisture mainly from the Atlantic and Pacific Oceans, with a seasonally important contribution from the ice-covered ocean.
LGM climate is characterised by a strong cooling in temperate/high latitudes and thus a stronger latitudinal temperature gradient. As a result, less moisture evaporates there, and lower latitudes contribute more to Antarctic precipitation. Whereas the reconstruction differences have a major impact on the hydrological cycle, they have little impact on the moisture origin.
Acknowledgements
The authors are grateful to D. Rind and R. Koster for facilitating our use of the NASA/GISS AGGM; to R. Healy and R. Ruedy at GISS for technical assistance; to D. Bromwich and R. Cullather at Byrd Polar Research Center for providing their moisture-transport estimates; to G. Genthon at the Laboratoire de Glaciologie et Geophysique de l’Environnement, Grenoble, for sharing the data of Reference Dolgin and PetrovDolgin and Petrov (1977); and to two reviewers for their comments. Simulations were run at the Laboratoire des Sciences du Glimat et de l’Environnement on an IBM Rise 6000. This is LSGE contribution No. 293.


