Introduction
Chemical records contained within polar ice cores have the potential to provide detailed, long-term information about past climate conditions on Earth. To fully decode the ice-core record so that past atmospheric composition may be assessed, we must understand the nature of the air-snow transfer by which atmospheric chemistry signals become recorded in snow and changed in time as the snow is buried and compresses into firn and, eventually, ice. We must also be able to model the snow-air transfer processes before we can conduct the inverse modeling necessary for ice-core interpretation.
Surface processes, including diffusion, advection by air flow within the snow and radiation penetration, control heat and mass transfer and chemical transport within the snow. Diffusion occurs in all porous media, and represents a slow mixing process; in general, diffusion in snow is driven by temperature and by concentration gradients. Wind can cause air flow in the snow and advective channeling within the snow layers, promoting more rapid transport and greater exchange than diffusion (Reference AlbertAlbert, 1996). This ventilation of the snow affects chemical composition and exchange within the snow (Reference Waddington, Cunningham, Harder, Wolff and BalesWaddington and others, 1996; Reference McConnell, Bales, Stewart, Thompson, Albert and RamosMcConnell and others, 1998). Radiation affects energy exchange at the surface, and solar radiation penetration into the snow causes photolytic reactions.
The physical properties of snow and firn control the physical and chemical transport processes that occur within the snow crystals and within the interstitial air space. Snow is a layered porous medium. The layering is caused by different depositional events (see, e.g., Reference AlleyAlley, 1988) and can result in snow with very different properties even in adjacent layers. Permeability is that property of a porous medium that affects the amount of fluid movement that can occur in the medium; it is a measure of the interconnected pore space. Siple Dome is the site of an ice-core drilling program on the West Antarctic ice sheet; it is generally a dry-snow site with rare melt events. In snow pits and firn cores from Siple Dome, we have measured stratigraphy, density, permeability and microstructural characteristics as a function of layer, down to 15 m depth in the firn. We have found that the physical characteristics are strongly dependent upon layering and depth. In this paper we present the permeability measurements and discuss some preliminary examples of the effect of snow microstructure on permeability. These measurements define the physical transport parameters necessary for modeling snow-air exchange processes at Siple Dome.
Many laboratory and seasonal snow measurements of permeability have been reported (e.g. Reference ShimizuShimizu, 1970), with huge scatter in the data owing to the complexities of different grain types, sizes and snow density. In polar firn, Reference WaterhouseWaterhouse (1962) reported silicon fluid measurements of snow- and firn-permeability coefficients at a site 354 km east of Thule in Greenland. Measurements down to 30 m depth were taken from a manually excavated shaft. Although the data clearly show a wide variation that was attributed to layering, no details of the layering or microstructure were reported. The mean measured permeability coefficient varied from 1.5 m S–1 down to approximately 0.5 m S–1 at 30 m depth.
Measurement Technique
Permeability, k, is a proportionality factor relating the pressure gradient to the flow rate through a porous medium via Darcy’slaw:

where P is pressure, μ is fluid viscosity, vj is the flow velocity, and repeated indices for i and j imply summation.
The assumption of a linear relationship between pressure drop and flow rate in Darcy’s law restricts its applicability to laminar flow. In order to measure permeability we use a cylindrical cutter to cut a snow sample, then fit a double-cylinder head on the sampler (Reference ShimizuShimizu, 1970) to pump air through the sample while measuring the air-flow rate and pressure drop across the sample. The double-cylinder head allows for different flows through the outer and inner cylinders. The flows may be adjusted until the pressures match; this provides compensation for edge effects and produces parallel flow in the sample under the inner cylinder. Air is drawn through the sample for various flow rates, and each measurement is checked to ensure that the flow rates are sufficiently low that the data he along a straight line. Darcy’s law is then used to calculate the permeability from the measured air-flow rates and pressure drops. A schematic illustration of the sampling device is shown in Figure 1. Our permeameter has undergone rigorous testing on glass beads and layered porous media, and is an upgraded version of earlier models described by Reference Chacho and JohnsonChacho and Johnson (1987) and Reference Hardy and AlbertHardy and Albert (1993).

Fig. 1. Schematic of the permeameter.
Results
Permeability
Measurements of snow and firn stratigraphy, density, crystal characteristics, microstructural imaging and permeability were taken from surface-snow pits and from firn cores at Siple Dome. Figure 2 depicts the layering, density, permeability and grain-size range from pit measurements in the top 2 m of snow and firn. For simplicity in the figure, the snow type is depicted as either fine-grained (gray) or coarse-grained (white). It can be seen that the coarse-grained layers are usually less dense than adjacent fine-grained layers. The most coarse-grained layers are often associated with surface-hoar formation that was buried by falling snow before being subjected to wind packing (Reference AlleyAlley, 1988). The permeability varies by almost an order of magnitude in the top 2 m, depending upon layer type and depth. The grain-size measurements in this figure were made with a hand lens in the field, and the size range represents the largest crystal length for the range of crystal sizes observed at each depth. As can be seen from Figure 2, snow density is not a good indicator of permeability. This is further depicted in Figure 3, where the scatter plot of permeability with density in the top 2 m shows no clear pattern for correlation between permeability and density. Permeability is more closely related to grain-scale characteristics than to density, and further investigation of permeability and grain-scale characteristics, using quantitative microscopy on preserved thick sections, will be reported in the future.
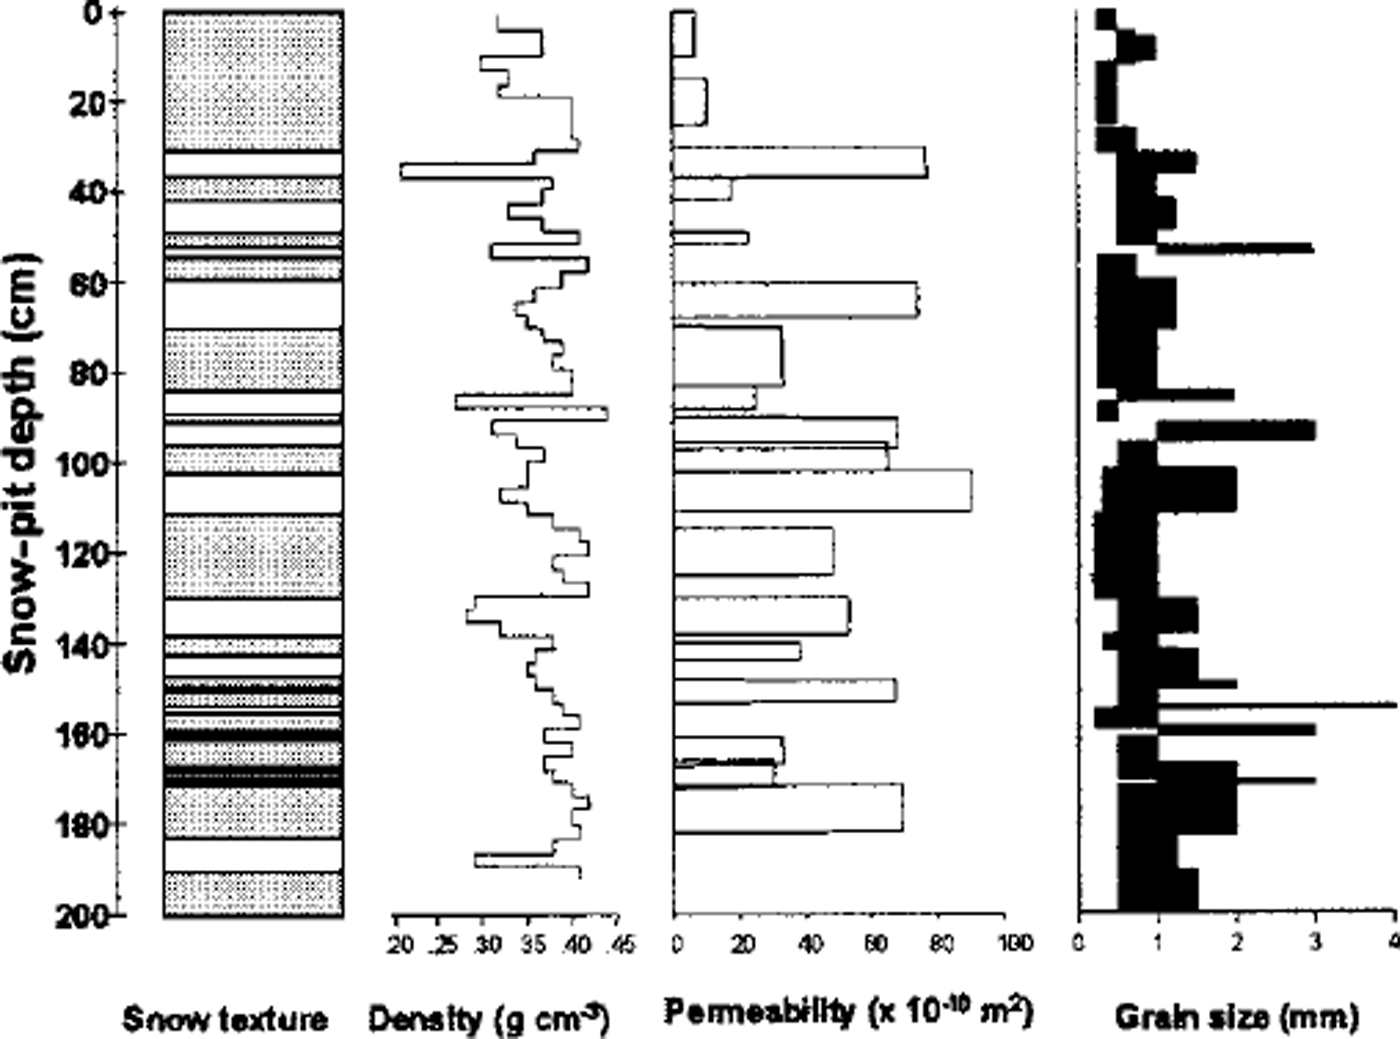
Fig. 2. Layering, density, permeability and grain-size range from pit measurements in the top 2 m of snow andfirn at Siple Dome.
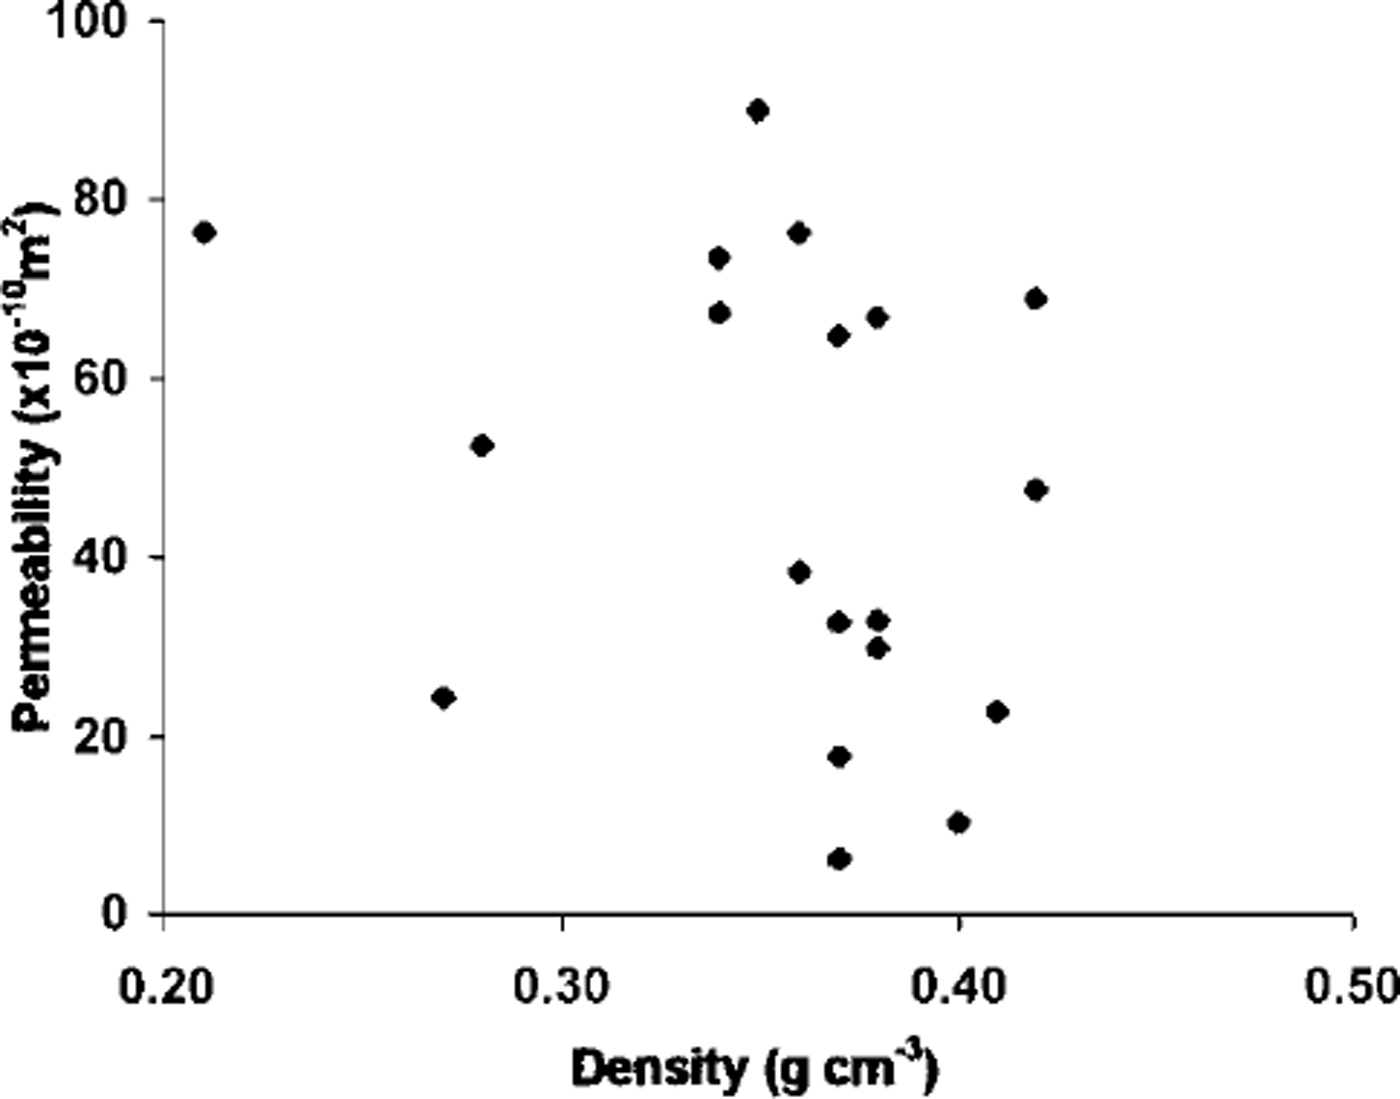
Fig. 3. Permeability as a function of density in the top 2 m.
For depths of ≥ 2 m in the firn, we measured permeability from firn-core samples. Figure 4 depicts permeability measurements made on samples of snow from the surface down to 15 m depth. In contrast to a common assumption that the permeability will decrease with depth in firn, it is evident that the maximum permeability in the column of firn exists at approximately 3 m depth. This is most likely due to snow and firn metamorphism; recrystallization has created greater pore space in the near-subsurface firn. Below 3 m, compaction causes the permeability to decrease with depth. Our modeling (Reference AlbertAlbert, 1996) shows that large subsurface permeabilities allow significant ventilation in the top meters of firn, in spite of pressure variations ascribable to wind forcing decreasing with depth. One somewhat surprising observation from Figure 4 is that the lowest permeability in the top 10 m occurs in the wind-packed snow at the snow-air interface. These measurements were made in the spring (November) at Siple Dome; it is possible that seasonal variations in meteorology and their effects on snow metamorphism could alter the microstructure in the top 20 cm or so, creating greater (or lesser) permeabilities at the snow surface in other seasons.
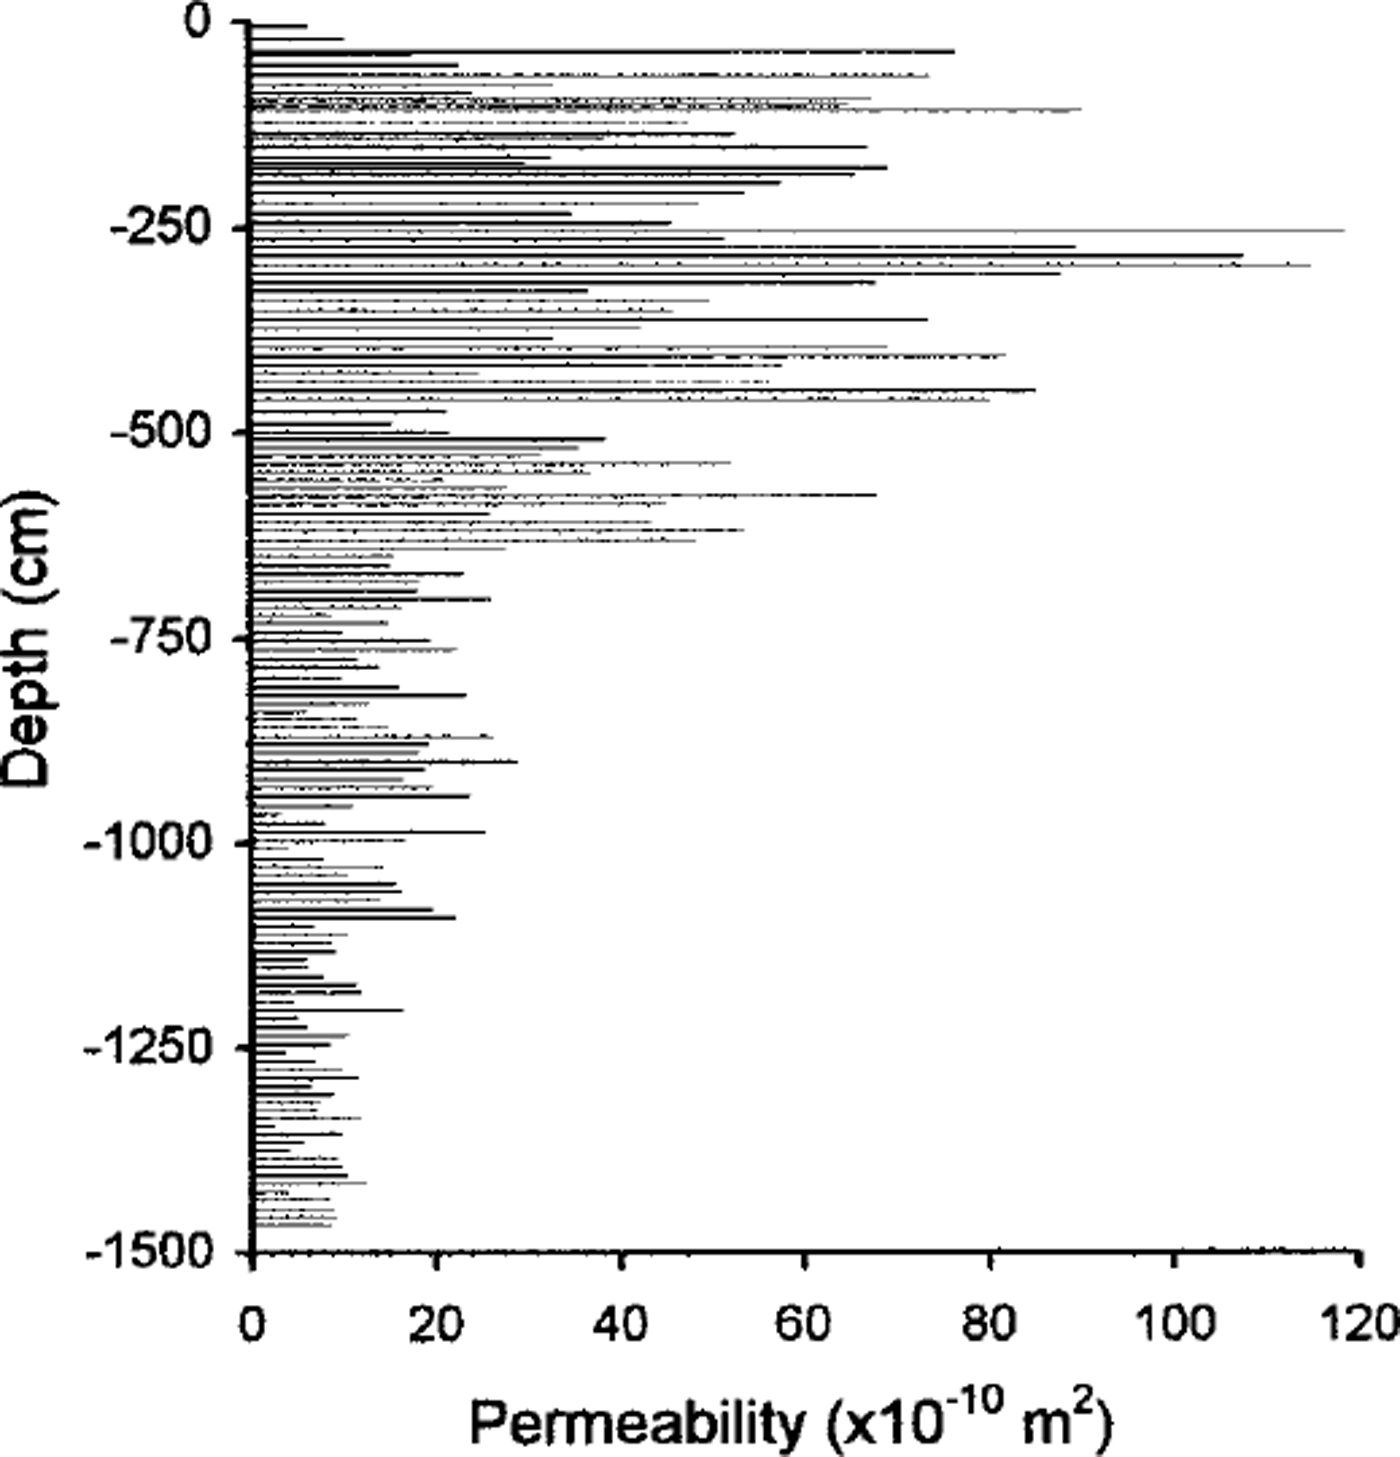
Fig. 4. Permeability of the snow andfirn at Siple Dome from the surface down to 15 m depth.
For rough estimates it is sometimes useful to have an expression for gross variation of permeability with depth, ignoring layer-scale variation. In order to provide a formula for the larger-scale or gross variation of permeability with depth, a polynomial was fit to the permeability data:

where P is the permeability in m2, and z is the depth in firn in m. Figure 5 depicts the data and the curve, which fits with an r 2 value of 0.65 due to the impact of smaller-scale (layer) variation on the larger-scale profile.
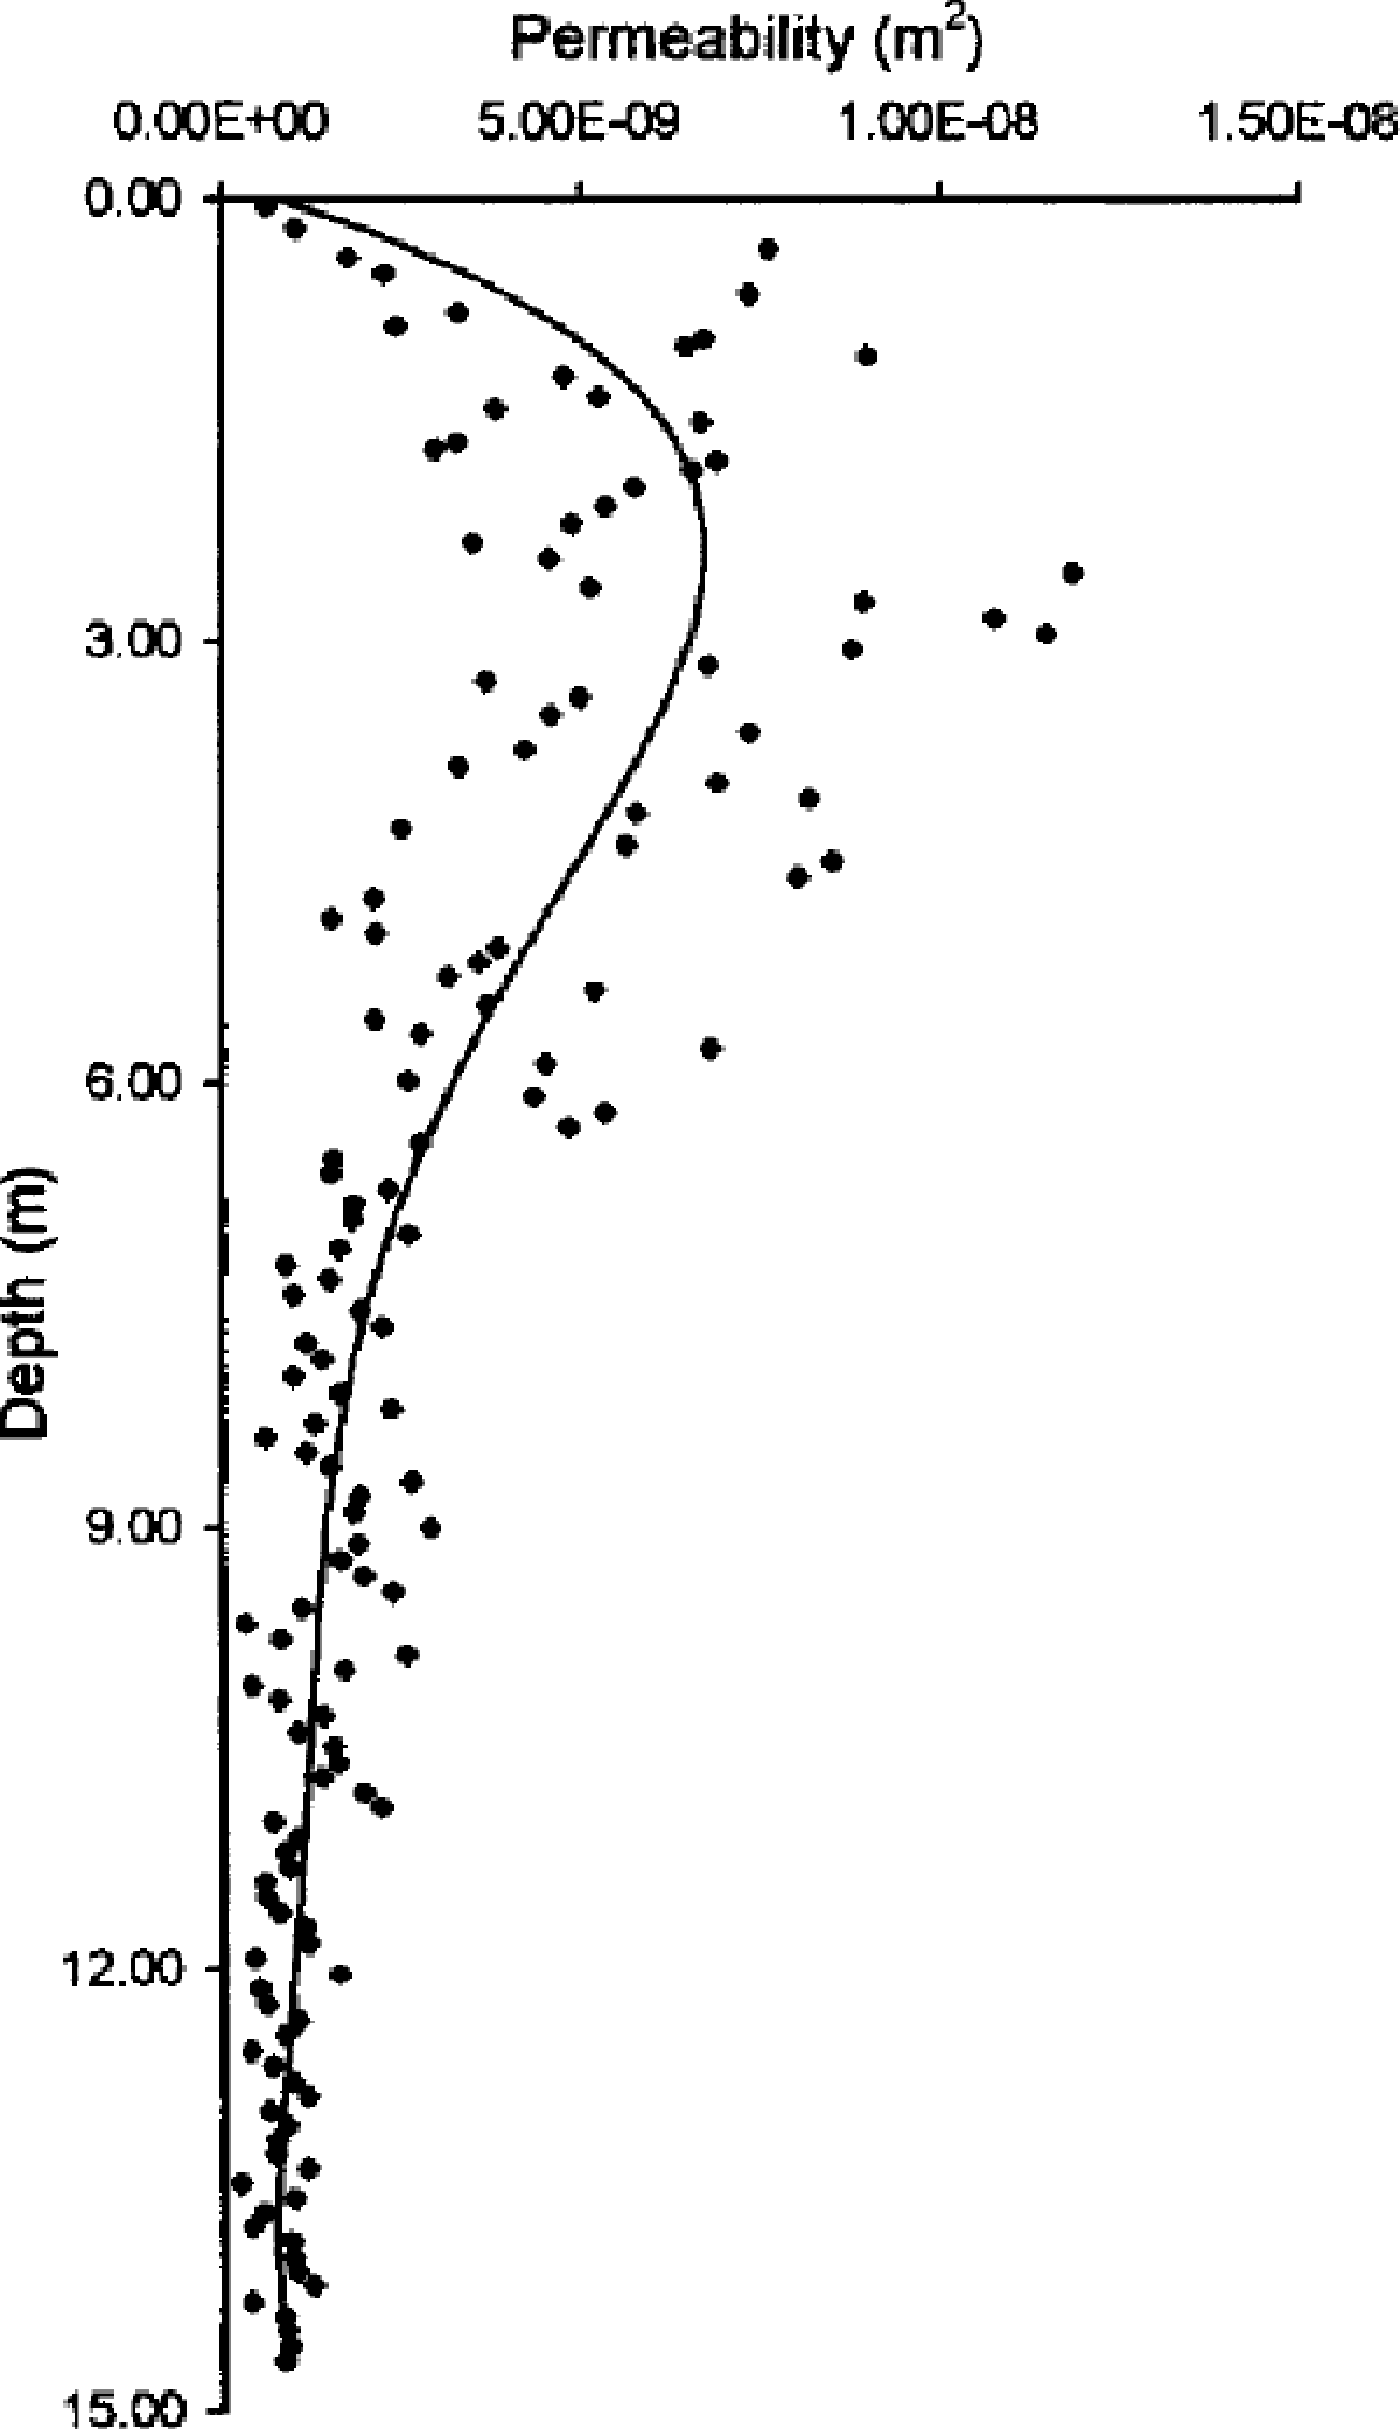
Fig. 5. Curve fit to gross variation of permeability with depth.
Microstructure
Snow and firn microstructure ultimately control the permeability and the physical and chemical processes that take place within the firn. Thick sections of snow samples were preserved in dimethyl phthalate and imaged (Reference PerlaPerla, 1982) for quantitative microscopy of the microstructure. We present some preliminary images and measurements of the microstructure, for comparison with permeability measurements. Figure 6 depicts samples of the imaged microstructure from two layers of snow and firn at Siple Dome. A sample from the surface wind pack at approximately 18 cm depth is depicted in Figure 6a, where the snow density is 212 kg m–3, equivalent sphere radius is 0.13 mm and the volume/surface ratio of the grains within the snow sample is 0.044 mm. The measured permeability on this wind pack was 10 × lO"10 m2. Printed on the same scale in Figure 6b is an image of fine-grained firn from approximately 2 m depth, where the density is 430 kg m–3, equivalent sphere radius is 0.45 mm and the volume/surface ratio is 0.15 mm. The measured permeability on this sample was 29 × l0–10 m2. The firn at this depth is approximately 6 years old. In spite of the density being much greater than that of the wind pack, the grain-scale characteristics serve to yield a permeability that is almost triple that of the wind pack. Changing meteorology over time has driven snow metamorphism, causing crystal growth, increased pore space and increased permeability in the firn at this depth over the snow closer to the surface. The layered nature of the snow and firn affects both advective and diffusive transport processes. Further analysis is underway to relate the permeability measurements to the microstructural measurements, and to use the measurements to model heat, water-vapor and chemical-species transport through the firn.
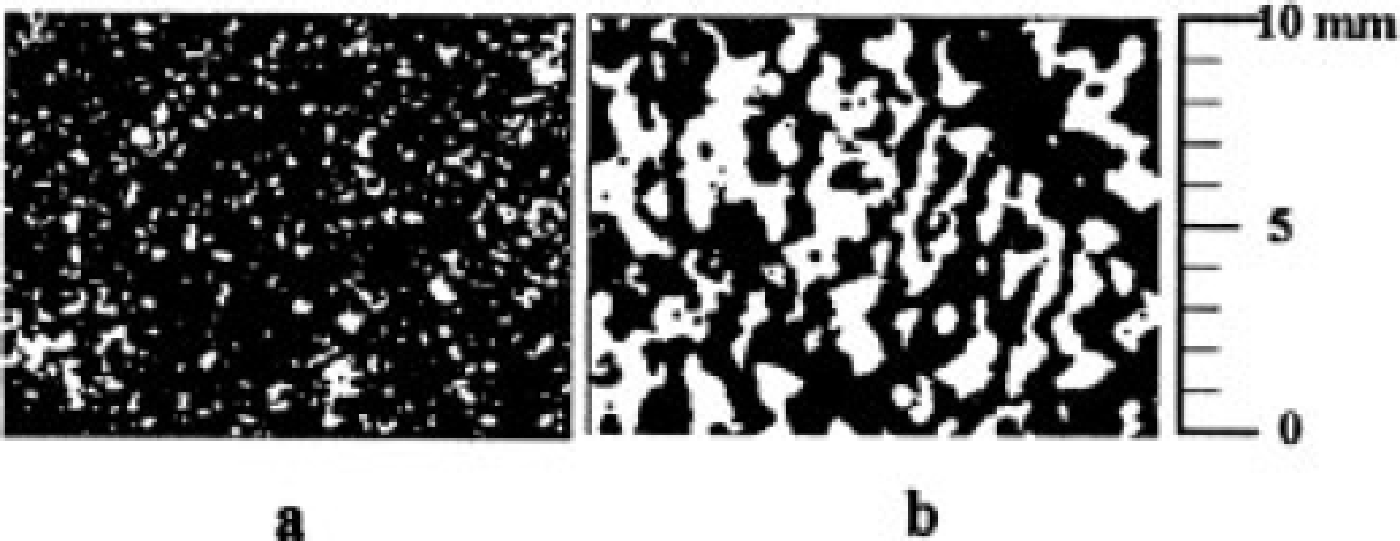
Fig. 6. Sample of the imaged microstructure of two layers of snow and firn at Siple Dome, (a) Wind-packed snow from approximately 18 cm depth: density = 212 kg m3 ; equivalent sphere radius = 0.13 mm; volume/surface ratio = 0.044 mm. (b) Fine-grainedfirnfrom approximately 2 m depth: density 430 kgm3 ; equivalent sphere radius = 0.45 mm; volume/ ratio >. ratio = 0.15 mm.
Conclusions
Measurements of snow and firn permeability and microstructure at Siple Dome show that layering and microstructure have large effects on permeability The maximum permeability, 280 × 10–10 m2, occurs at approximately 3 m depth and generally decreases below that. This could serve to facilitate ventilation and transport processes at that depth, despite driving forces that are reduced in comparison to those at the surface. The lowest permeability in the top 15 m of snow and firn, 10 × l0–10 m2, was measured in the surface wind pack in spring (November). It is hypothesized that because the surface snow is subject to large seasonal and sometimes diurnal temperature gradients, near-surface metamorphism may be able to cause seasonal variations in the permeability of the snow in approximately the top 20 cm, causing it to have greater (or lesser) permeability in other seasons. An expression relating the gross permeability variation with depth was presented. We found that density is in general not a good indicator of permeability Quantitative microscopy may be helpful in relating observed snow characteristics to permeability and useful in modeling firm-fication and chemical-species transport.
Acknowledgements
We thank K. Taylor and G. Lamorey, Science Coordination Office, for their efforts at Siple Dome, Antarctic Science Associates for excellent science support in the field, and the Polar Ice Coring Office for drilling the firn core. This work was funded by U.S. National Science Foundation grant NSF-OPP 9526601. We gratefully acknowledge the NSF grant supplement for support of E. Shultz through the Research Experiences for Undergraduates program.


