INTRODUCTION
Global warming is inducing a wide range of changes in the climate system (IPCC Reference Field, Barros, Dokken, Mach, Mastrandrea, Bilir, Chatterjee, Ebi, Estrada, Genova, Girma, Kissel, Levy, MacCracken, Mastrandrea and White2014). Recently, there has been a growing scientific interest in biospheric responses and feedbacks to climate change. Plant phenology is considered to be one of the most sensitive and easily observable indicators of both short-term variability and long-term changes in climate (van Vliet & Schwartz Reference van Vliet and Schwartz2002; Cleland et al. Reference Cleland, Chuine, Menzel, Mooney and Schwartz2007). The knowledge of how up-to-date climatic variability influences phenological timing can provide a baseline for crop model development and assessment of plant responses to future climate change. Many studies have reported significant advances of spring phenological events, such as budding, leafing and flowering of plants, while changes in timing of autumn phenological events, such as fruit setting and leaf fall, have been less certain (Sparks & Menzel Reference Sparks and Menzel2002; Chmielewski et al. Reference Chmielewski, Müller and Bruns2004; Schwartz et al. Reference Schwartz, Ahas and Aasa2006; Pudas et al. Reference Pudas, Leppala, Tolvanen, Poikolainen, Venalainen and Kubin2008; Julien & Sobrino Reference Julien and Sobrino2009; Gordo & Sanz Reference Gordo and Sanz2010). However, there is a great variability among species in their phenological sensitivity to climate. Cleland et al. (Reference Cleland, Allen, Crimmins, Dunne, Pau, Travers, Zavaleta and Wolkovich2012) suggested that species that cannot phenologically ‘track’ climate might be at increased risk associated with climate change. The results of Springate & Kover (Reference Springate and Kover2014) supported the idea that phenological sensitivity, defined as the shift in phenological event date per degree of temperature change, might be a good indicator of success under increased temperatures at both genotypic and species level.
Grapevine (Vitis vinifera L.) is a phenologically distinct crop with the major development stages being bud break, flowering, veraison and harvest (Jones & Davis Reference Jones and Davis2000). The pace of grapevine development differs with cultivar, climate and weather conditions, topography, soil and vineyard management practices. Each grapevine cultivar has its own climatic requirements, which, if satisfied, allows the grapevine to complete its annual cycle successfully and yield quality grapes with favourable composition. Matching genetic material to site characteristics is a basic viticultural practice to enhance yield and grape quality.
As a climatically sensitive plant, grapevine can alter its genetically predetermined characteristics, including onset and duration of the phenological events. In the context of climate change, a better understanding of cultivar differences in phenology is important for selection of cultivars that are adapted for growing under changing climate conditions. Temperature is considered to be the most important climatic factor influencing the pace of development and productivity of grapevine (Mullins et al. Reference Mullins, Bouquet and Williams1992). The effect of temperature on grapevine depends not only on the average values that influence grapevine physiology and grape composition (Coombe Reference Coombe1987), but also on the intensity and frequency of extreme values. Extreme low temperatures may cause freezing injury to grapevines. The minimum temperature that vine may resist in the winter varies from −5 to −20 °C (Winkler et al. Reference Winkler, Cook, Kliewer and Lider1974), depending on cultivar, location, timing and duration of the low-temperature episode, as well as vineyard management. Spring temperatures below –2·5 °C may damage buds and consequently reduce yields and quality of grapes (Riou Reference Riou1994). High temperatures during berry growth may cause premature veraison, damage of the grape skin, abscission of the berries, desiccated fruit and impaired flavour development (Mullins et al. Reference Mullins, Bouquet and Williams1992). Very warm weather during maturation may accelerate ripening, causing a faster breakdown of acid and an increase in sugar content in grapes, which leads to higher alcohol and lower acid levels in the resulting wine (Duchêne et al. Reference Duchêne, Huard, Dumas, Schneider and Merdinoglu2010). According to some studies, low night temperatures during ripening along with a large diurnal temperature range stimulate the synthesis of anthocyanins and other phenolic compounds (Kliewer & Torres Reference Kliewer and Torres1972; Mori et al. Reference Mori, Goto-Yamamoto, Kitayama and Hashizume2007).
Numerous studies have found that the majority of European wine regions have been subject to significant warming trends in recent decades (Jones et al. Reference Jones, Duchene, Tomasi, Yuste, Braslavska, Schultz, Martinez, Boso, Langellier, Perruchot, Guimberteau and Schultz2005b; Laget et al. Reference Laget, Tondut, Deloire and Kelly2008; Ramos et al. Reference Ramos, Jones and Martínez-Casasnovas2008; Vršič & Vodovnik Reference Vršič and Vodovnik2012; Bonnefoy et al. Reference Bonnefoy, Quenol, Bonnardot, Barbeau, Madelin, Planchon and Neethling2013). This tendency was also observed in other vineyard regions worldwide, including Australia (Hall & Jones Reference Hall and Jones2010), New Zealand (Sturman & Quénol Reference Sturman and Quénol2013), South Africa (Bonnardot & Carey Reference Bonnardot and Carey2008) and the USA (Jones Reference Jones2005). Warming during the second half of the 20th century generally improved the quality of wine (Jones & Davis Reference Jones and Davis2000; Nemani et al. Reference Nemani, White, Cayan, Jones, Running, Coughlan and Peterson2001; Jones et al. Reference Jones, White, Cooper and Storchmann2005a; Jones & Goodrich Reference Jones and Goodrich2008; Ramos et al. Reference Ramos, Jones and Martínez-Casasnovas2008), especially in cooler vineyard regions such as Poland (Lisek Reference Lisek2008) and Canada (Caprio & Quamme Reference Caprio and Quamme2002). The rising temperature trend was recognized as a problem in wine production, due to increased heat and water stress, in vineyard regions where grapevine is grown close to the optimum temperature, such as vineyards in Australia (Webb et al. Reference Webb, Whetton and Barlow2008; Hall & Jones Reference Hall and Jones2010).
Considerable shifts in grapevine phenology have been recorded in many vineyard regions of Europe (Jones et al. Reference Jones, Duchene, Tomasi, Yuste, Braslavska, Schultz, Martinez, Boso, Langellier, Perruchot, Guimberteau and Schultz2005b; Jones Reference Jones2006; Ramos et al. Reference Ramos, Jones and Martínez-Casasnovas2008; Dalla Marta et al. Reference Dalla Marta, Grifoni, Mancini, Storchi, Zipoli and Orlandini2010; Bock et al. Reference Bock, Sparks, Estrella and Menzel2011; Tomasi et al. Reference Tomasi, Jones, Giust, Lovat and Gaiotti2011; Daux et al. Reference Daux, Garcia de Cortazar-Atauri, Yiou, Chuine, Garnier, Le Roy Ladurie, Mestre and Tardaguila2012), USA (Wolfe et al. Reference Wolfe, Schwartz, Lakso, Otsuki, Pool and Shaulis2005) and Australia (Sadras & Petrie Reference Sadras and Petrie2011; Webb et al. Reference Webb, Whetton and Barlow2011) in recent decades. Observed tendencies towards earlier onset of phenological stages and shortening of the growth intervals have been attributed mainly to rising temperatures (Jones & Davis Reference Jones and Davis2000; Bock et al. Reference Bock, Sparks, Estrella and Menzel2011). Even though early maturation is generally associated with higher vintage ratings (Jones & Davis Reference Jones and Davis2000), it has been suggested that warmer conditions with advancement of phenology impact on aromatic profiles and the balance between sugar content and acidity in grapes at harvest. This leads to the loss of wine typicity, a term in wine tasting used to describe the degree to which a wine reflects its varietal origins (Bock et al. Reference Bock, Sparks, Estrella and Menzel2011).
To date, studies regarding grapevine phenology variability and trends in viticultural regions of Serbia are non-existent, mostly due to a lack of suitably long and reliable phenological data. The only objective dataset for detecting meaningful trends in Serbia is that for the historical grape-growing area of Sremski Karlovci in the province of Vojvodina, where vine cultivation dates back to Roman times. At the experimental station of the Novi Sad Faculty of Agriculture, four main phenological stages (budburst, flowering, veraison and harvest) for a number of grapevine cultivars have been monitored since 1986. Sremski Karlovci belongs to the Srem viticultural region, which, according to the Winkler index based on growing degree-days (GDD) (Amerine & Winkler Reference Amerine and Winkler1944), falls into Winkler region II (Ruml et al. Reference Ruml, Vuković, Vujadinović, Djurdjević, Rankovic-Vasić, Atanacković and Pospišil2012a). According to the classification based on average growing season temperature (Jones Reference Jones2006), the region belongs to the warm category (Ruml et al. Reference Ruml, Vuković, Vujadinović, Djurdjević, Rankovic-Vasić, Atanacković and Pospišil2012a), which allows for a very large range of cultivars to ripen successfully. In the Geoviticulture Multicriteria Climatic Classification System defined by Tonietto & Carbonneau (Reference Tonietto and Carbonneau2004), the following viticultural climate classes were identified in the Srem region (Ruml et al. Reference Ruml, Vuković, Vujadinović, Djurdjević, Rankovic-Vasić, Atanacković and Pospišil2012a): the temperate class HI–1 (where late varieties can reach maturity), sub-humid class DI–1 (absence of dryness) and the very cool nights class CI + 2 (the positive effect of low night temperatures on colour, aroma and flavour characteristics). Comparison of indices of Serbian and viticultural regions given in Jones et al. (Reference Jones, Moriondo, Bois, Hall and Duff2009) reveals that viticultural regions of Serbia, including the Srem region, have a very specific viticultural climate. Regions with similar thermic conditions, such as Côtes du Rhône Méridionales in France, Barolo, Chianti and Classico Vino Nobile di Montepulciano in Italy, and Porto and Vinho Verde in Portugal, are much drier and with higher minimum temperatures in the ripening month. Considering hydric characteristics, Serbian regions are similar to much cooler German vineyard regions.
Since climate change and phenological shifts are not homogenous, it is very important, as for other regions in Europe and worldwide, to explore ongoing changes in climate and their effects on grapevine growing in the Serbian wine-producing areas, especially having in mind their specific viticultural climate. Therefore, the current research was undertaken in order to: (1) determine the structure and trends in the historical temperature and phenological data for the region of Sremski Karlovci; (2) explore phenology–temperature relationships; (3) identify key temperature variables and periods during grapevine growth that could explain variation in phenological dynamics; (4) examine wine grape cultivar differences in phenological timing and their response to climate variability in the studied area.
MATERIALS AND METHODS
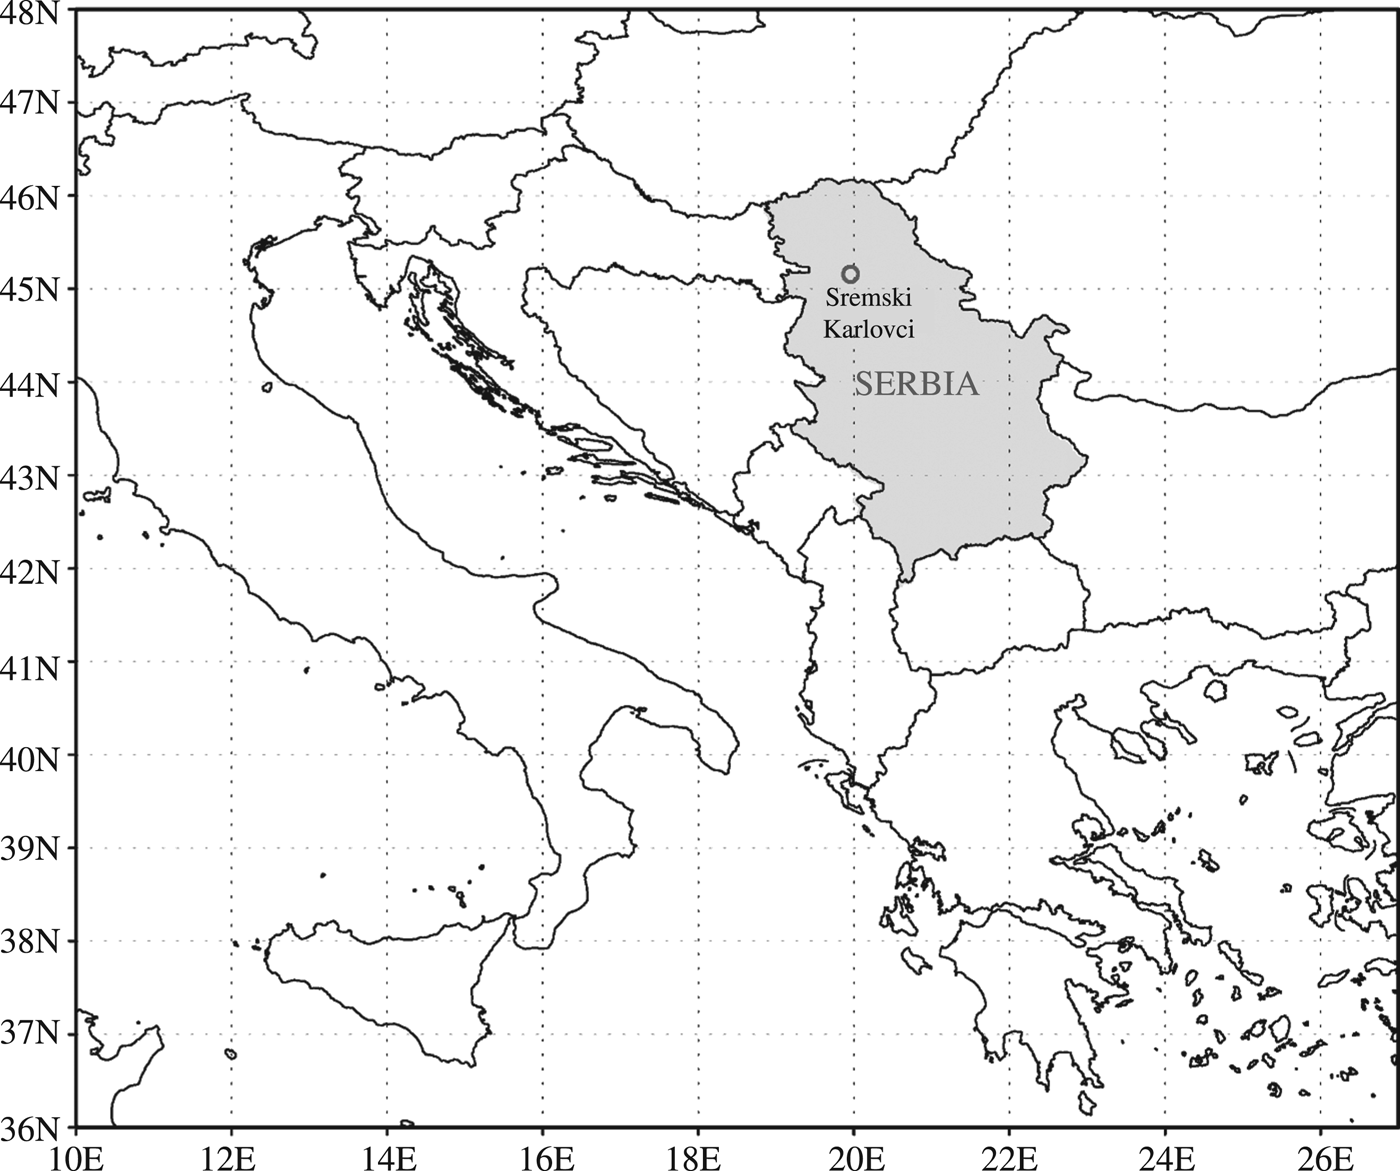
Phenological data were collected at the Novi Sad Faculty of Agriculture experimental station. The station is situated in Sremski Karlovci (45°10′ N, 20°10′ E, 110 m asl), 12 km away from Novi Sad in the northern part of Serbia (Fig. 1). The vineyards are located on the Mt. Fruška Gora's slopes by the Danube River, which moderates temperature extremes, while the inclines ensure maximum heat and light exposure. The climate of the region is temperate continental of a transitional type, with mean annual air temperature of 12·3 °C and mean annual precipitation of 650 mm. The coldest month is January, the warmest July. The precipitation maximum is in May and June. The soil at the site is pararedzina on loess. The collection was established in 1979 and each cultivar is represented by 20 vines planted with a spacing of 3 × 1 m and trained using the single Guyot system.

Fig. 1. Site location.
For the study, a group of 20 wine grape cultivars (seven red and 13 white, both Serbian and internationally recognized cultivars) was selected from the ampelographic collection (i.e. a collection for identifying and classifying grapevines). Four phenological stages of grapevine were examined for the period 1986–2011: the beginning of budburst – the date when green shoot tips became just visible, identified as stage 7 on the BBCH scale (Lorenz et al. Reference Lorenz, Eichhorn, Bleiholder, Klose, Meier and Weber1995); the beginning of flowering – the date when first flower hoods are detached from the receptacle (stage 60 on the BBCH scale); the beginning of veraison – the date when berries begin to develop cultivar-specific colour (stage 81 on the BBCH scale); and harvest (stage 89 on the BBCH scale). Harvest is the most subjective event and cannot be considered a true phenological stage, since it mainly depends upon winery requests and some other constraints such as current weather conditions, disease outbreaks, etc. A detailed phenological analysis of the cultivars studied can be found in Ruml et al. (Reference Ruml, Korać, Ivanišević, Vujadinović and Vuković2013).
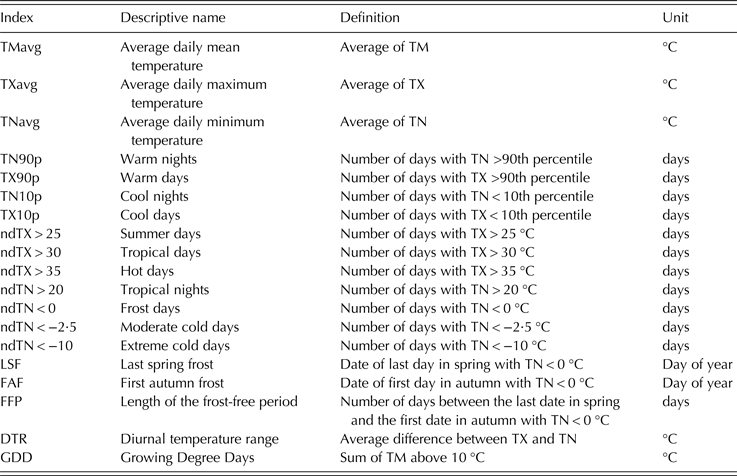
The temperature data, consisting of daily observations of maximum (TX) and minimum (TN) air temperature, were provided by the Republic Hydrometeorological Service of Serbia. The temperature observations were used to derive other variables and indices important for grapevine growing. The mean daily temperature (TM) was computed as the arithmetic mean of TX and TN. To find changes in temperature extremes, indices that suited the study goals were selected from the core indices recommended by WMO Commission for Climatology and the Expert Team on Climate Change Detection, Monitoring and Indices (ETCCDMI) of the Climate Variability and Predictability (CLIVAR) project (Zhang et al. Reference Zhang, Alexander, Hegerl, Jones, Klein Tank, Peterson, Trewin and Zwiers2011). Recently, these indicators were widely used to evaluate changes of extreme temperatures all around the world (Moberg et al. Reference Moberg, Jones, Lister, Walther, Brunet, Jacobeit, Alexander, Della-Marta, Luterbacher, Yiou, Chen, Klein Tank, Saladié, Sigró, Aguilar, Alexandersson, Almarza, Auer, Barriendos, Begert, Bergström, Böhm, Butler, Caesar, Drebs, Founda, Gerstengarbe, Micela, Maugeri, Österle, Pandzic, Petrakis, Srnec, Tolasz, Tuomenvirta, Werner, Linderholm, Philipp, Wanner and Xoplaki2006; El Kenawy et al. Reference El Kenawy, Lopez-Moreno and Vicente-Serrano2011; Toros Reference Toros2012; Donat et al. Reference Donat, Peterson, Brunet, King, Almazroui, Kolli, Boucherf, Al-Mulla, Nour, Aly, Ali Nada, Semawi, Al Dashti, Salhab, El Fadli, Muftah, Eida, Badi, Driouech, El Rhaz, Abubaker, Ghulam, Erayah, Mansour, Alabdouli, Al Dhanhani and Al Shekaili2014; Salinger et al. Reference Salinger, Shreshta, Ailikun, Dong, McGregor, Wang, Manton and Stevenson2014). Selected indices (Table 1) included relative indices (based on a percentile threshold), absolute indices (based on a fixed threshold) and variability extremes or mixed temperature indices (analysing the relationship between maximum and minimum temperatures). Threshold values of absolute indices were chosen to be biologically meaningful for grapevine. Temperature-based indices were computed for the calendar year, growing season and several grapevine growth periods as follows: 1 January to the beginning of budburst; the beginning of budburst to the beginning of flowering; the beginning of flowering to the beginning of veraison; and the beginning of veraison to harvest. The mean dates averaged across all examined cultivars were used as the phenological event onset time.
Table 1. Definition of indices based on daily mean (TM), maximum (TX) and minimum (TN) temperatures

Temperature and phenological data were analysed separately for their statistical properties, inter-annual variability and trends. Analysis of temperature series was limited to the period from 1981 to 2007, when the National Service terminated their observation programme at the site. In order to obtain as much information as possible about recent temperature and phenology changes and variability, the longest available data series were used for determining temporal trends, even though they did not cover exactly the same time interval. To examine phenology–temperature relationships, the period 1986–2007 was used, because it was the mutual period of both datasets.
The inter-annual variability of the variables was estimated by determining their standard deviations. The direction and magnitude of temporal trends were evaluated using a least-squares linear regression method. Despite its simplicity, the least-squares linear regression model has proven to be a useful tool for description of phenological time-series behaviour (Parmesan & Yohe Reference Parmesan and Yohe2003; Menzel et al. Reference Menzel, Sparks, Estrella, Koch, Aasa, Ahas, Alm-Kübler, Bissolli, Braslavská, Briede, Chmielewski, Crepinsek, Curnel, Dahl, Defila, Donnelly, Filella, Jatczak, Måge, Mestre, Nordli, Peñuelas, Pirinen, Pemišová, Scheifinger, Striz, Susnik, van Vliet, Wielgolaski, Zach and Zust2006) and it also offers the possibility of comparison with phenological trends already reported from different regions of the world. The Pearson correlation coefficient was used to relate the onset of phenological stages to the temperature variables. The key periods during which a temperature affected the onset of phenological events most markedly was determined using a correlation coefficient calculated for different periods preceding the events. The slope of linear regression between the onset of phenological events and temperature was considered a measure of phenological sensitivity.
Statistical analysis was performed using XLSTAT version 2014·1.
RESULTS
Analysis of temperature data
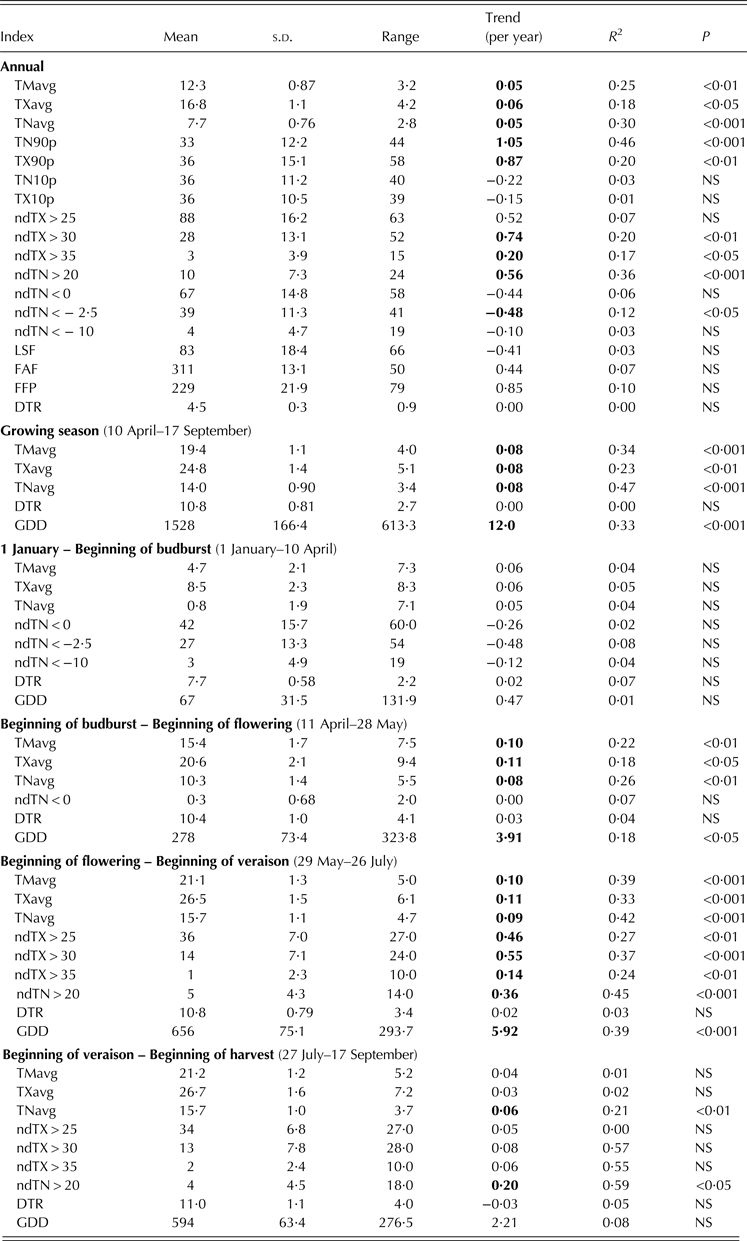
Basic descriptive statistics, the slope of linear regressions, corresponding coefficients of determination and levels of statistical significance for the selected temperature indices are displayed in Table 2.
Table 2. Descriptive and trend statistics for indices based on daily mean (TM), maximum (TX) and minimum (TN) temperature for the region of Sremski Karlovci over the period 1981–2007

Bold values correspond to trends P < 0·05.
Average annual and growing season TM, TX and TN increased significantly at similar rates, with TN showing the smallest inter-annual variability, the highest coefficient of determination and the highest level of statistical significance (P < 0·001) of temporal trends. The annual series of most indices related to high temperatures showed positive trends. The trends of warm night occurrence and the number of tropical nights exhibited the highest coefficient of determination and the highest level of statistical significance among all annual trends. The annual number of tropical days increased at a faster rate than the annual number of summer days, which did not show a significant trend at the annual level. The number of days with so-called ‘negative’ temperatures for vine (TX > 35 °C) increased significantly (P < 0·05). Annual and seasonal frequencies of days with low temperatures declined, but not significantly, with the exception of the annual number of days with TN < –2·5 °C, which did show a significant negative trend (P < 0·05). The combined effect of the earlier last spring frost and later first autumn frost lengthened the frost-free period, but none of these trends was significant.
Heat accumulation during the growing season, calculated as GDD, increased significantly (P < 0·001), mostly during the period from the beginning of budburst to the beginning of veraison. Diurnal temperature range had a small or no change in all periods examined, as both TN and TX increased at similar rates in all of them, except during the ripening period. The largest trends of temperature-based indices in the period from the beginning of flowering to the beginning of veraison, and absence of significant trends in most indices during ripening, can be explained by the fact that June and July temperatures showed the greatest and the most significant (P < 0·01) positive trends among all calendar months, while September temperatures showed a negative (but not significant) trend (data not shown). The only indices showing significant change during the ripening period were TN (P < 0·01) and the number of tropical nights (P < 0·05). In the period from the beginning of the year to the beginning of budburst, no significant trends were observed either in average or in cold-related indices.
Analysis of grapevine phenological data
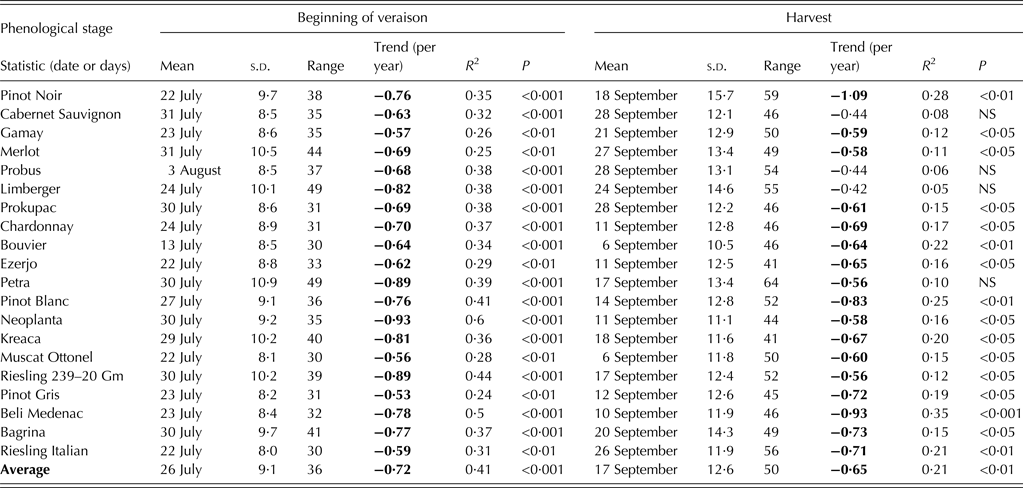
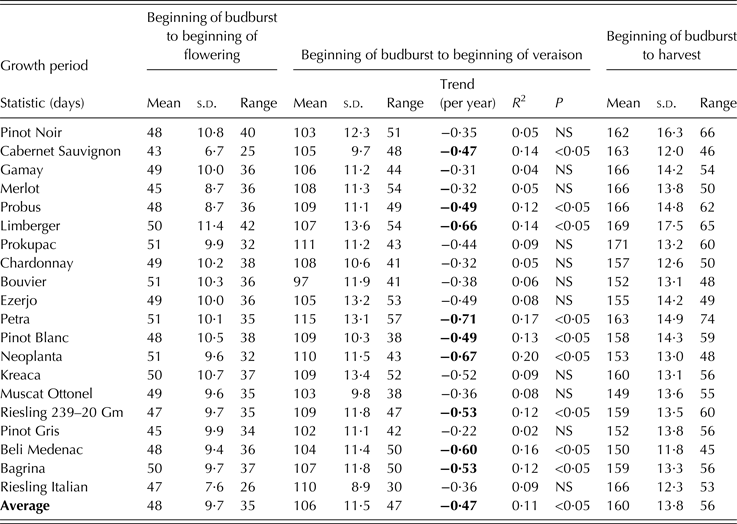
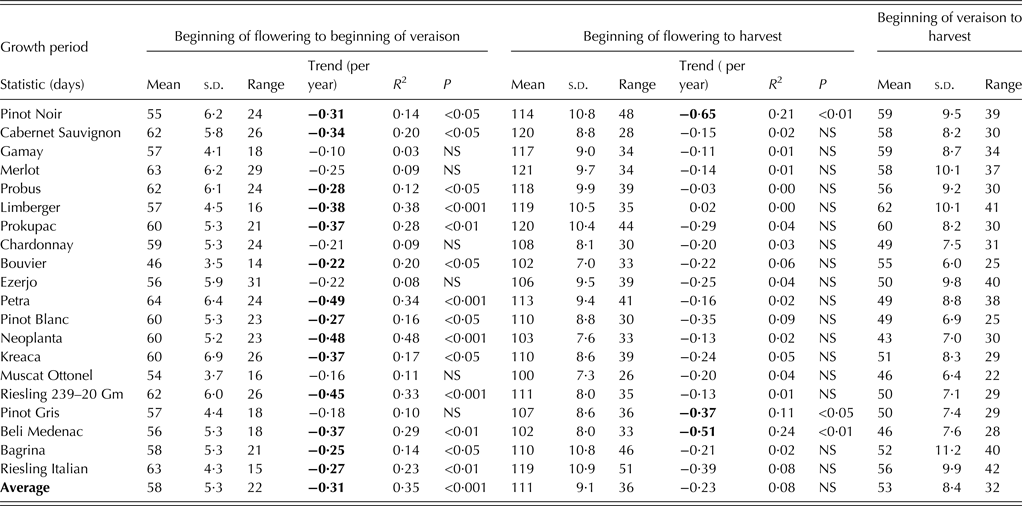
The basic descriptive statistics and trends of phenological stages and corresponding intervals between them for 20 wine grape cultivars grown in the region of Sremski Karlovci between 1986 and 2011 are given in Tables 3 and 4, and Tables 5 and 6, respectively. In the last column of the tables, parameter values correspond to the ‘average cultivar’. The date for each phenological stage of this ‘average cultivar’ was obtained by averaging dates over all examined cultivars for each year. Interval length between phenological events, slopes and correlation coefficients were then determined for that ‘average cultivar’, not by averaging values of these parameters across all cultivars.
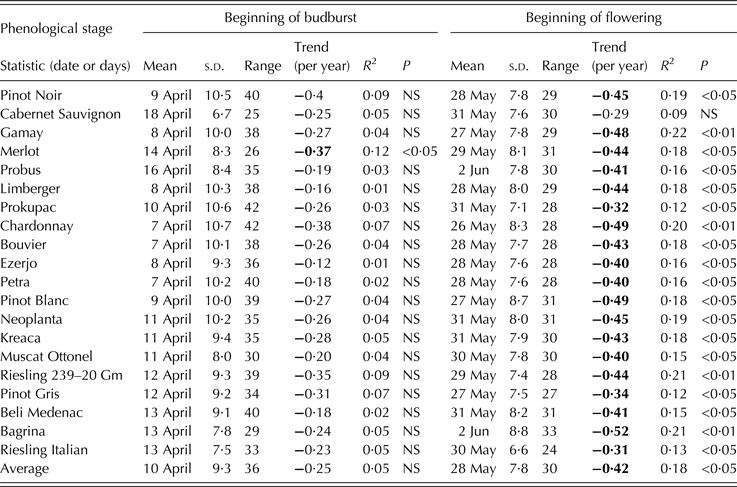
Table 3. Descriptive and trend statistics for the beginning of budburst and beginning of flowering for the region of Sremski Karlovci over the period 1986–2011

Bold values correspond to trends significant at P < 0·05.
Table 4. Descriptive and trend statistics for the beginning of veraison and harvest for the region of Sremski Karlovci over the period 1986–2011

Bold values correspond to trends significant at P < 0·05.
Table 5. Descriptive statistics for length of grapevine growth periods (beginning of budburst to beginning of flowering, beginning of budburst to beginning of veraison and beginning of budburst to harvest) for the region of Sremski Karlovci over the period 1986–2011

Trends are displayed only for growth periods having trends significant at the 5% level for at least one cultivar. Bold values correspond to trends P < 0·05.
Table 6. Descriptive statistics for length of grapevine growth periods (beginning of flowering to beginning of veraison, beginning of flowering to harvest and beginning of veraison to harvest) for the region of Sremski Karlovci over the period 1986–2011

Trends are displayed only for growth periods having trends significant at the 5% level for at least one cultivar. Bold values correspond to trends P < 0·05.
An overall mean date for the beginning of budburst was 10 April with a range of 36 days. The cultivars with the earliest beginning of budburst were Chardonnay, Bouvier and Petra, with a mean date of 7 April, and the cultivar with the latest beginning of budburst was Cabernet Sauvignon, with a mean date of 18 April. Cabernet Sauvignon exhibited the lowest budburst year-to-year variability and the least range, while Chardonnay was the cultivar with the highest variability and the greatest budburst range.
The mean date of the beginning of flowering, averaged across all cultivars, was 28 May with a range of 30 days. The earliest flowering, on average, was observed in Chardonnay (26 May) and the latest in Probus and Bagrina (2 June). Riesling Italian exhibited the least variation and smallest range, while Bagrina exhibited the highest year-to-year variation and the greatest range in the beginning of flowering.
The mean date of beginning of veraison averaged across all cultivars was 26 July with a 36-day variation. The earliest beginning of veraison, on average, was observed in Bouvier (13 July) and the latest in Probus (3 August). Riesling Italian had the lowest year-to-year variation and the least range, while Petra had the highest year-to-year variation and the greatest range in the beginning of veraison.
The mean harvest date averaged across all cultivars was 17 September with a range of 50 days. Bouvier and Muscat Ottonel were the cultivars with earliest mean harvest date (6 September), while Cabernet Sauvignon, Probus and Prokupac had the latest mean harvest date (28 September). The cultivar with the lowest inter-annual variation in harvest date was Bouvier and that with the greatest was Pinot Noir. The cultivars with the smallest harvest range were Ezerjo and Kreaca, while Petra had the largest. Temporal correlation analysis between dates of phenological stages averaged across all cultivars (not shown) revealed that the beginning of budburst showed significant correlation only with the beginning of flowering (r = 0·41, P < 0·05). Other phenological stages were strongly correlated: the beginning of flowering with both the beginning of veraison (r = 0·87, P < 0·001) and harvest (r = 0·86, P < 0·001), and the beginning of veraison with harvest (r = 0·92, P < 0·001).
The length of intervals between events is often more important than the dates of phenological events themselves. The most important growth intervals are the growing season (defined here as the period from beginning of budburst to harvest) and ripening phase (from beginning of veraison to harvest). Growing season length averaged 160 days with a mean interval range of 56 days. Muscat Ottonel (149 days) exhibited the shortest average growing season and Prokupac (171 days) the longest. The cultivar with the lowest year-to-year variability and the least interval range (46 days) was Cabernet Sauvignon. Limberger was the cultivar with the greatest year-to-year variability, while Petra had the greatest growing season range (74 days). The ripening phase lasted 53 days, on average, for all cultivars. The length of the ripening phase was the shortest, on average, in Neoplanta (43 days) and the longest in Limberger (62 days). The cultivar with the lowest inter-annual variability was Bouvier, while Bagrina was the cultivar with the greatest variability. Muscat Ottonel was the cultivar with the least ripening interval range (22 days) and Riesling Italian with the greatest (42 days).
Among the phenological stages examined, harvest showed the highest inter-annual variation (Table 4) and the beginning of flowering the least (Table 3). Among growth periods, the interval from budburst to harvest displayed the greatest year-to-year variability (Table 5), and the interval from beginning of flowering to beginning of veraison the smallest (Table 6).
All phenological stages examined showed a negative trend over the period of observation (Tables 3 and 4). The beginning of budburst exhibited no significant trend for any of the cultivars studied, except for Merlot, while the beginning of flowering displayed significant trends for all cultivars, except for Cabernet Sauvignon. The beginning of veraison exhibited significant trends for all cultivars, while harvest dates showed a significant trend for 17 out of the 20 cultivars examined. The steepest slope for the linear trend was obtained for the beginning of veraison (averaged value over all cultivars: –0·7 days/year) with the highest level of significance (P < 0·001). The highest rate of veraison date change was –0·9 days/year, which was observed in cultivars Neoplanta, Petra and Riesling 239 20 Gm, while the smallest rate was –0·5 days/year, which was observed in Pinot Gris. The mean date of the beginning of flowering averaged over all cultivars showed a trend of –0·4 days/year (P < 0·05). The greatest observed trend was –0·5 days/year for Bagrina, Pinot Blanc and Chardonnay and the smallest (non-significant) trend was –0·3 days/year for Cabernet Sauvignon. The mean date of harvest averaged over all cultivars showed a trend of –0·6 days/year (P < 0·05). The largest trend (–1·1 days/year) was found for Pinot Noir and the smallest (–0·4 days/year) trends were found for Limberger, Probus and Cabernet Sauvignon, which were not significant.
No clear pattern of phenological timing changes was detected among cultivars. For instance, the cultivars Limberger and Petra, which exhibited above-average advancement of the beginning of veraison, were among the four cultivars with the smallest and non-significant trends of harvest dates. Merlot was the only cultivar with significant trends for all phenological stages studied. In general, Cabernet Sauvignon displayed the least advancement of phenological stage onset, with the veraison trend being the only significant one. The cultivar with the largest phenological advancement recorded on average for all stages was Pinot Noir.
Intervals between phenological stages showed less-significant temporal trends (Tables 5 and 6) than stages themselves (Tables 3 and 4). The length of all intervals, except the interval from the beginning of veraison to harvest, decreased over the period. However, only the period from the beginning of flowering to the beginning of veraison showed a significant decreasing trend for most cultivars. Besides this growth period, only the interval from the beginning of budburst to the beginning of veraison displayed a significant shortening for the ‘average cultivar’, even though trends were significant for only 8 out of the 20 cultivars.
Relationship between temperature and phenology
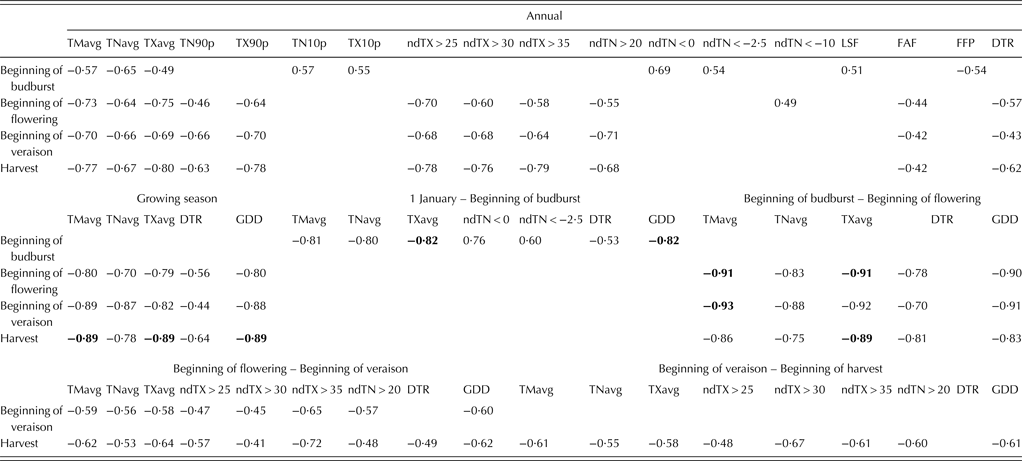
In Table 7, due to the large amount of data, correlation coefficients between the onset of phenological stages and temperature indices are shown for the ‘average cultivar’ only. A cultivar-specific analysis of this kind will be the subject of another paper.
Table 7. Correlation matrix between the onset of grapevine phenological stages (dates averaged across 20 cultivars) and temperature indices calculated for calendar year, growing season and different grapevine growth periods for the region of Sremski Karlovci over the period 1986–2007

A blank cell indicates that the variable does not significantly correlate with the onset of phenological stage (P > 0·05). The highest correlation for each phenological stage is displayed in bold.
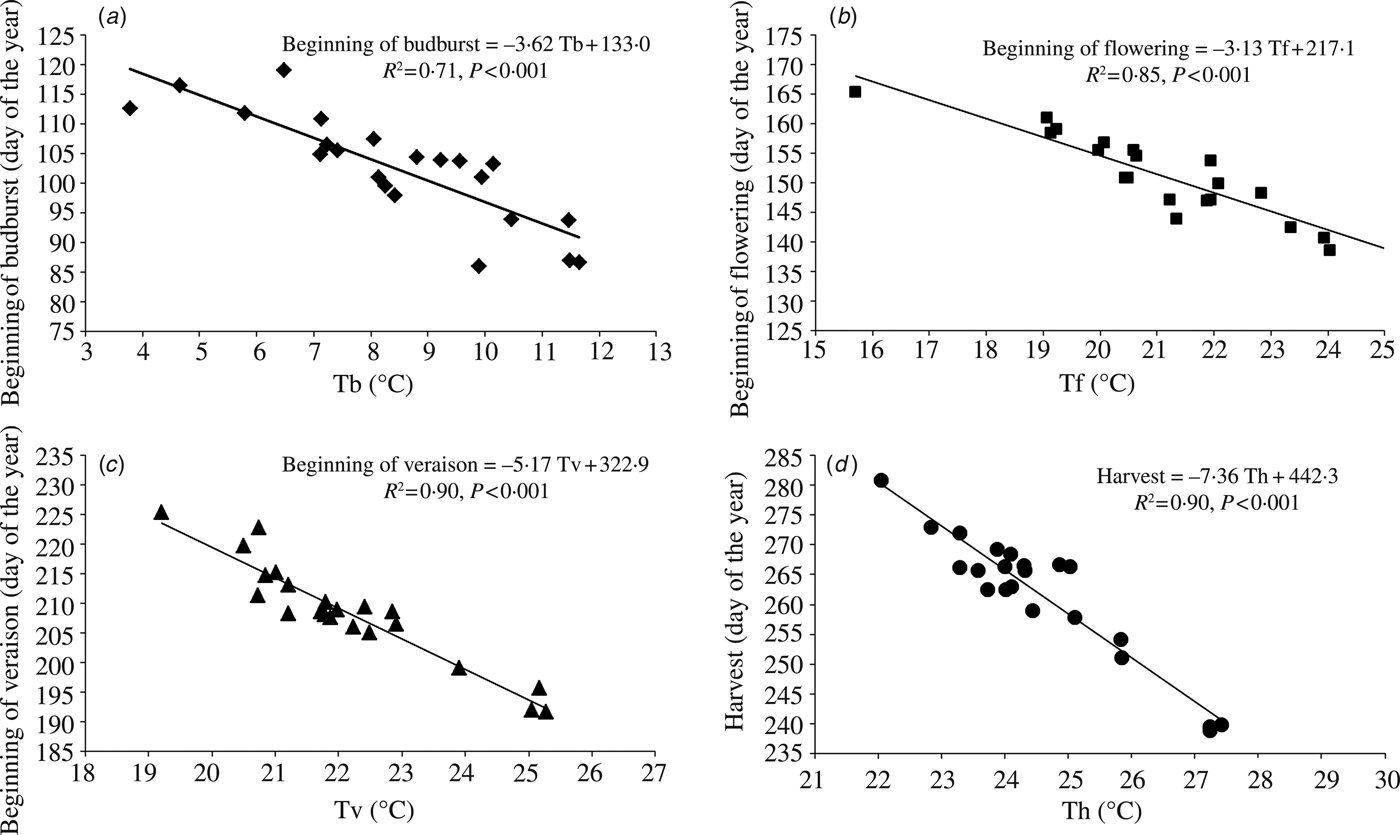
The beginning of budburst dates correlated significantly with average annual temperatures, GDD and temperatures averaged over the period preceding the event and most of the cold-related indices. The onsets of later phenological stages were correlated negatively and significantly with average annual and growing season temperatures, GDD and temperatures averaged over periods preceding the events and heat-related extremes. Among examined temperature indices, the strongest correlation coefficient with the beginning of budburst date exhibited GDD and TX for the period from 1 January to the event onset (r = –0·82, P < 0·001). Dates for the beginning of flowering had the strongest correlations with TM and TX averaged over the period from the beginning of budburst to the beginning of flowering (r = –0·91, P < 0·001). Temperatures averaged over the period from the beginning of budburst to the beginning of flowering exhibited higher correlation with the beginning of veraison and harvest dates than temperatures averaged over the period preceding the events. Dates for the beginning of veraison displayed the strongest correlations with TM averaged over the period from the beginning of budburst to the beginning of flowering (r = –0·93, P < 0·001). Harvest dates were more affected by temperatures higher than 35 °C in the period from the beginning of flowering to the beginning of veraison and temperatures higher than 30 °C in the ripening period than by the average temperatures in these periods. Harvest dates had the strongest correlation with TM averaged over the period from the beginning of budburst to the beginning of flowering and growing season TM, TX and GDD (r = –0·89, P < 0·001).
The division of the growing season into growth periods according to observed dates and further division into different sub-periods provided more insight into the relationship between phenology and temperature than calendar date divisions. The key temperature variable that most influenced the onset of budburst was the mean daily temperature averaged over the period from 1 March to the event onset (r = −0·86, P < 0·001). For the beginning of flowering, the key variable was the maximum daily temperature averaged over the period from 15 April to onset of the event (r = –0·92, P < 0·001). For the beginning of veraison, the most influential factor was the maximum temperature averaged over the period from 1 April to 30 June (r = –0·95, P < 0·001). For harvest, the key variable was maximum daily temperature averaged over the period from 1 April to 31 August (r = –0·95, P < 0·001).
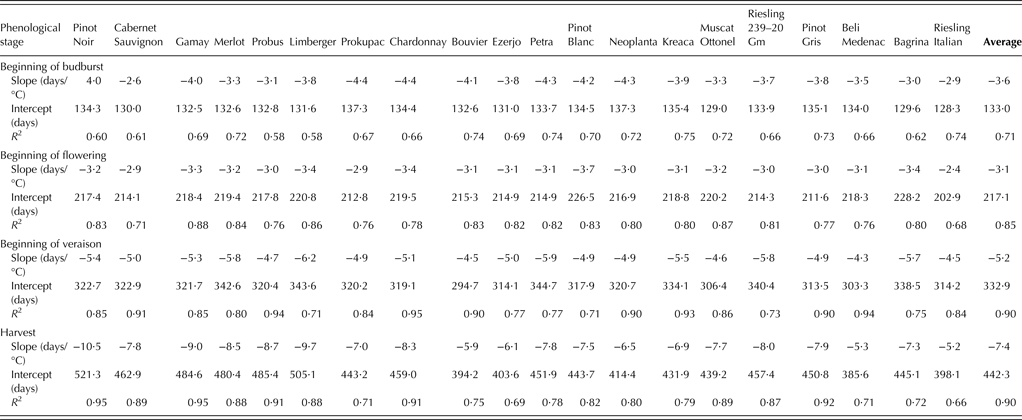
Phenological data fitted linearly to the most relevant temperature variables for ‘average cultivar’ are displayed in Fig. 2. According to regression equations, an increase of 1 °C in the key temperature variable averaged over the most relevant period led to an earlier occurrence of the beginning of budburst, the beginning of flowering, the beginning of veraison and harvest by 3·6, 3·1, 5·2 and 7·4 days, respectively, on average for all cultivars. Phenological sensitivity of individual cultivars, determined as the slope coefficient of a linear regression between the onset of phenological event and the most relevant temperature variable, can be found in Table 8. The cultivar with the smallest advancement in the beginning of budburst date per 1 °C of increase in the mean daily temperature averaged over the period from 1 March to the event onset was Cabernet Sauvignon (–2·6 days), while cultivars with the greatest advancement were Prokupac and Chardonnay (–4·4 days). Riesling Italian exhibited the smallest response in the beginning of flowering date (–2·4 days) per 1 °C of increase in the maximum daily temperature averaged over the period from 15 April to the event onset and Pinot Blanc the greatest (–3·7 days). An increase of 1 °C in average April–June temperature led to an earlier occurrence of veraison from –4·3 days in Beli Medenac to –6·2 days in Limberger. The cultivars studied displayed the greatest difference in phenological sensitivity for harvest, ranging from –5·2 days (Riesling Italian) to –10·5 days (Pinot Noir) per 1 °C of increase in the maximum daily temperature averaged over the period from 1 April to 31 August.

Fig. 2. Relationship between: (a) the beginning of budburst and the mean daily temperature averaged over the period from 1 March to the event onset (Tb), (b) the beginning of flowering and the maximum daily temperature averaged over the period from 15 April to the event onset (Tf), (c) the beginning of veraison and the maximum daily temperature averaged over the period from 1 April to 30 June (Tv), (d) harvest date and the maximum daily temperature averaged over the period from 1 April to 31 August (Th) averaged across 20 cultivars for the region of Sremski Karlovci over the period 1986–2007. Lines represent best-fit linear regressions.
Table 8. Coefficient of determination (R2) and parameters of a linear regression between the onset of grapevine phenological stages and the most influential temperature variable during the most relevant period* for the region of Sremski Karlovci over the period 1986–2011

* These were: the beginning of budburst and the mean daily temperature averaged over the period from 1 March to the event onset, the beginning of flowering and the maximum daily temperature averaged over the period from 15 April to the event onset, the beginning of veraison and the maximum daily temperature averaged over the period from 1 April to 30 June, harvest date and the maximum daily temperature averaged over the period from 1 April to 31 August.
Of note, for the purpose of phenological prediction, there are some other periods during which phenology and temperature exhibited strong correlations, but which, in addition, offer the possibility of predicting the onset of phenological stages from approximately 10 days (dates of the beginning of budburst and flowering) to up to 2·5 months (harvest date) ahead. For the beginning of budburst, a useful variable for phenological prediction was the average March TM (r = –0·79, P < 0·001), for the beginning of flowering, TX averaged over the 30 days from 15 April (r = –0·88, P < 0·001), and for harvest, the average TX from April to June (r = –0·91, P < 0·001). The beginning of veraison can be predicted with best fit (average TX for the period April–June) c. 1 month ahead. The assessment of the monthly temperature impact on the onset dates identified the May TX as the most influential, followed by the June TX for the beginning of veraison and the May and August TX for harvest. The July temperature showed a very weak correlation with the date of the beginning of veraison and the least correlation with harvest date among calendar months in the period April–August.
DISCUSSION
The results of the present study show that the recent period in the region of Sremski Karlovci has been characterized by significant temperature increases. A similar rate of change in annual and growing season TM, TX and TN was observed, resulting in non-significant trends in the mean diurnal temperature range. This finding is not in agreement with the reported decreasing trend in the mean diurnal temperature range over most areas of the globe, driven by a greater increase in TN (Alexander et al. Reference Alexander, Zhang, Peterson, Caesar, Gleason, Klein Tank, Haylock, Collins, Trewin, Rahimzadeh, Tagipour, Rupa Kumar, Revadekar, Griffiths, Vincent, Stephenson, Burn, Aguilar, Brunet, Taylor, New, Zhai, Rusticucci and Vazquez-Aguirre2006). Evidence that TN has increased at higher rates than TX has been found by many other authors for different parts of the world (Jones Reference Jones2005 – Western USA; Heino et al. Reference Heino, Brázdil, Førland, Tuomenvirta, Alexandersson, Beniston, Pfister, Rebetez, Rosenhagen, Rösner and Wibig1999 – Finland; Brázdil et al. Reference Brázdil, Budíková, Auer, Böhm, Cegnar, Faško, Lapin, Gajič-Čapka, Zaninović, Koleva, Niedźwiedź, Ustrnul, Szalai and Weber1996 – Central and Southeast Europe). However, in some viticultural regions, TX had a greater increase than TN (costal California – Nemani et al. Reference Nemani, White, Cayan, Jones, Running, Coughlan and Peterson2001; Spain – Camps & Ramos Reference Camps and Ramos2012). It has been reported only rarely that, in the recent warming period, TN and TX have been increasing at the same rate, for instance by Brunet et al. (Reference Brunet, Jones, Sigró, Saladié, Aguilar, Moberg, Della-Marta, Lister, Walther and López2007) for the Iberian Peninsula since the last decades of the 20th century and by Vršič & Vodovnik (Reference Vršič and Vodovnik2012) for the Maribor station in Slovenia for the period 1980–2009. The determined trends of 0·06, 0·06 and 0·07 °C/year for annual TM, TN and TX, respectively, and the trend of 10·1 °C/year for GDD for Maribor, are in line with findings for Sremski Karlovci. On the other hand, Vučetić (Reference Vučetić2011) for Zagreb (Croatia) reported quite different temperature trend values with a much stronger contribution of minimum temperatures than maximum temperatures to recent warming. Unkašević et al. (Reference Unkašević, Vujović and Tošić2005), in an analysis of the summer trends in extreme temperatures for Belgrade, Serbia during the period 1975–2003, reported that more warming was observed in TX (0·14 °C/year) than in TN (0·10 °C/year). At Sremski Karlovci, TX was rising somewhat more than TN in the periods from the beginning of budburst to the beginning of flowering (0·11 v. 0·08 °C/year) and from the beginning of flowering to the beginning of veraison (0·11 v. 0·09 °C/year), while during ripening, the rate of rise in TN was double that of TX (0·06 v. 0·03 °C/year). All the above-mentioned findings confirm spatial heterogeneity of the recent warming pattern (IPCC-SREX Reference Field, Barros, Stocker, Qin, Dokken, Ebi, Mastrandrea, Mach, Plattner, Allen, Tignor and Midgley2012; IPCC Reference Stocker, Qin, Plattner, Tignor, Allen, Boschung, Nauels, Xia, Bex and Midgley2013).
Observed increasing trends of growing season temperatures and heat accumulation may affect the existing climate–cultivar balance in the region studied. According to Jones (Reference Jones2006), cultivar suitability has a window of 2–3 °C. Changes of this magnitude in the mean growing season temperature have the potential to cause large shifts in cultivar suitability, while changes of smaller magnitude can affect suitability of cultivars grown near the upper threshold of the optimum temperature range for quality wine production. The recorded increase in the frequency of heat-related extremes may have a negative effect on viticulture by inducing heat stress in the vine and affecting grape composition and quality. Even though higher temperatures initially improve ripening, resulting in better quality wine, in the long term they could lead to unbalanced ripening profiles (Duchêne & Schneider Reference Duchêne and Schneider2005). Temperatures higher than 30 °C can inhibit anthocyanin formation (Mori et al. Reference Mori, Goto-Yamamoto, Kitayama and Hashizume2007). So-called ‘negative’ temperatures for vine (TX > 35 °C) can severely damage vine leaves and grapes by increasing the incidence of Botrytis infections (Steel & Greer Reference Steel and Greer2008), and may cause partial or total inhibition of vine function, especially during dry periods (Laget et al. Reference Laget, Tondut, Deloire and Kelly2008). An increase in the occurrence of tropical nights can negatively affect the formation and ratio of grape components that give the colour, aroma and flavour characteristics (Kliewer & Torres Reference Kliewer and Torres1972). The cold-related indices displayed no significant trends, except for the number of days with TN < –2·5 °C. However, the declining number of these cold days was not observed during the spring, when such low temperatures can adversely affect growth and reduce bud fruitfulness.
Phenological analysis revealed general advancement of grapevine phenology, with the beginning of budburst being the only stage not displaying significantly earlier onset. Showing an integrated effect of a warmer growing season, detected trends were greatest for the beginning of veraison (from −0·5 to −0·9 days/year, depending on the cultivar) and harvest (from −0·4 to −1·1 days/year). Similar trends towards an earlier occurrence have been reported by Bock et al. (Reference Bock, Sparks, Estrella and Menzel2011) for three white grape cultivars (Müller-Thurgau, Riesling and Silvaner) in Lower Franconia, Germany, over the period 1949–2010. The advance in budburst was small and not significant, but the full flowering dates advanced 0·3–0·4 days/year, and veraison dates showed the strongest trend in time with advancement of 0·4–0·6 days/year, while harvest occurred 0·2–0·5 days earlier per year, depending on cultivar and location. Tomasi et al. (Reference Tomasi, Jones, Giust, Lovat and Gaiotti2011) reported for the Veneto Region in Italy that trends averaged over 18 cultivars were –0·3, –0·3 and –0·4 days/year for flowering, veraison and harvest, respectively, with no significant trend for budburst over the period 1946–2009. In contrast, in the productive area of Montepulciano wine in Italy, the budburst and flowering dates showed a negative trend, while the harvest date of the Sangiovese grapevine showed no significant changes during the period from 1970 to 2006 (Dalla Marta et al. Reference Dalla Marta, Grifoni, Mancini, Storchi, Zipoli and Orlandini2010). However, observations from diverse viticultural regions have mostly revealed the advancement of harvest dates, including those in France (Alsace – Duchêne & Schneider Reference Duchêne and Schneider2005; Bordeaux – Jones & Davis Reference Jones and Davis2000; Burgundy – Madelin et al. Reference Madelin, Chabin and Bonnefoy2008), Spain (Camps & Ramos Reference Camps and Ramos2012), Slovenia (Vršič & Vodovnik Reference Vršič and Vodovnik2012), Poland (Lisek Reference Lisek2008) and Australia (Webb et al. Reference Webb, Whetton and Barlow2011).
Tomasi et al. (Reference Tomasi, Jones, Giust, Lovat and Gaiotti2011) noted that the absence of a grapevine budburst temporal trend in their study was probably related to previous vintage, post-harvest and dormancy factors, such as starch levels in the roots, fulfilment of chilling requirements, etc. Jones & Davis (Reference Jones and Davis2000) commented that the lack of inter-phenological correlation with budburst in the dataset for Bordeaux, France, might signify that temperature extremes had little impact on early-season growth. Absence of a significant trend of budburst dates and no inter-relationship with veraison and harvest date in the present study may be explained solely by the non-significant temporal change in temperature in the period preceding budburst. The correlations between the beginning of budburst date and the temperature variables in the preceding period were strong and significant, and therefore it cannot be concluded from study results that spring temperatures do not affect budburst considerably.
The current results revealed that in the viticultural region of Sremski Karlovci, among the cultivars examined and on average for all phenological stages, Cabernet Sauvignon showed the smallest phenology advancement and Pinot Noir the greatest. It should be noted that, in the region of Sremski Karlovci with a growing season average temperature of 17·8 °C, Pinot Noir is growing outside its suitability window, in contrast to Cabernet Sauvignon, which is growing in the middle of its optimal growing season temperature range. According to Jones (Reference Jones2006), Cabernet Sauvignon has a growing season average temperature range of c. 3·5 °C (16·8–20·2 °C), nearly double that of Pinot Noir (14·0–16·0 °C). On the other hand, Pinot Gris, having lower optimal temperature range (13·0–15·2 °C) than Pinot Noir, showed smaller phenology advancement than Pinot Noir in the region studied. Nevertheless, Cabernet Sauvignon, one of the most widely recognized wine grapes in the world, seems to be a distinctive cultivar regarding its phenological response to temperature stimuli. Webb et al. (Reference Webb, Whetton and Barlow2011), in their study of historical trends in grapevine ripening dates from diverse viticultural regions in Australia, found that Cabernet Sauvignon was the only cultivar showing a trend to later ripening at one site, though the trend was not statistically significant. Examining climate influences on grapevine phenology of the two main cultivars grown in the Bordeaux region, Jones & Davis (Reference Jones and Davis2000) found that Cabernet Sauvignon was less phenologically and climatologically sensitive than Merlot, as it was in the present study.
Unlike most other studies conducted on grapevine (Jones & Davis Reference Jones and Davis2000; Duchêne & Schneider Reference Duchêne and Schneider2005; Jones et al. Reference Jones, Duchene, Tomasi, Yuste, Braslavska, Schultz, Martinez, Boso, Langellier, Perruchot, Guimberteau and Schultz2005b; Bock et al. Reference Bock, Sparks, Estrella and Menzel2011; Tomasi et al. Reference Tomasi, Jones, Giust, Lovat and Gaiotti2011), no significant shortening of growth intervals and growing season was detected in the present study. The interdependency of onset of each phenological stage, with each event being highly correlated with the preceding one, may explain the relatively constant duration of growth intervals at the study site. The only interval showing a significant decreasing trend for most of the examined cultivars was the period from the beginning of flowering to the beginning of veraison, which is concurrent with the largest and most significant changes of temperature indices during this developmental period. Interestingly, Tomasi et al. (Reference Tomasi, Jones, Giust, Lovat and Gaiotti2011) reported that the growth intervals from bloom to veraison and bloom to harvest – i.e. the growth periods that exhibited significant shortening in the present study (at least for some cultivars) – did not change significantly for the Veneto Region over the period from 1964 to 2009. On the other hand, growth intervals that did not show any significant changes in the present study did display significant changes in the Tomasi et al. (Reference Tomasi, Jones, Giust, Lovat and Gaiotti2011) study.
Understanding the drivers of phenological events is crucial for predicting a plant's response to climate change. The advantage of considering data from a single vineyard is that variations in some factors other than climate, such as viticultural practices, average age of the vines, etc., are excluded. The present study results revealed that most of the variation in grapevine phenology (74–90%) could be explained by temperature changes. Mean and maximum temperatures generally displayed stronger relationships with grapevine phenology than minimum temperatures. The beginning of budburst and flowering date were correlated significantly with temperature during the period immediately prior to the event (40–45 days on average). In contrast, the beginning of veraison and harvest were not significantly responsive to temperature occurring a few weeks prior to the occurrence of phenological events. Even though July was one of 2 months that exhibited the greatest and most significant temporal trends in temperature, it was not a temperature variable that strongly correlated with veraison and harvest date.
The determined phenological sensitivities (from 3 to 7 days per 1 °C of warming, depending on phenological stage) are in agreement with results of similar studies, but the strength of the relationship between phenology and temperature was outstanding in the present study, with R 2 ranging from 0·71 for the beginning of budburst to 0·90 for the beginning of veraison and harvest. Tomasi et al. (Reference Tomasi, Jones, Giust, Lovat and Gaiotti2011) reported for the Veneto Region in Italy that the shift in phenological event dates per 1 °C change of the most influential temperature variable were 2·9, 4·1, 3·2 and 8·0 days, with corresponding R 2 of 0·45, 0·77, 0·29 and 0·39 for budburst, flowering, veraison and harvest, respectively. In a study of changes in European wine grape phenology and relationships with climate (Jones et al. Reference Jones, Duchene, Tomasi, Yuste, Braslavska, Schultz, Martinez, Boso, Langellier, Perruchot, Guimberteau and Schultz2005b), phenology showed a 3–6 day response per 1 °C of warming averaged over all locations and cultivars over the last 30–50 years, with r from –0·4 to –0·8 between grapevine phenology and climate parameters.
In a detailed analysis of grapevine phenology for the region of Sremski Karlovci (Ruml et al. Reference Ruml, Korać, Ivanišević, Vujadinović and Vuković2013), a greater variation in onset of phenological stage and length of growth periods was found between years for a single cultivar than among cultivars within individual years, suggesting that climatic factors had a stronger influence on phenological dynamics than genetic characteristics of cultivars. However, in climatologically extreme years, the difference in phenological timing among cultivars was considerable. The diversity exhibited among cultivars in their sensitivity to climatic variables may offer adaptation options to climate change. Species with a high plasticity level, according to Schlichting (Reference Schlichting1986), are those for which the meteorological conditions may induce higher phenological adjustments in comparison to those caused by the internal biorhythms dictated by the long-term repetitive climatic and astronomical cycles. Among the cultivars studied and on average for all examined phenological stages, Riesling Italian, followed by the autochthonous cultivar Beli Medenac, exhibited the smallest phenological sensitivity, while Pinot Noir, followed by Limberger, displayed the greatest phenological response per 1 °C of warming. As already mentioned, according to Cleland et al. (Reference Cleland, Allen, Crimmins, Dunne, Pau, Travers, Zavaleta and Wolkovich2012) those cultivars capable of phenologically tracking temperature changes might be at lesser risk from future climate change.
The current research is the first national study of the phenological response of different wine grape cultivars to temperature change and variability. The results suggest that the observed trends of earlier onset of phenological events over the last few decades in the region of Sremski Karlovci resulted from increasing temperature and that impacts of temperature changes were not uniform across cultivars. The detected temperature and phenological trends have shown that ripening is tending to occur under warmer conditions in the first place because of earlier flowering and veraison, not because of considerably higher temperatures in the period from veraison to harvest or because of the shortening of the ripening phase. Future research should investigate how changes in climate and phenology affect the yield and quality characteristics of wine grapes such as sugar concentration, acidity, and aromatic and phenolic profiles in the studied region. High correlations between phenology and temperature data, as well as between dates of phenological stage onset, indicate that it is feasible to build empirical phenological models capable of predicting the onset of phenological stages early enough to be useful for planning viticultural activities.
According to climate projections for Serbia (Ruml et al. Reference Ruml, Vuković, Vujadinović, Djurdjević, Rankovic-Vasić, Atanacković, Sivčev, Marković, Matijašević and Petrović2012b), the rising trends of temperature and frequency of heat-related extremes are likely to continue and become even stronger, which may result in further advancement of phenological events, affecting grapevine growing and wine production. Possible consequences may include shifts in regional cultivar suitability, changes in wine styles or the necessity of costly adaptation measures to preserve the regional typicity of wines. In addition, higher temperatures lead to greater susceptibility of grapevine to pests and pathogens and higher evapotranspiration rates. The higher evaporation rates in conjunction with the projected decrease in rainfall (Ruml et al. Reference Ruml, Vuković, Vujadinović, Djurdjević, Rankovic-Vasić, Atanacković, Sivčev, Marković, Matijašević and Petrović2012b) would lead to soil moisture reduction and higher probability of water stress.
Besides having national significance, the present study contributes to the general knowledge on climate and grapevine phenological relationships and differences in the impacts of global warming on grape phenology in existing wine-producing regions. The results obtained may find application in crop modelling, vineyard management and assessment of present and future suitability of wine grape cultivars in the studied region, as well as in other vineyard regions with similar climatic conditions but with no long-term phenological data available.
The paper was part of the project ‘Studying climate change and its influence on the environment: impacts, adaptation and mitigation’ (no. 43007) financed by the Ministry of Education and Science of the Republic of Serbia within the framework of integrated and interdisciplinary research for the period 2011–2014.


