Introduction
The energy balance of continuous snow cover (Reference Male, Gray, Gray and MaleMale and Gray, 1981) and the energy available from net radiation and the vertical turbulent exchange of energy are well known. The relative importance of each of these terms is highly variable, as illustrated by the summary of typical ranges in various environments provided by Reference KuusistoKuusisto (1986). In areas or years where melt occurs before the “high sun” period of April or May. shortwave radiation inputs are relatively small and the sensible heat flux (QH) dominates the surface energy balance. Even when net radiation is strongly positive, the contribution of sensible heat is required to initiate large-scale melting. Reference Male and GrangerMale and Granger (1981) showed that for snowpacks that are at low elevations and are shallow the “rate of inch is largely dependent on the energy content of the air mass present”. Reference Male and GrangerMale and Granger (1981) also noted that Reference SverdrupSverdrup (1936) classified the magnitude of sensible and latent heat turbulent fluxes by general weather conditions, but that since that time the impact of “energy and moisture contents of the air-mass properties have been generally overlooked”.
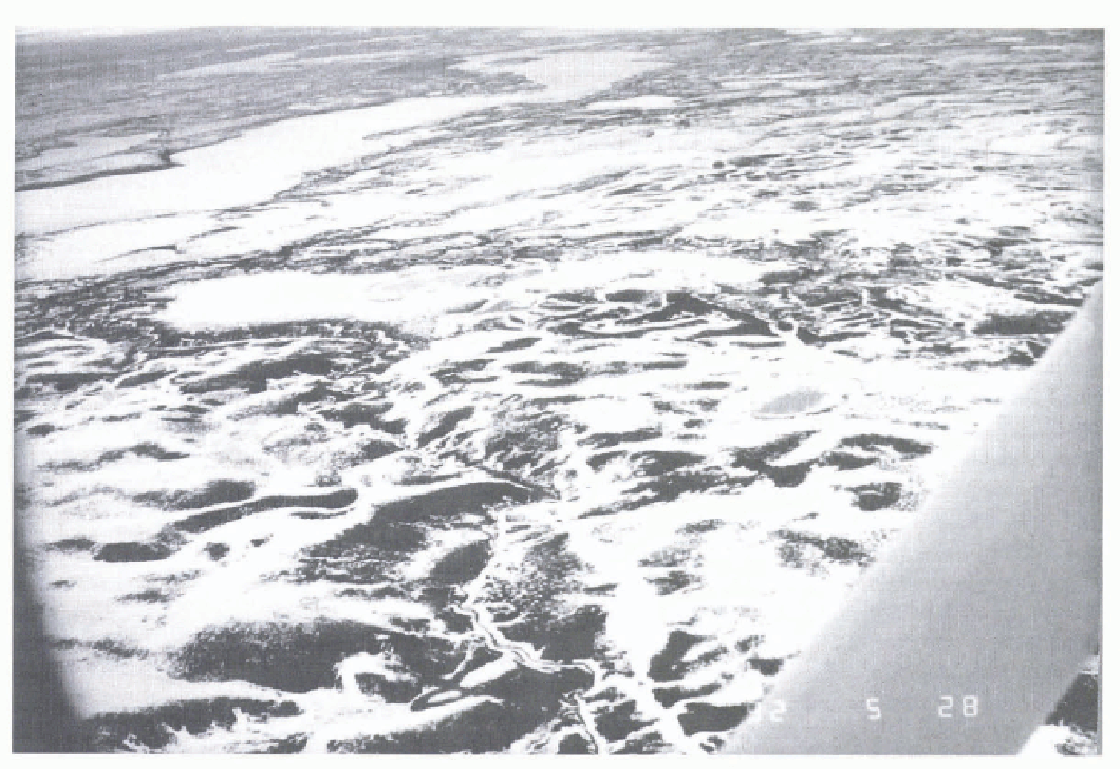
In many shallow-snow environments (i.e. the prairies and the Arctic tundra) the surface snow-cover distribution at the end of winter is highly variable (Reference Woo, Heron, Marsh and SteerWoo and others, 1983; Reference Pomeroy and GrayPomeroy and Gray, 1995) and as melt begins, the areas with the shallowest snow cover become snow free (Reference Shook and CrayShook and Gray, 1994). The result is a surface with a complex distribution of snowpatches with intervening snow-free areas (Fig. 1). In this situation, the surface energy balance is complicated by the local advection of sensible heat from the snow-free areas to the snowpatches (QA) (Reference ShookShook, 1995; Reference ListonListon, 1995). This results in spatially variable inch, with null enhanced at the upwind edges of snow patches.

Fig. 1. An example of the patchy snow cover typical of the melt period in Arctic tundra regions. Trail Valley Creek, 28 May 1992
Since the distribution of air temperature, and therefore sensible heat flux to the snow surface, is spatially variable, it is difficult to use measurement of air-temperature gradients in the lower few metres of the atmosphere to estimate average sensible heat the by flux-gradient relationships and therefore to average snowmelt over the patchy snow surface. This problem arises from the fact that steady-state, fully developed boundary layers do not exist near the surface, and so air temperature and sensible heat flux at any given point are dependent on the distribution of snow and snow-free patches in an upwind source area. The spatial patterns of these surfaces are constantly changing due to ongoing melt, and the size and orientation of the source area are dependent on wind direction and speed. Reference Marsh and PomeroyMarsh and Pomeroy (1996) suggested that the average melt could be determined from estimates of energy fluxes for the melt of a large snow-patch that is unaffected by local advection (QHL) and by an estimate of local advection. This local advection term could be estimated from a knowledge of the sensible heat flux from the snow-free areas (QHB), the snow-covered area, and FS , a function expressing the portion of the bare-area snsible heat flux (QHB) that is advected to snowpatches.
To date, changes in QHL and FS have not been documented during the melt of a patchy snow cover. One potential method to estimate QHL is based on the work of Reference Male and GrangerMale and Granger (1981), who illustrated the impact of local advection by comparing sensible heat flux to upper-air temperatures. They found that the sensible heat flux for patchy snow cover was considerably larger than that for a continuous snow cover, even though the air-mass characteristics as indicated by the 850 mb air temperature were similar. The increase in sensible heat must therefore be due to local advection.
The purpose of this paper is to carry out an initial investigation of the relationship between upper-air temperature and sensible heat flux to the snow cover at a tundra site, in order to estimate the role of local advection in the melt of patchy snow covers.
Study Area and Methodology
During the spring of 1993, held studies were carried out at Trail Valley Creek (68°45’N, 133°30’W), located approximately 55 km north-northeast of Inuvik, Northwest Territories (N.W.T.) in the forest-tundra transition.Trail Valley Creek is approximately 63 km3 in area, with elevations ranging from 60 to 190 m a.s.l. The climate is characterized by short, cool summers, long, cold winters, and low precipitation, much of which occurs as snow. Landscape classes were mapped for the Trail Valley Creek area, and are described by Reference Marsh and PomeroyMarsh and Pomeroy (1996). The landscape in this area comprises lakes (<1%), tundra (70%), shrub tundra (21%), forest (<1%), and steep slopes, channel systems, and lake edges that accumulate deep snowdrifts (8%).
Sensible heat flux over snow cover was estimated using the bulk-aerodynamic method (Reference Dunne, Price and ColbeckDunne and others, 1976). Details are provided in Reference Marsh and PomeroyMarsh and Pomeroy (1996). During the period of patchy snow cover, estimates of sensible heat flux are undoubtedly enhanced by local advection. Following standard practice in the snow research community, sensible heat flux is considered to be positive when the flux is directed towards the snow surface. Changes in snowcovered area during the melt period were obtained from aerial photographs (Reference Marsh and PomeroyMarsh and Pomeroy, 1996).
Upper-air temperature for the 850mb level (approximately 1400m a.s.l.), were obtained from the Atmospheric Environmental Service (Canada) (AES) weatherstation located near Inuvik airport, approximately 55 km from the Trail Valley Creek research site. These measurements are taken twice daily at 00.00 and 00.12 h U.T.
Results
Comparison of near-surface and upper-air temperatures
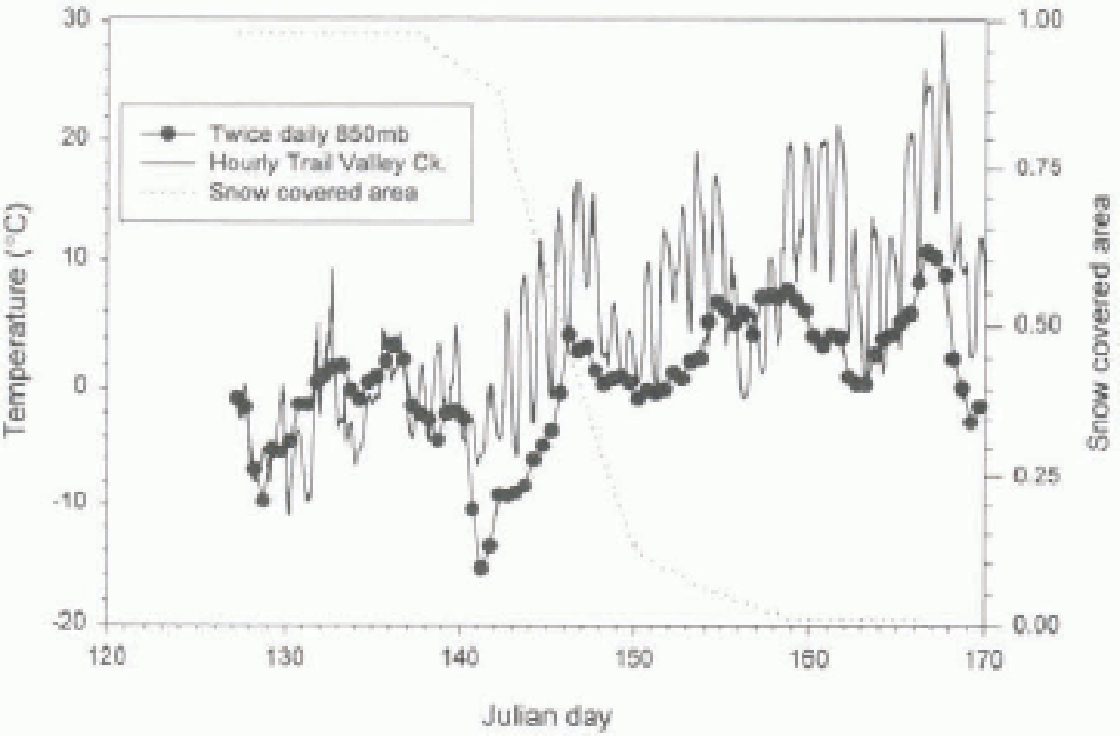
Figure 2 shows the 850 mb air temperature from the Inuvik upper-air station and the air temperature at approximately 1m above the snow surface at Trail Valley Creek. Also shown is the change in snow-covered area over the 1993 melt period. Up to Julian Day (JD) 138, the research site was nearly completely snow covered. During this period, the 850mb air temperature and the near-surface air temperature were very similar (Fig. 2). A major difference between the two records is the occurrence of large diurnal variations in near-surface temperature. As the snow cover decreased in area after JD 138, the similarity between temperature declined, with the near-surface air temperature consistently higher than the upper-air temperature (Fig. 2).

Fig. 2. Comparison of Trail Valley Creek air temperatures at approximately 1m level, and from the Inuvik Upper Air Station at the 850 mb level. Also shown is the change in snow cover in the Trail Valley Creek area.
The two temperature records diverged markedly after JD 140, when the 850mb temperature decreased significantly, but the near-surface temperature did not. This change in the relationship between near-surface and 850mb air temperature is likely to be related to changes in the local source of energy to the lower- atmosphere. As the snow-surface temperature remains no higher than 0°C during the snowmelt period, the sensible heal flux is always downward from the air (warmer than 0°C). Hence, sensible heat flux over the snow-covered area cannot explain the Sustained warming of the near-surface air temperature whilst the upper air cooled. The source of energy for warming the near-surface layer of air is therefore presumed to be advection of the sensible heat flux from snow-free areas. Snow-free zones sustained surface temperatures higher than the air temperature, and developed a sensible heal flux capable of warming the near-surface layer of air. Other sources of energy to warm the near-surface air include vegetation canopies over snow surfaces/These areas include nearby forest patches and shrub areas. In addition, there may be mesoceale advection of sensible heat from forested areas to the south and west. The closest treed areas are about 40 km to the south and 25 km to the west on the Mackenzie Delta. The relative importance of these more remote sources of energy is unknown, but it is felt that the local source of energy from the snow-free patches dominates.
comparison of upper-air temperature and snow sensible heat flux
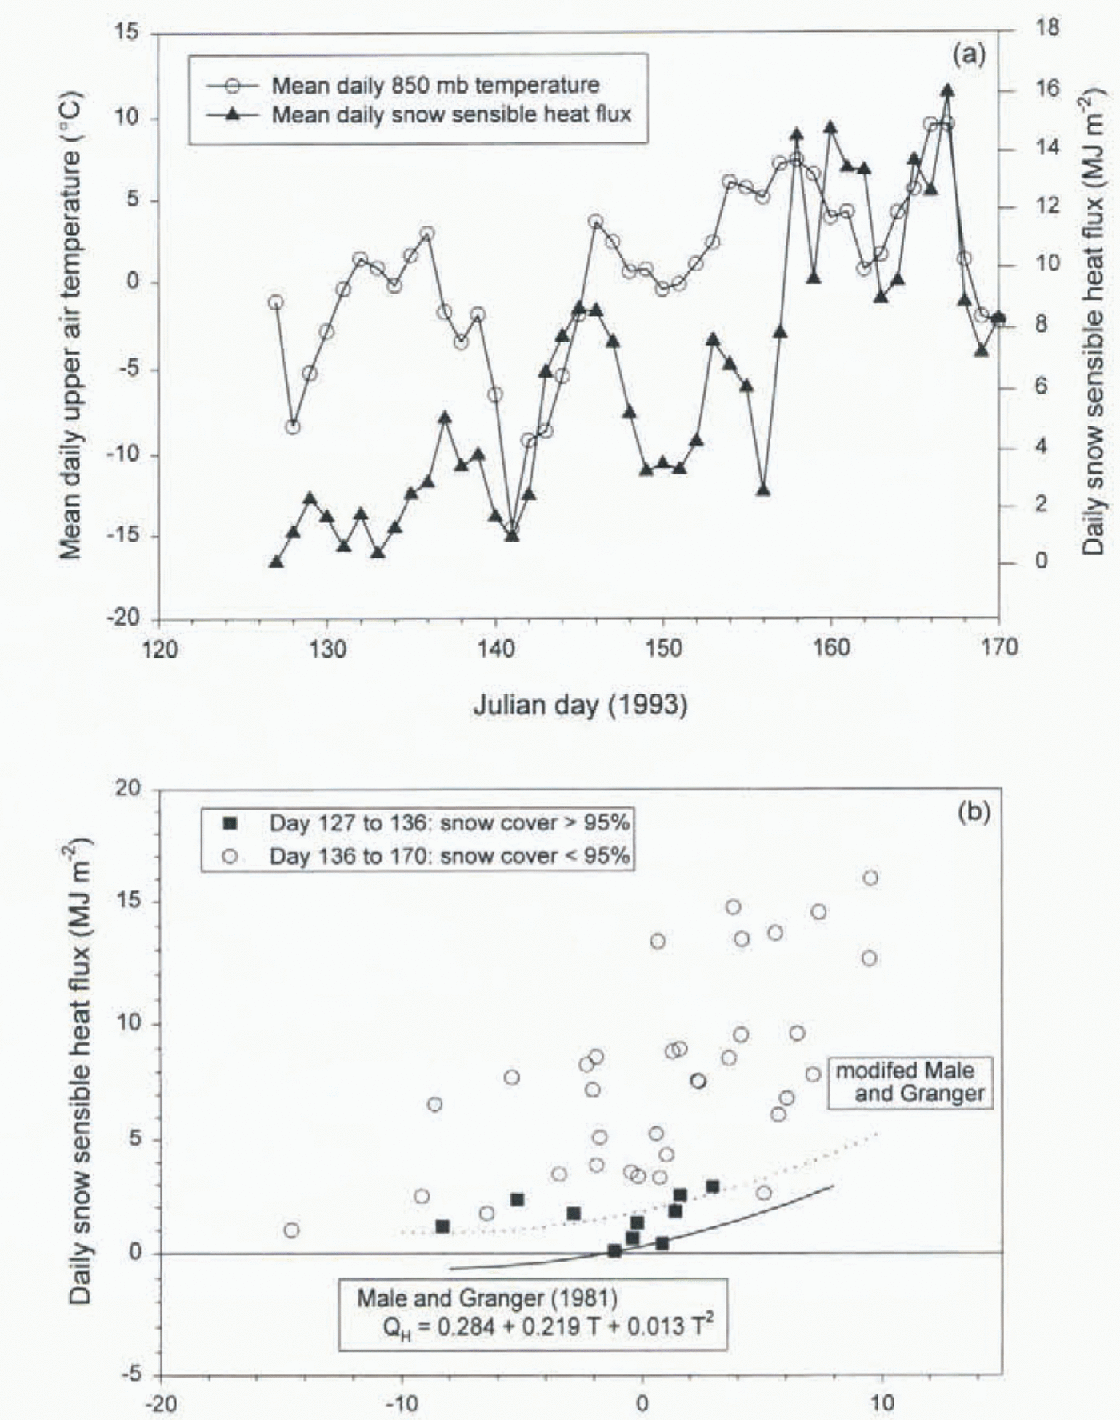
Figure 3a shows the time series for both the sensible heat flux to the snowpatches as described by Reference Marsh and PomeroyMarsh and Pomeroy (1996) for the 1993 study period, and the 850 mb air temperature. During the period when snow cover was >95% (up to JD 136), the calculated sensible heat flux was always low in value (Fig. 3a), and was only slightly higher than that estimaled by Reference Male and GrangerMale and Granger (1981) for similar 850 mb air temperatures in the Canadian Prairies as shown by the solid curve in Figure 3b. Since the relationship shown in the work of Reference Male and GrangerMale and Ganger (1981) is empirical, and the Trail Valley Creek Terrain is more rugged than Saskatchewan prairie with a resulting increase in turbulence, the larger sensible heat flux for the same upper-air temperature at Trail Valley Creek compared to the Prairies is not unexpected. Also shown on Figure 3b is a modified version of the Reference Male and GrangerMale and Granger (1981) equation. This equation has the same shape as that devised by Male and Granger, but predicts slightly higher sensible heat flux for a given 850mb temperature, thereby providing a better fit to the measured data for the Inuvik area.

Fig. 3. (a) Comparison of the mean daily 850 mb an temperature and the daily sensible heat flux for snow-covered surface at Trail Valley Creek. Sensible heat flux was calculated using the bulk-aerodynamic method (Reference Marsh and PomeroyMarsh and Pomeroy, 1996). (b) Relationship between mean daily Inunik 850mb temperature and snow-surface sensible heat flux for Trail Valley Creek.
After the snow cover began to decrease in area, the calculated sensible heat flux began to increase (Fig. 3a), and when plotted against mean daily 850mb air temperature (open circles on Fig. 3b) the sensible flux was consistently higher than for similar 850 mb temperatures during the period with a snow cover >95%. Drawing on the evidence provided by Reference Male and GrangerMale and Granger (1981), it seems likely that the higher sensible heat fluxes during the period with patchy snow cover are due to the local advection of sensible heat from the bare patches.
Relationship between snow-free sensible heat and local advection to the snow
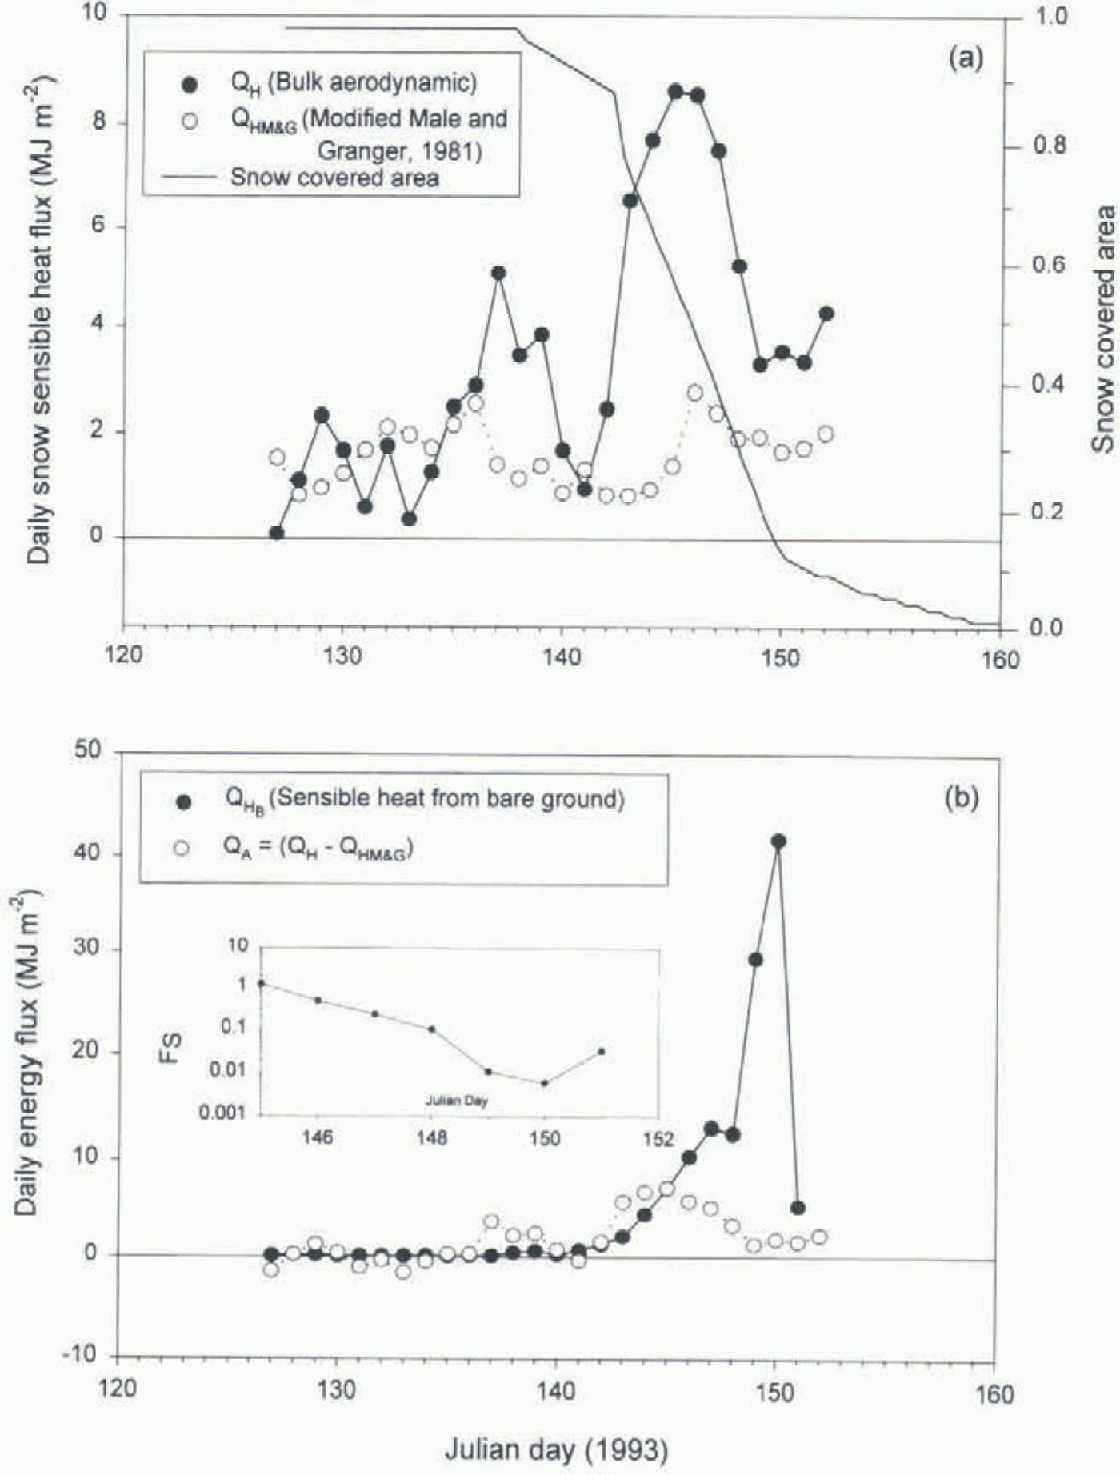
Figure 4a shows The sensible heat flux to the snowpatches as calculated by Reference Marsh and PomeroyMarsh and Pomeroy (1996) and as calculated using the modified empirical relationship between sensible heat and 850mb air temperature as determined by Reference Male and GrangerMale and Granger (1981). For the first part of the study period, the sensible heat flux estimated by both methods is similar. However, as the snow-free area begins to increase, the sensible heat flux from the bulk-aerodynamic method begins to increase dramatically. It is hypothesized that the difference between these fluxes is due to local advection with the magnitude of The local advection calculated by:
where QA is local advection, QH is the sensible heat to the snow as calculated by Reference Marsh and PomeroyMarsh and Pomeroy (1996) using the bulk-aerodynamic method, and QHM and G is the sensible heat flux to a large snowpatch that is not affected by local advection as estimated from the modified Reference Male and GrangerMale and Gran¬ger (1981) equation. As Figure 4b shows, QA is similar in magnitude to the sensible heat flux from the snow-free areas calculated by Reference Marsh and PomeroyMarsh and Pomeroy (1996) up to JD 145. After this time, the sensible heat flux from the snow-free areas increases dramatically.

Fig. 4. (a) Comparison of the snow-surface sensible heat flux calculated from the bulk-aerodynamic method (Reference Marsh and PomeroyMarsh and Pomeroy, 1996) and using the modified relationship between 850 mb air temperature and sensible heat flux. (b)Comparison of the sensible heat flux from the snow-free areas as determined by Reference Marsh and PomeroyMarsh and Pomeroy (1996) and the calculated QA (Equation (1)). The insert shows the calculated FS.
As suggested by Reference Marsh and PomeroyMarsh and Pomeroy (1996), the sensible heat from bare patches is used to warm the lower layers of the atmosphere, and a portion of this energy is adverted laterally to the snow patches, resulting in increased melt along the upwind edges of the snow-patches. The portion of this energy that is used to melt the snow cover is related to the size and distribution of the snowpatches. It would be expected that all the adverted energy is used to enhance melt early in the melt period, and only a small portion of the energy enhances melt later in the melt period. Reference Marsh and PomeroyMarsh and Pomeroy 1996 suggested that a portion of the snow-free areas sensible heat flux, which is adverted (per unit snow-covered area) to the snowpatches (QA) may be estimated as:

where PB and Ps represent the snow-free and snow-covered fractions of the basin, respectively, QHB the sensible heat flux from those parts of the basin that are snow free, and Fs is a function expressing the portion of the bare area (QHB ) that is adverted to the snowpatches. Assuming no mesoscale advection, Ps would have a value between 0 and 1, depending on the relative portion of bare VS snow-covered area, wind speed, terrain roughness, upwind bare fetch length, and the perimeter-to-area ratio of snowpatches.
Given the data on QH , QHB , PS and QA given in Figure 4, PS may be calculated by rearranging Equation (2). The results shown in Figure 1 indicate that Fs decreases in time after JD 145 (the date when advection from sensible heat from bare ground and the estimate of local advection from aerodynamic method diverge). From JD 145 (snow-covered area = 60% PS declines from 1. This is the point of maximum snow inch rale and. as the Fs = 1 and The snow-free area is large, is the maximum “efficiency” in The regional energetics of snowmelt. From JD 146 to 149. the value of Ps continues to decrease from 0.48 to 0.01. This implies that the portion of the adverted energy that is used to enhance melt decreases dramatically as the basin snow-covered area declines from 50 to 20%.
Conclusions
The relative importance of large-scale VS small-scale advection in driving the sensible heat flux during snow melt in The low Arctic has been established. In the phases of pre-melt and early-melt, the near-surface and 850 mb boundary-layer temperatures are well coupled, and the small sensible heat flux is driven by large or mesoscale advection of energy, imported by air masses to the Arctic region. This sensible heat can be linked to upper-air temperatures following a regional modification of an empirical scheme proposed for the prairie environment by Reference Male and GrangerMale and Granger (1981). As the snow-covered area declines below 95%, air temperatures near the surface and at the 850 mb level become decoupled as the near-surface boundary layer becomes in in-steady due to the heterogeneous snow surface. the emperical sensible heat flux for these conditions exceeds that estimated due to advection of large-scale air masses.
Low albedo snow-free surfaces, heated by high net radiation inputs, provide a large near-surface energy source that drives the sensible heat flux over remaining snowpatches. All this energy is adverted to the snowpatches until the snow-covered area declines below 60%. There is a rapid decline in the proportion of available energy from bare ground adverted to snow from about 50% advection at 50% snow cover, down to 1 % at 10% snow cover. Though sensible heat is still large and driven by advection, the extremely large snow-free surface provides most of its available energy for heating the atmosphere, but very little to melting snow. The results provide an initial understanding necessary to coupling small-scale energy balance snowmelt models with larger-scale atmospheric models, and can form the basis for scaling techniques to link global climate models to land-surface process models for snow.
Acknowledgements
This work was supported by the National Hydrology Research Institute, the Canadian GEWEX Programme, the Polar Continental Shelf Project, the Science Institute of the Northwest Territories, and Indian and Northern Affairs Canada. We would like to thank C. Onclin, A. Dalton, K. Dion, J. Onclin, B. Quinton, K. Shook and R. Reid for their help in the field and with data reduction.


