


Non-technical Summary
Recognized since the nineteenth century, the Mazon Creek (pronounced “muh-ZAHN”) fossil sites in northeastern Illinois have become some of the most well-known and well-collected exceptional fossil deposits in North America. Their popularity with avocational fossil hounds and research paleontologists alike grew substantially after the 1940s, when strip-mining practices began uncovering the Colchester Coal, leaving abundant fossil-bearing siderite concretions in their spoil piles. And they became even more popular with discoveries of enigmatic icons of evolution like the Tully Monster (Tullimonstrum gregarium Richardson, Reference Richardson1966). The work by Gordon Baird and colleagues in the 1980s provided an extensive understanding of these sites, their preservation, and their paleoecology—which they suggested to represent deposition along a muddy Carboniferous-aged coastline, capturing a distinct delta-to-offshore transition in biotic assemblage composition. Sites containing the more terrestrially influenced Braidwood assemblage hosted abundant plants, washed-out terrestrial arthropods, and freshwater organisms, while the Essex assemblage was characterized by marine bivalves, abundant Essexella cnidarians, and other unequivocally marine taxa. While the distinctness of these two assemblages was recently challenged, we provide here an assessment of nearly 300,000 concretions and illustrate that there are instead three discrete biotic assemblages—the nearshore Braidwood assemblage and two marine Essex assemblages represented by more abundant benthic taxa–like worms and bivalves versus cnidarian-dominated localities—an idea that Baird and colleagues had postulated in an early paleoecological summary four decades ago.
Introduction
The Mazon Creek Lagerstätte (~310 Ma; Moscovian Stage, late Carboniferous Period; pronounced “muh-ZAHN”; Brandt Reference Brandt2025) is arguably one of the most well-known American fossil deposits, yielding nearly 800 species of crustaceans, insects, cnidarians, plants, and other organisms (Baird Reference Baird and Nitecki1979; Baird et al. Reference Baird, Shabica, Anderson and Richardson1985a; Wittry Reference Wittry2012, Reference Wittry2020; Clements et al. Reference Clements, Purnell and Gabbott2019). With fossils hosted within siderite (FeCO3) concretions of the Francis Creek Shale, the Mazon Creek Lagerstätte is not a singular locality, but instead occurs in more than 270 known localities spanning numerous counties of northeastern Illinois, representing an ancient equatorial delta–sourced clastic wedge (Baird et al. Reference Baird, Sroka, Shabica and Kuecher1986; Baird Reference Baird, Shabica and Hay1997). Various taxa, such as the putative hydroid Drevotella; diverse phyllodocid polychaetes, including Homaphrodite, Rutellifrons, and Esconites; and of course the enigmatic, charismatic, and recently intensely debated “Tully Monster,” Tullimonstrum gregarium Richardson, Reference Richardson1966 (e.g., Clements et al. Reference Clements, Dolocan, Martin, Purnell, Vinther and Gabbott2016; McCoy et al. Reference McCoy, Saupe, Lamsdell, Tarhan, McMahon, Lidgard and Mayer2016; Sallan et al. Reference Sallan, Giles, Sansom, Clarke, Johanson, Sansom and Janvier2017; Rogers et al. Reference Rogers, Astrop, Webb, Ito, Wakamatsu and McNamara2019; McCoy et al. Reference McCoy, Wiemann, Lamsdell, Whalen, Lidgard, Mayer, Petermann and Briggs2020; Wiemann and Briggs Reference Wiemann and Briggs2022; Mikami et al. Reference Mikami, Ikeda, Muramiya, Hirasawa and Iwasaki2023), are unique and only found in the Francis Creek Shale in the states of Illinois and Missouri (Briggs and Gall Reference Briggs and Gall1990). Other broadly contemporaneous fossiliferous deposits, such as the Hamilton Quarry in Kansas and the Kinney Brick Company Quarry in New Mexico, were also deposited in estuarine to prodeltaic environments of the latest Carboniferous (~300 Ma; Feldman et al. Reference Feldman, Archer, Kvale, Cunningham, Maples and West1993), but their fossils are not hosted in siderite concretions. While these others may be similar in age and depositional paleoenvironment, the Mazon Creek stands out as the most diverse, species-rich, and both heavily collected and studied, with new reports continuing to be published (e.g., Dvořák et al. Reference Dvořák, Krzemiński and Prokop2023; Selden and Dunlop Reference Selden and Dunlop2024) well after the former mining operations have been closed or flooded. In short, the Mazon Creek Lagerstätte has offered no shortage of paleontological information.
The Mazon Creek fossils have been recognized since the nineteenth century (Nitecki Reference Nitecki and Nitecki1979), but their plenitude and diversity did not become fully apparent until strip mining of the area to expose the Colchester Coal began in the 1940s. The Francis Creek Shale hosts the fossil-bearing siderite concretions and was removed as Colchester Coal overburden during the mining process, leaving numerous localized shaft mine spoil piles and large strip mine areas of similar dumped overburden rich in concretions to become prime targets for fossil hunting by both avocational and professional paleontologists. The work by Baird and colleagues in the mid-1970s through mid-1980s (Reference Baird, Shabica, Anderson and Richardson1985a,Reference Baird, Sroka, Shabica and Beardb, Reference Baird, Sroka, Shabica and Kuecher1986) to characterize this deposit was foundational for our understanding of the Lagerstätte and set the stage for future paleontological work to build upon. Baird et al. (Reference Baird, Shabica, Anderson and Richardson1985a,Reference Baird, Sroka, Shabica and Beardb) argued that the Mazon Creek Lagerstätte was exceptional not only for its concretionary style of preservation and broad range of late Carboniferous taxa but also because two distinct biotic assemblages could be observed, varying by location of collection.
In terms of their taphonomy, high sedimentation rates and rapid burial were key components leading to the exceptional preservation of the Mazon Creek Lagerstätte, evidenced by features such as tidal laminations (Kuecher et al. Reference Kuecher, Woodland and Broadhurst1990; Feldman et al. Reference Feldman, Archer, Kvale, Cunningham, Maples and West1993; Archer and Feldman Reference Archer and Feldman1994; Baird Reference Baird, Shabica and Hay1997), escape burrows (Baird et al. Reference Baird, Sroka, Shabica and Kuecher1986; Baird, Reference Baird, Shabica and Hay1997), and apparent death by smothering (Baird et al. Reference Baird, Sroka, Shabica and Kuecher1986; Baird Reference Baird, Shabica and Hay1997). Lamination thicknesses in the Francis Creek Shale have been interpreted to suggest a sedimentation rate of up to a maximum of 1 m/year, which was likely influenced by the creation of accommodation space due to compression of the peat layer in the underlying Colchester Coal (Feldman et al. Reference Feldman, Archer, Kvale, Cunningham, Maples and West1993). This rate of burial, combined with the exhaustion of oxygen due to high influxes of organic matter, presumably created low-oxygen to anoxic environments inhospitable to scavengers (Baird et al. Reference Baird, Sroka, Shabica and Kuecher1986; Clements et al. Reference Clements, Purnell and Gabbott2019; see also Bailey Reference Bailey2011). Under these conditions, anaerobic microbial decomposers and autolytic processes would have taken over the degradation of organics. While anaerobic decomposition does not necessarily slow the degradation of soft tissues (Allison Reference Allison1988), these metabolic processes are often invoked as providing key building blocks for the precipitation of minerals that encase, replace, or replicate organisms and their tissues, leading to their preservation as fossils (Woodland and Stenstrom Reference Woodland, Stenstrom and Nitecki1979; Baird et al. Reference Baird, Sroka, Shabica and Kuecher1986; Schiffbauer et al. Reference Schiffbauer, Xiao, Cai, Wallace, Hua, Hunter, Xu, Peng and Kaufman2014; Cotroneo et al. Reference Cotroneo, Schiffbauer, McCoy, Wortmann, Durroch, Peng and Laflamme2016; Locatelli et al. Reference Locatelli, Krajewski, Chochinov and Laflamme2016; Muscente et al. Reference Muscente, Schiffbauer, Broce, Laflamme, O’Donnell, Boag and Meyer2017; Clements et al. Reference Clements, Purnell and Gabbott2019).
The two distinct paleoecological assemblages—originally defined as the Braidwood- and Essex-types and named for nearby towns (Johnson and Richardson Reference Johnson and Richardson1966)—correspond to a regional paleoenvironmental shift from nonmarine to fully marine biomes following a delta-plain to prodelta transect from the modern-day northeast to the south and west. The inferred habitats of the preserved taxa and the community structures of each individual sampling locality (Shabica Reference Shabica, Smith, Nance, Hopkins, Johnson and Shabica1970, Reference Shabica and Nitecki1979; Richardson and Johnson Reference Richardson and Johnson1971) were thus interpreted to record deposition and paleoecology ranging from estuarine to marine settings. In the first collection of Mazon research works, following the Symposium on Mazon Creek Fossils (held at the North-Central sectional meeting of the Geological Society of America, 1978), Baird (Reference Baird and Nitecki1979) described the northeastern Braidwood assemblage as representing fresh- to brackish-water taxa that included significant components of terrestrial and freshwater animals and plants—such as syncarid shrimp; the xiphosuran Euproops; lower haline-tolerant bivalves; rare terrestrial arthropods, including insects, spiders, and millipedes; and finally, tree ferns, lycopods, and horsetails—presumed to have washed in from the nearby river drainages. Conversely, what was defined as the Essex assemblage included a variety of soft-bodied marine invertebrates—commonly represented by Essexella, originally interpreted as jellyfish medusae but more recently “flipped” as sessile anemones (Plotnick et al. Reference Plotnick, Young and Hagadorn2023) and other squishy taxa like worms, holothurians, and the infamous Tully Monster, but also including abundant bivalves and crustaceans and with minimal plants—that comprised a decidedly more marine-influenced paleocommunity. Furthermore, Baird and colleagues (Reference Baird, Shabica, Anderson and Richardson1985a) had postulated that there was an ecological transition captured within the localities they defined as Essex-type, although this was not tested in any rigorous manner. They comment that the northern end of Essex-type assemblages had observably higher prevalences of benthic animals, such as Mazonomya bivalves (formerly misidentified as Edmondia; Bailey Reference Bailey2011), polychaetes, and burrows, whereas southern Essex-type localities showed more abundant pelagic organisms. Following their initial suppositions and to quantitatively examine their intuition, we added informal qualifiers to the Essex-type deposits in our data compilation. Retrospectively named for the Illinois counties in which they are most common, these qualifiers were based on the observations of: [Will-Essex] occurrences of the marine clam Mazonomya, trace fossils, holothurians, and worms, versus [Kankakee-Essex] communities dominated by Essexella or other cnidarians, formerly and informally referred to as “blobs” (e.g., Baird et al. Reference Baird, Shabica, Anderson and Richardson1985a), and the absence or near absence of benthos and plants.
While the extensive work of Baird and colleagues in the mid-1980s stood for several decades as the primary paleoecological interpretation of the Lagerstätte, a recent review by Clements et al. (Reference Clements, Purnell and Gabbott2019) called into question the validity of past models of deposition and the characteristic marine versus nonmarine assemblages. Specifically, Clements et al. (Reference Clements, Purnell and Gabbott2019) instead propose that the Mazon Creek deposits represent marine-brackish bay coast sedimentation (e.g., Schopf Reference Schopf and Nitecki1979). A central tenet of the Clements et al. (Reference Clements, Purnell and Gabbott2019) argument is that the terrestrial and freshwater components of the Braidwood assemblage were merely taxa that washed into the bay and that there was no truly distinct freshwater ecosystem preserved in the Mazon Creek system. Clements et al. (Reference Clements, Purnell and Gabbott2019) argue three primary points: (1) the freshwater/marine divide was largely based on plant fossils, which become rarer and less diverse basinward; (2) stenohaline organisms have also been found among the Braidwood fauna; and (3) contemporaneous marine fossils of the late Carboniferous are only found distally, beyond where the Francis Creek Shale pinches out, thus suggesting that the entire system was likely a distinct, concretionary taphonomic window and a brackish marine environment deposited in a shallow, nonturbulent bay setting. This argument was emphasized with the statement that there is no discernible geographic demarcation between the distribution of freshwater and marine organisms.
Here, using the most comprehensive and systematically sampled Mazon fossil suite known—comprising outcomes from nearly 300,000 individual siderite concretions across the region—we employ multivariate statistical methods to explore the veracity of the Braidwood and Essex biotic assemblages detailed in the Baird et al. (Reference Baird, Shabica, Anderson and Richardson1985a,Reference Baird, Sroka, Shabica and Beardb) seminal works, including further exploration of the Will- and Kankaee-Essex subassemblages described earlier. In addition, we integrate new preservational details revealed by X-ray tomographic microscopy of concretions with our paleoecological investigation to generate a cohesive view of the paleoenvironment and taphonomy of the Mazon Creek Lagerstätte.
Geological Setting
Through the Carboniferous Period, Illinois was located around 4 to 6 degrees south of the equator on the eastern edge of an epeiric sea that covered a large portion of the midwestern United States (Scotese and McKerrow Reference Scotese, McKerrow, McKerrow and Scotese1990; Cecil et al. Reference Cecil, Dulong, West, Stamm, Wardlaw, Edgar, Cecil and Edgar2003). The Mazon Creek Lagerstätte formed in this warm tropical setting (Greb et al. Reference Greb, Andrews, Eble, DiMichele, Cecil, Hower, Chan and Archer2003; DiMichele Reference DiMichele2014), confirmed by locally preserved floristics and the nature and extent of paleomires that would alter to coals (DiMichele et al. Reference DiMichele, Phillips and Nelson2002). Francis Creek Shale sites containing Mazon Creek fossils have been most abundantly found in Grundy, Will, Kankakee, Livingston, and LaSalle Counties, all located toward the northeastern part of Illinois near Chicago (Baird et al. Reference Baird, Sroka, Shabica and Beard1985b; Fig. 1), although other isolated and more distal sites have been located elsewhere in the state of Illinois (e.g., the Sunspot Strip mine in the western part of the state near Astoria in Fulton County; Foster Reference Foster1988) and in western Missouri.
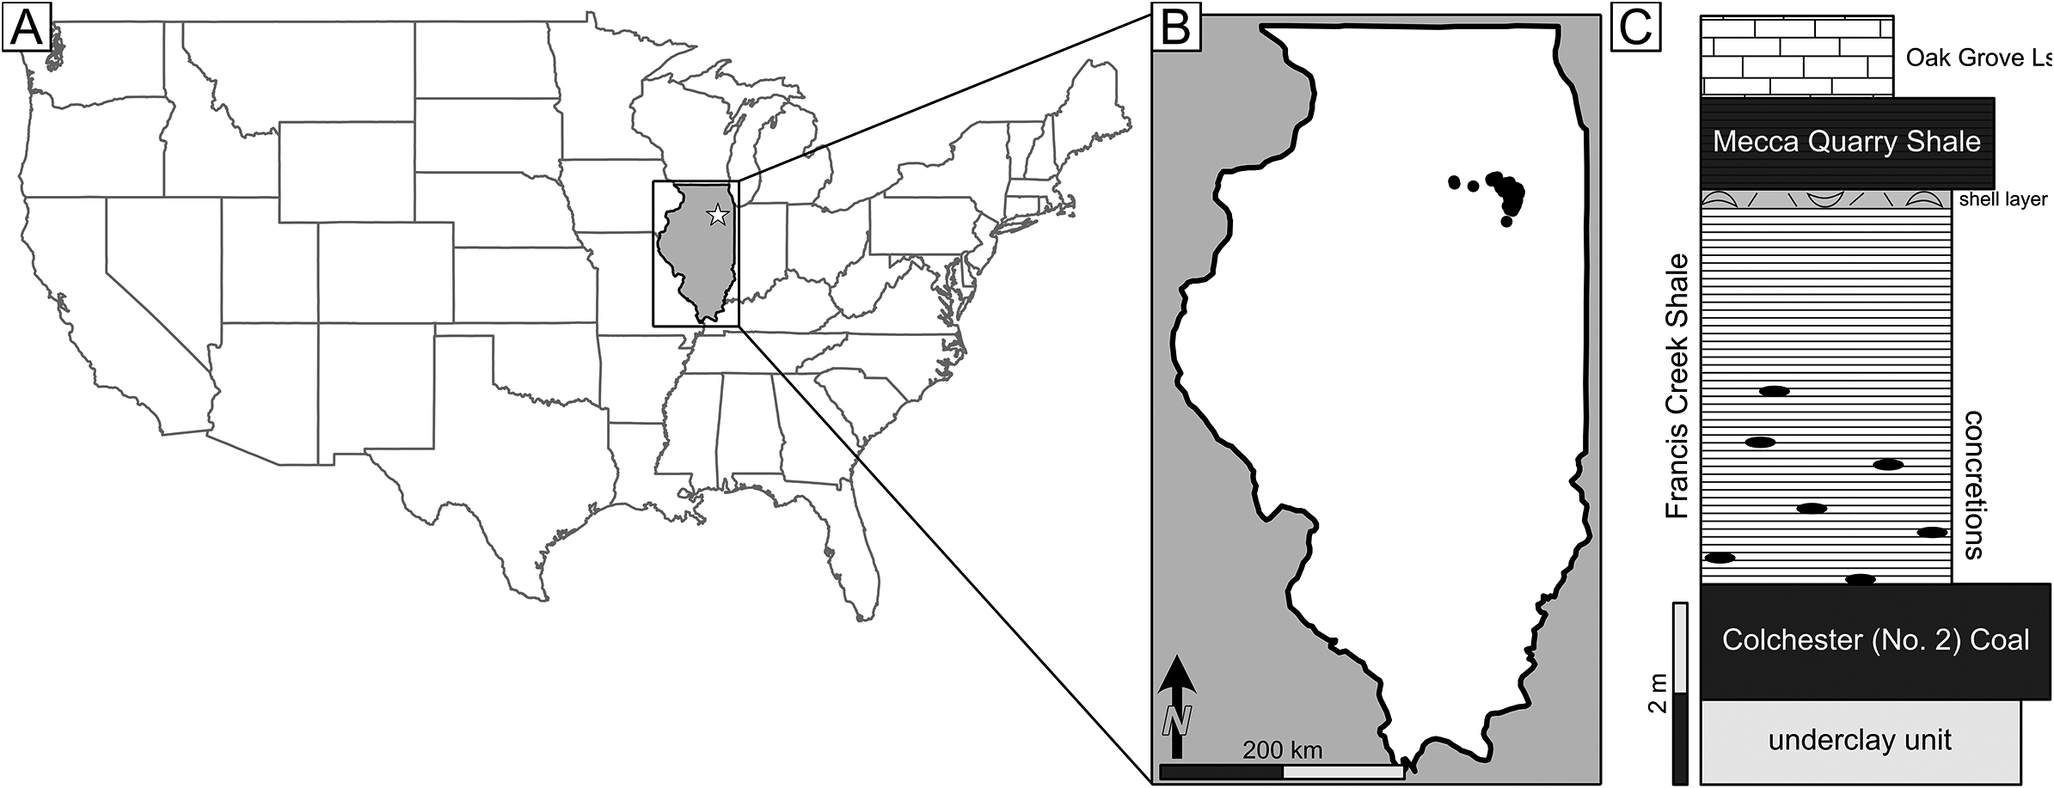
Figure 1. Regional overview and generalized stratigraphy of the Mazon Creek Lagerstätte. A, U.S. map with Illinois highlighted in gray, the star indicates the region of Mazon Creek. B, Illinois with dots indicating sampled Mazon fossils. C, Generalized stratigraphy of the Francis Creek Shale after Baird et al. (Reference Baird, Shabica, Anderson and Richardson1985a).
The Francis Creek Shale is a member within the Carbondale Formation, which regionally forms an estuarine-deltaic clastic wedge separating the underlying Colchester (No. 2) Coal Member and the overlying Mecca Quarry Shale Member (Baird Reference Baird and Nitecki1979; Baird et al. Reference Baird, Sroka, Shabica and Kuecher1986). Under the weight of the sediment of the Francis Creek Shale, the underlying Colchester (No. 2) Coal formed from the gradual thermal-burial carbonization (distillation) and compaction of peat, which also generated accommodation space for additional sediment deposition (Baird et al. Reference Baird, Sroka, Shabica and Kuecher1986). This same sediment loading may have served as a driving factor for expelling key reactive gases (CO2, CH4) from the peat into the water-rich Francis Creek sediment drape. The overlying Mecca Quarry Shale is a fissile black shale with laminar bedding and fragments of fish, presently understood to represent a significant transgressive marine drowning event with the establishment of widespread anoxia across the Illinois Basin and beyond (see Zangerl and Richardson Reference Zangerl and Richardson1963; Heckel Reference Heckel1977; Baird et al. Reference Baird, Sroka, Shabica and Kuecher1986). In northern and northeastern Illinois, the Francis Creek Shale varies in thickness from ~4 m to ~25 m depending on location. Where thin, the Francis Creek Shale represents deposition in an offshore shelf environment and contains only non-concretionary shelly fossils, typical of most contemporaneous marine fossil deposits. In contrast, where the unit is thick, the Francis Creek Shale records estuarine to prodeltaic facies. Here, the Francis Creek Shale is generally a gray silty to sandy mudstone containing some intermixed and irregularly distributed sandstone layers and contains the well-known Mazon Creek–style concretionary fossils (Baird et al. Reference Baird, Shabica, Anderson and Richardson1985a,Reference Baird, Sroka, Shabica and Beardb).
Materials and Methods
The raw dataset from Baird et al. (Reference Baird, Shabica, Anderson and Richardson1985a) comprises 283,821 concretions from 342 separate collections (referred to hereafter as samples) from the Mazon Creek Lagerstätte. These and other non-included samples and all available metadata are detailed in Supplementary Appendix 1. Samples were collected from exposed mine dump surfaces in more than 270 locations, including 25 strip mines and more than 80 shaft mines (Baird et al. Reference Baird, Shabica, Anderson and Richardson1985a). The complete dataset comprises 229 original identification groups (IDs), whether taxonomic or otherwise, including some subgroupings, taphomorphs, or other distinct characterizations (e.g., crushed bivalves vs. intact shells). IDs were originally coded by Baird as four-character abbreviations, which have been included and defined in Supplementary Appendix 2. The original concretion tallies include both fossiliferous (“specimens” hereafter) and non-fossiliferous (“duds” hereafter) concretions. The original ledgers from each included sample have been digitized and are appended in Supplementary Appendix 3.
We revised the ID groupings by combining IDs that were confidently considered junior synonyms and/or taphomorphs. Further details are included in the tables of Supplementary Appendix 2. We culled the raw dataset for multivariate ordination and diversity analyses by removing duds, poorly preserved specimens that could not be identified below the phylum level, problematica, samples with fewer than 50 specimens, and taxa represented in only one sample. All pertinent datasheets, including both the raw data tally and the culled dataset used for statistical analyses, are included as supplementary online files in Microsoft Excel format. In addition, for each sample not removed, we analyzed the proportion of duds to explore emergent trends in fossil preservation.
Each sample was characterized by membership in one of the following assemblages: Braidwood, Will-Essex, Kankakee-Essex, and Essex-Indeterminate. The Braidwood and Essex distinctions follow those of the original nonmarine (Braidwood) versus marine (Essex) faunal assemblages described first by Johnson and Richardson (Reference Johnson and Richardson1966) and expanded by Baird et al. (Reference Baird, Shabica, Anderson and Richardson1985a). Novel here, as discussed earlier, are the specific Will-Essex and Kankakee-Essex sub-designations of the Essex assemblage. The few samples whose constituents are marine taxa but without enough of the defining Will- or Kankakee-specific taxa to enable confident assignment were designated Essex-Indeterminate and excluded from further analyses.
Following these procedures, the culled dataset for community structure and diversity analyses contains 113,696 specimens from 263 samples and 138 distinct taxa, plus an additional 157,203 duds not included in these analyses. Most concretions were collected as whole, unsplit nodules and were opened using the common freeze–thaw technique (Sroka and Baird Reference Sroka, Baird, Shabica and Hay1997).
Community Structure and Diversity
The taxon abundance data in the culled dataset—both in raw counts and as percentage-transformed data (e.g., Holland et al. Reference Holland, Orchard and Loughney2024), owing to the large variation in fossil occurrences per site—were subjected to nonmetric multidimensional scaling (NMDS) to explore and visualize their underlying structure. We conducted the NMDS using the metamds function from the vegan (Oksanen et al. Reference Oksanen, Simpson, Blanchet, Kindt, Legendre, Minchin and O’Hara2022) package in R, which simultaneously calculates scores for samples and taxa. We reduced the dataset to three axes (which resulted in lower stress values than the other option of reducing the data to two axes) and visualized the resulting data by several different grouping variables: assemblage grouping, habitat (terrestrial, freshwater, intermediate, and marine), clade, and histology. Habitat scoring, in all possible cases, follows the extensive literature on Mazon Creek organisms, for example, including sharks, fish, and jawless fish (Carpenter et al. Reference Carpenter, Falcon-Lang, Benton and Nelson2011; McCoy et al. Reference McCoy, Wittry, Sadabadi and Mayer2023); Euproops and xiphosurans (Anderson Reference Anderson1994); syncarid shrimp (Camacho and Valdecasas Reference Camacho, Valdecasas, Balian, Lévêque, Segers and Martens2008); eurypterids (Tetlie and Poshcmann, Reference Tetlie and Poschmann2008); and Essexella and other cnidarians (Plotnick et al. Reference Plotnick, Young and Hagadorn2023). However, there are undoubtedly many Mazon taxa that will still undergo further revision, echoing the recent debates regarding the Tully Monster (McCoy et al. Reference McCoy, Saupe, Lamsdell, Tarhan, McMahon, Lidgard and Mayer2016, Reference McCoy, Wiemann, Lamsdell, Whalen, Lidgard, Mayer, Petermann and Briggs2020; Sallan et al. Reference Sallan, Giles, Sansom, Clarke, Johanson, Sansom and Janvier2017; Mikami et al. Reference Mikami, Ikeda, Muramiya, Hirasawa and Iwasaki2023), which we unfortunately cannot resolve in a proactive manner.
While assemblage, habitat, and clade assignments are relatively self-explanatory, for our histological assignments, we devised seven categories listed here in order of decreasing recalcitrance: (1 and 2) lignin/cellulose, the dominant components of plant tissues, and chitin, the primary constituent of arthropod exoskeletons; (3 and 4) biominerals, including invertebrate shell and vertebrate bone, which are often dissolved in Mazon concretions; (5) dermis or other soft tissue, or generally the outer integument of the preserved organism; (6) preservation as impressions in sediment, used to classify trace fossils; and (7) unknown, used as a catchall for problematic organisms or tissues.
In addition, we quantified the relationship between taxonomic dissimilarity (the Bray-Curtis index) and geographic distance between samples, calculated using the distm function in the geosphere package (Hijmans Reference Hijmans2024). We used the Mantel test to determine the significance of the Pearson’s correlation between these two matrices.
Finally, we used the culled abundance data to conduct rarefaction analysis of taxon richness using the rarecurve function and calculated the expected richness for each sample at the smallest sample size (n = 51) using the rarefy function, both in the vegan package. We calculated Pielou’s evenness index (J′) for each sample as well. To investigate the role of preservational bias on the ecological structure of the data, we calculated the percent of specimens in each sample that were duds in the original abundance dataset.
X-ray Tomographic Microscopy
To supplement recent tomographic assessment of Mazon plants (Herrera et al. Reference Herrera, Hotton, Smith, Lopera, Neander, Wittry, Zheng, Heck, Crane and D’Antonio2023), we selected and scanned a total of 18 specimens loaned from the University of Illinois and Illinois Natural History Museum to provide a survey of 3D data from various animal taxa of both the Braidwood and Essex assemblages. Our 3D imaging was conducted using a Zeiss Xradia 510 Versa X-ray tomographic microscope (μCT) at the University of Missouri X-ray Microanalysis Laboratory. Operating conditions for μCT analyses are as follows: beam voltage = 140 kV; power = 10 W; high-energy beam filter (either the HE3 or HE4 Zeiss filters were used where appropriate); and exposure time ranged from 1 to 4 seconds depending on transmittance values. All scans were performed with 1601 projections through 360° rotation and conducted using the 0.4× detector. Voxel resolution ranged from 35 to 58 μm.
Results
Nonmetric Multidimensional Scaling
The samples of the culled dataset displayed a wide range of sample sizes by site, from 51 to 2055, with a median value of 303 specimens. The NMDS of the culled dataset repeated the best solution two times in 20 iterations and has an acceptable stress value of 0.15. Samples, coded by assemblage grouping (Fig. 2A), demonstrate clustering within the NMDS 1/NMDS 2 space. Owing to the large variation in sample sizes, we repeated NMDS analysis on percentage-transformed data (Fig. 2B). The best solution was repeated once in 37 iterations, improving stress to 0.095, and echoing the same grouping pattern. Samples classified as the Braidwood assemblage (n = 77) form a relatively small cluster with negative NMDS 1 values and intermediate NMDS 2 values. The Kankakee (n = 79) and Will (n = 107) assemblages are characterized by greater variation and overlap with one another in the NMDS 1/NMDS 2 space. Both have more positive NMDS 1 values than the Braidwood. They can be distinguished from one another by their differences in NMDS 2 values; Kankakee being more negative and the Will being more positive. There is no notable distinction between the groupings along the NMDS 3 axis. Given that the Will- and Kankakee-Essex delineations were initially assigned based on observed abundances of Mazonomya and Essexella, respectively, we additionally examined the dataset with these taxa removed to avoid self-fulfilling reasoning (Fig. 2C). The best solution was repeated twice in 20 tries, with a stress value of 0.16, and yields results that again maintain the same pattern (Fig. 2C).
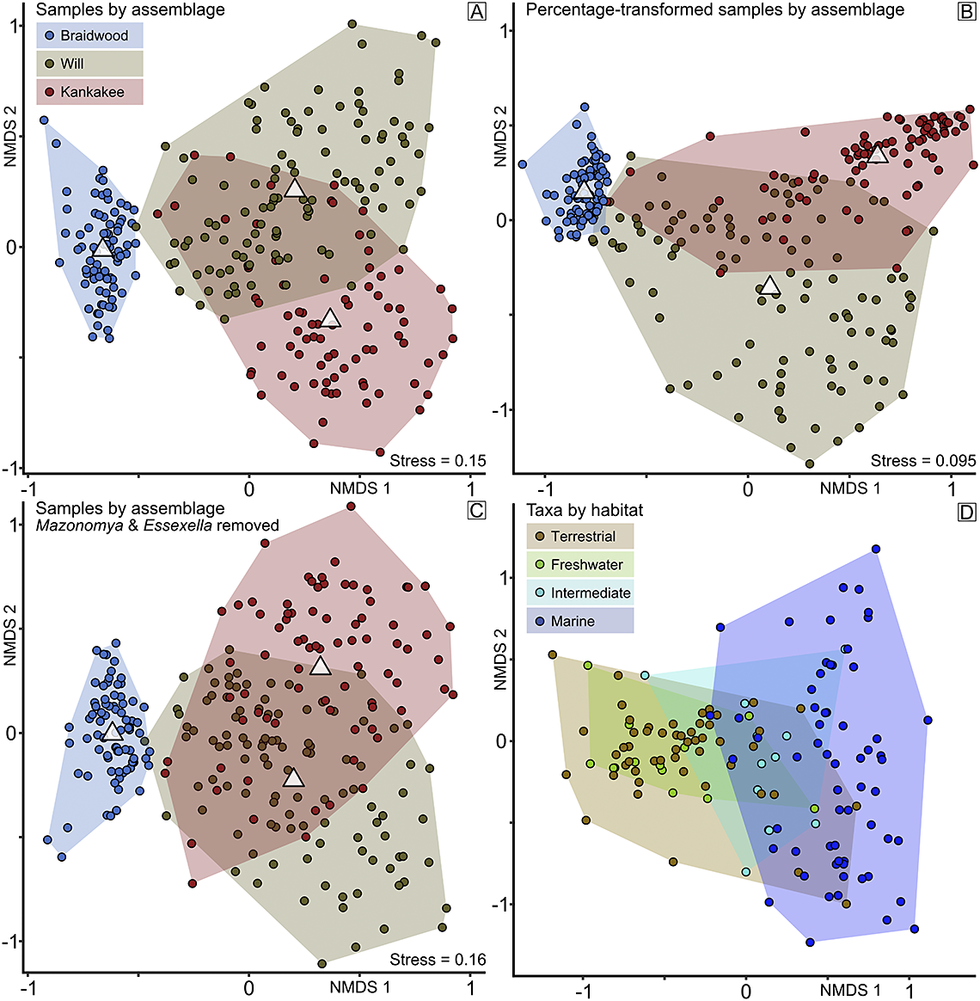
Figure 2. Nonmetric multidimensional scaling (NMDS) groupings by assemblage and habitat. A, NMDS results of samples grouped by assemblage, Braidwood, Kankakee-Essex, and Will-Essex. White triangles within each convex hull indicate data centroids; key remains appropriate for B and C. B, NMDS results of percentage-transformed data; note that the positions of the Will- and Kankakee-Essex groupings have been flipped along NMDS axis 2 (y-axis) versus A. C, NMDS results of culled data with Mazonomya and Essexella removed to test the veracity of the Will- and Kankakee-Essex designations, again with flipped groupings along NMDS axis 2 (y-axis) versus A. D, NMDS results of taxa grouped by habitat, terrestrial, freshwater, intermediate, and marine.
Taxon scores, color-coded by habitat (Fig. 2D), show a gradient from terrestrial and freshwater to marine as NMDS 1 scores become more positive. The NMDS spaces of the terrestrial and freshwater taxa largely overlap, displaying relatively little differentiation along NMDS 1, and the latter occupies a proximal subset of the former along the NMDS 2 axis. While showing the largest spread of NMDS 2 values, the marine taxa also show the most positive NMDS 1 values, with the taxa from intermediate habitats falling generally between the terrestrial/freshwater and marine taxa along the NMDS 1 axis. As expected, there is a correspondence between the assemblages of samples and the habitats of taxa (Fig. 2) within the NMDS 1/NMDS 2 space. Samples identified as Braidwood primarily overlap with terrestrial and freshwater taxa. Furthermore, the Kankakee and Will assemblage samples correspond with intermediate and marine taxa. Taxa plotted by clade further reinforce this pattern (Fig. 3A). For example, most plant taxa overlap with terrestrial and freshwater taxa in the Braidwood assemblage, while echinoderms, cnidarians, and brachiopods correspond with marine taxa in the Kankakee and Will assemblages. Mollusks, worms, fish, and arthropods are widely distributed in the NMDS 1/NMDS 2 space. These patterns are more fully dissected in the ridge plots occurrence density across the NMDS 1/2 axes for the most abundant taxa (n ≥ 500; Fig. 4). We additionally plotted specimens by their preserved histologies, the results of which will be discussed with respect to taphonomy.
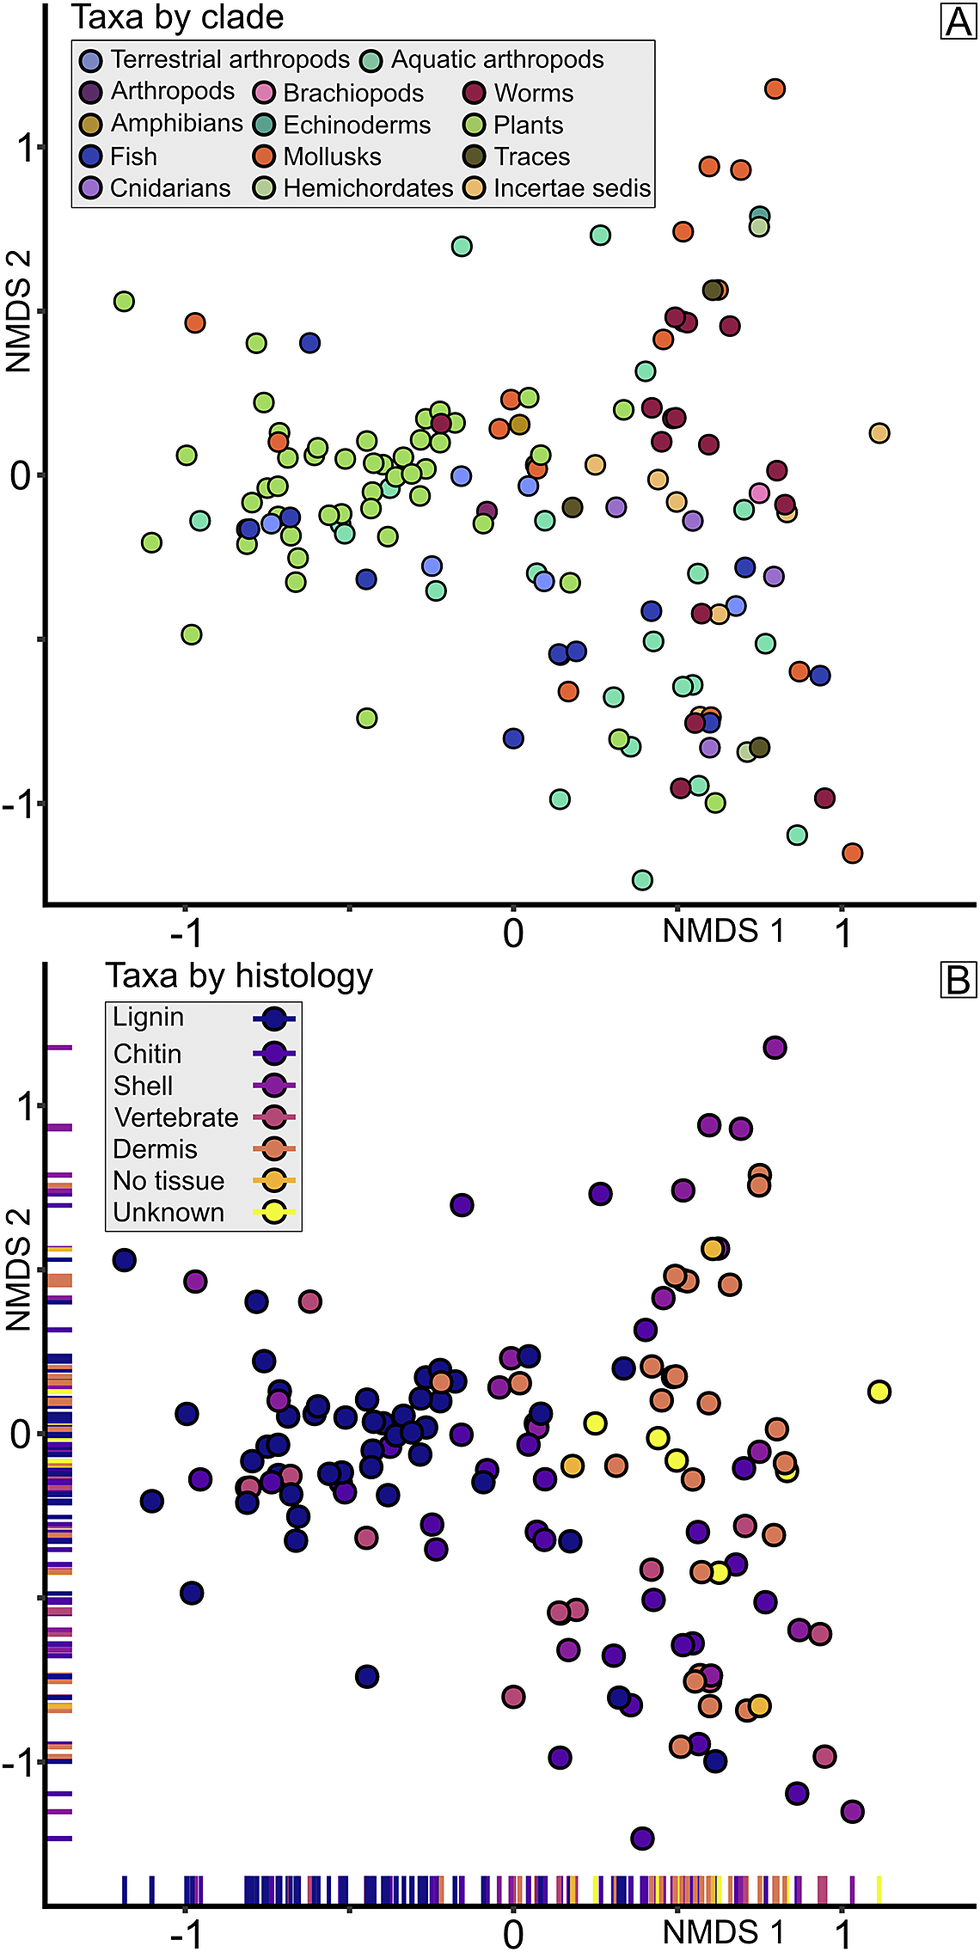
Figure 3. Nonmetric multidimensional scaling (NMDS) groupings of taxa by clade and histology. A, NMDS results of taxa grouped by clade. B, NMDS results of taxa grouped by the histology of the dominant tissue type preserved, ordered in increasing temperature color by tissue lability. Rug plots included on axes to aid visualization.
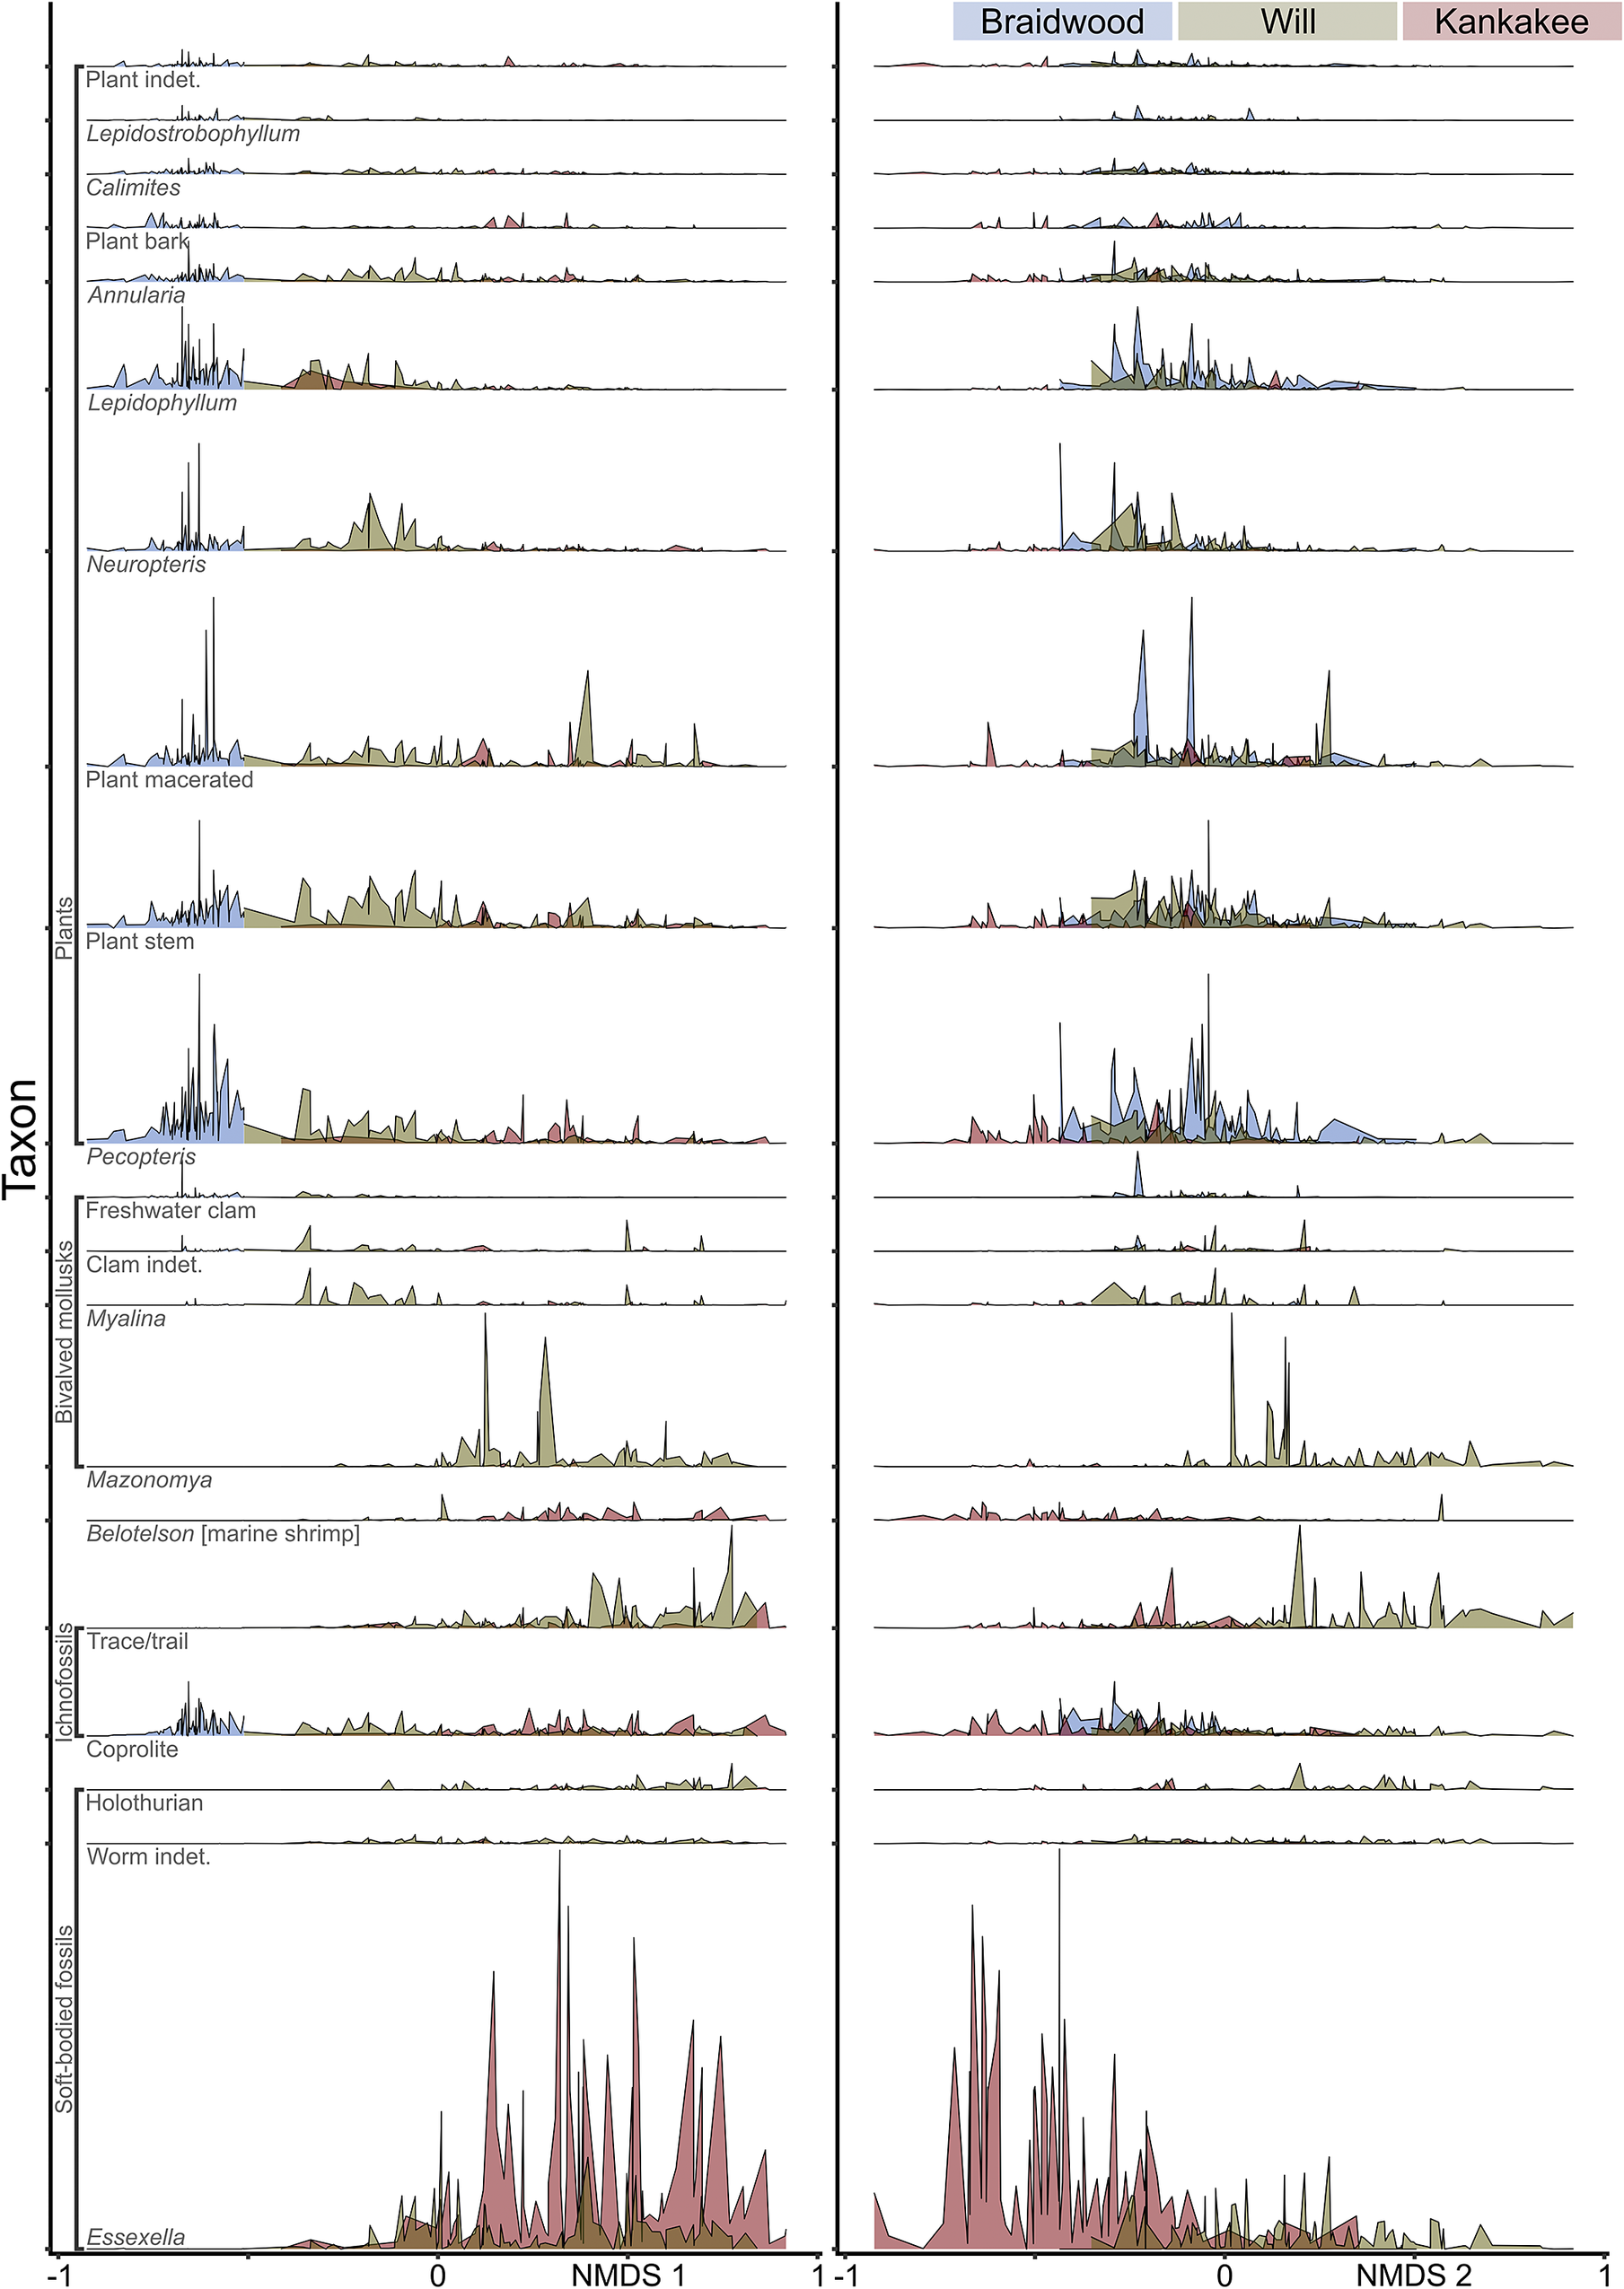
Figure 4. Ridge plots displaying density of occurrences for the most abundant taxa. Left corresponding to nonmetric multidimensional scaling (NMDS) axis 1; right corresponding to NMDS axis 2.
The median geographic distance between locations is 9.0 km, with a maximum distance of 53.8 km. The geographic distance matrix is positively correlated with the Bray-Curtis dissimilarity matrix (Mantel statistic based on Pearson’s product-moment correlation r = +0.26, p = 0.001; Fig. 5).
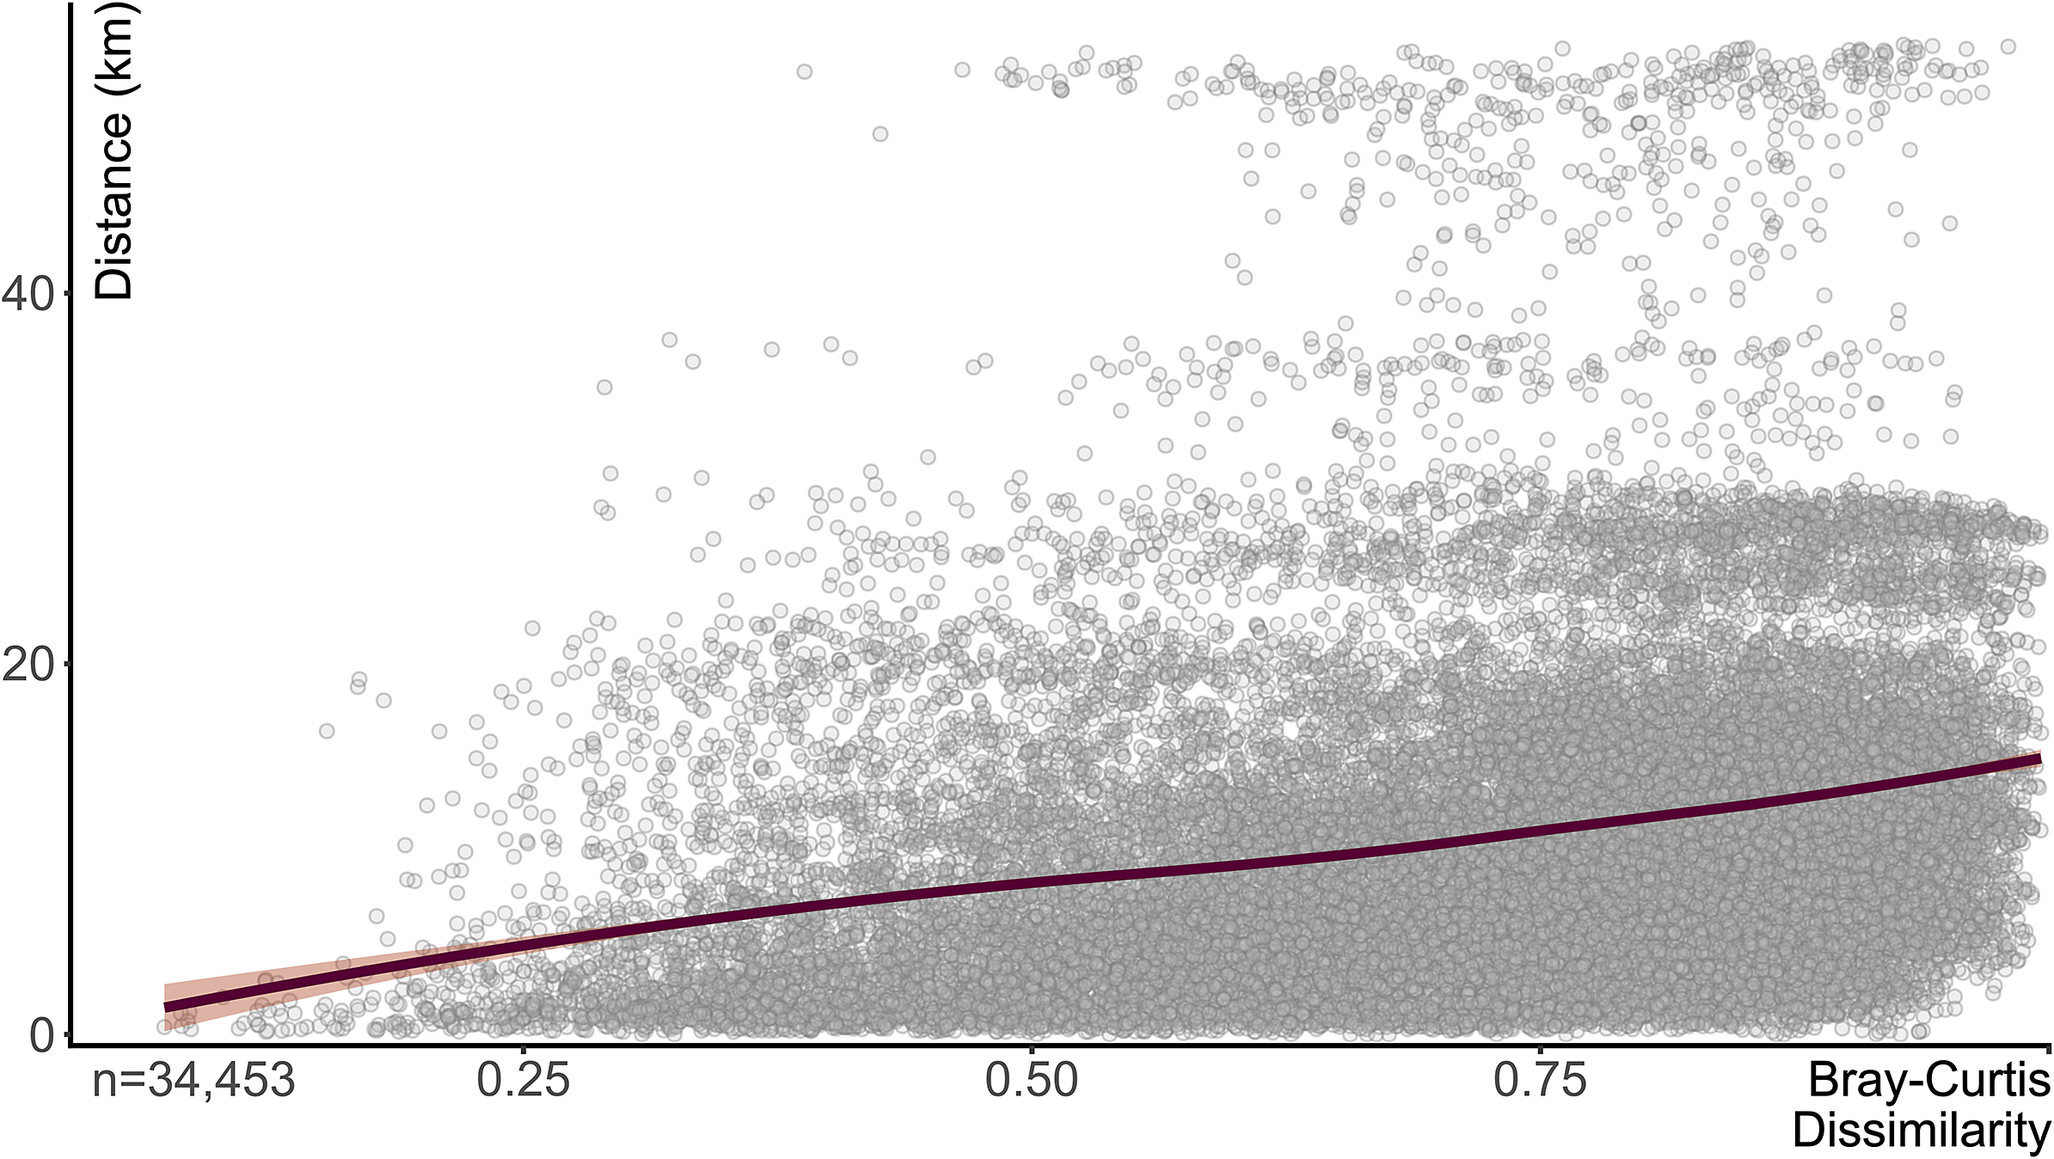
Figure 5. Pairwise comparison of sampling locality taxonomic dissimilarity (Bray-Curtis) and geographic distance. Maroon line indicates LOESS (locally estimated scatter plot smoothing) function; orange indicates standard error.
Diversity
Along with a wide range of sample sizes, variation of taxon richness and evenness values was also broad (Fig. 6). The median rarefied richness (at n = 51) is statistically distinguishable for all three groupings: Braidwood (11.9), Kankakee (9.8), and Will (13.4): Braidwood versus Will p Wilcoxon = 2.80 × 10⁻⁴; Braidwood versus Kankakee p Wilcoxon = 2.17 × 10⁻⁵; and Will versus Kankakee p Wilcoxon = 1.24 × 10⁻⁹. The median Pielou’s evenness values for each grouping are as follows: Braidwood = 0.73, Kankakee = 0.49, and Will = 0.73 (Fig. 6). The Braidwood and Will are statistically indistinguishable (p Wilcoxon = 0.53) from one another while they are both distinct from the Kankakee (p Wilcoxon = 1.31 × 10⁻¹³ and 6.46 × 10⁻¹⁵, respectively).
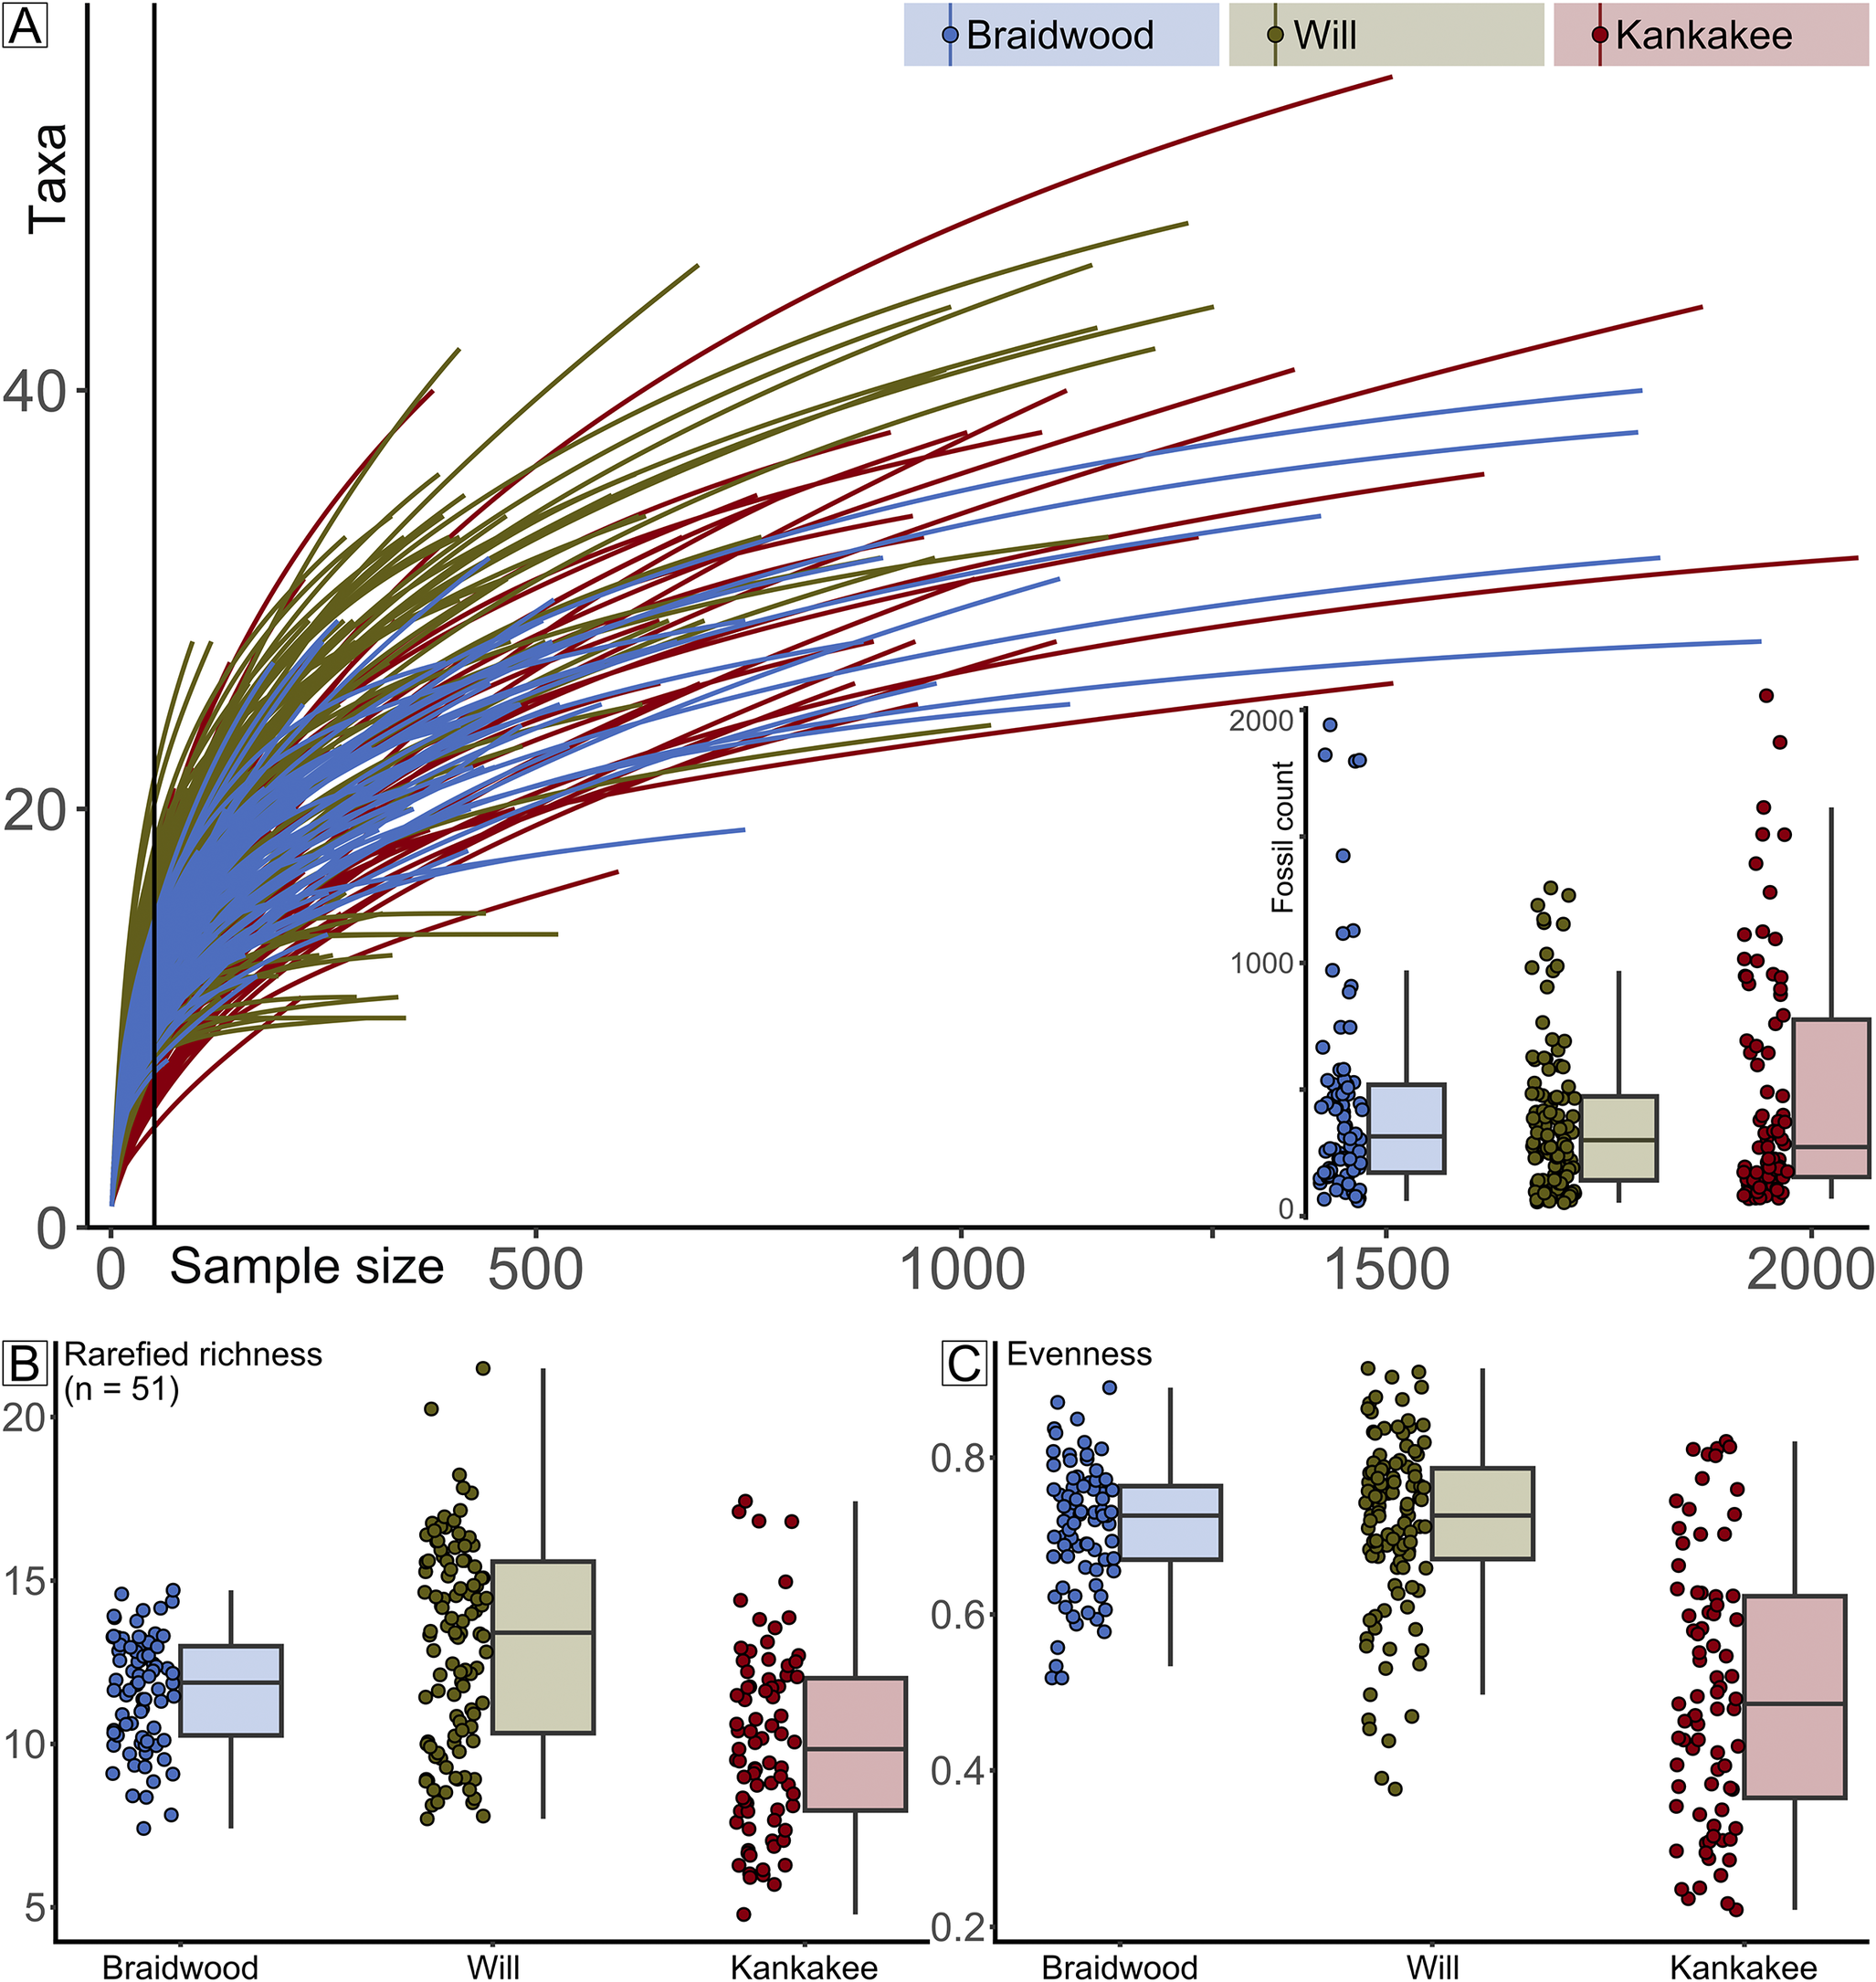
Figure 6. Rarefaction results. A, Rarefaction curves color coded by assemblage, Braidwood, Essex indeterminate, Kankakee-Essex, and Will-Essex. Inset shows box plot of fossil count data, also grouped by assemblage. B, Box plot of rarefied species richness values. C, Box plot of evenness values.
X-ray Tomographic Microscopy
Image data from μCT analysis reveal that most fossil material does not have significant contrast in density to differentiate the siderite of the concretion from the preserved organism, with the exception of those exhibiting 3D preservation, such as the coprolites, bivalves, and cephalopods. Of interest, however, these scans revealed the presence of high-density mineral precipitates, most likely representing pyrite halos, that flank the fossil material within 15 of the 18 scanned specimens. These high-density structures are generally oblate and ovoid in shape, following the general shape of the concretion; appear to range from densely disseminated precipitates to more solid mineral amalgamations; occur singularly or as clusters of several smaller structures; and are positioned on either the thicker “half” of the concretion relative to the position of the fossil within, or as two structures sandwiching the fossil, one on each top and bottom of the fossil.
Discussion
Testing the Integrity of the Mazon Creek Biotic Assemblages
Let us first pose the overarching question that should be addressed: what evidence distinguishes between the Braidwood and Essex assemblages? We can approach this problem from several different aspects, but to follow from the historical perspective, we start with assemblage-level, or ecological, distinctions as originally defined by Johnson and Richardson (Reference Johnson and Richardson1966) rather than geographic demarcations as contended by Clements et al. (Reference Clements, Purnell and Gabbott2019). We performed NMDS on culled taxon abundance data to explore potential assemblage-level relationships in three dimensions while trying to minimize distortion of the original data. Even though this technique explores the data in three dimensions, only the first two, NMDS 1 and NMDS 2, were important for distinguishing between the Braidwood, Kankakee, and Will assemblages. We can see a clear separation between the Braidwood assemblage and the Essex assemblages (Kankakee+Will) on the whole. This primary delineation occurs along the major axis, NMDS 1, while a noticeable but less well-partitioned distinction between the Kankakee- and Will-Essex assemblages is observed along the secondary axis, NMDS 2.
Despite the wealth of information from this collection, there are still caveats to consider. First and foremost, the majority of these fossil-bearing concretions were collected with no stratigraphic context as components of bulk-extracted mine spoil. However, from limited exposures of the Francis Creek Shale, mainly along the banks of the Mazon River, as well as from mine information, we know that the concretions predominantly occur concentrated in the lower part of the member (Baird Reference Baird and Nitecki1979; Baird et al. Reference Baird, Shabica, Anderson and Richardson1985a; Clements et al. Reference Clements, Purnell and Gabbott2019). Second, we have no control over the sample sizes from each of the collected localities. Many localities are variably obscured by vegetation, or were either more fossiliferous, more densely populated with concretions, or had a higher proportion or volume of mixed-in post-Pennsylvanian overburden (glacial till and gravel) than others. Although our data-culling process attempted to mitigate this issue by removing samples with low specimen numbers (fewer than 50), we would still have little to no control over these concerns. At the very least, we should expect that time averaging does play a substantial role in the community structure recovered at each sampling locality—if not because of the nature of this deltaic paleoenvironment, then certainly anthropogenically induced from dumping a wide swath of siderite concretions into single or consolidated mine spoil piles.
Nevertheless, the distinctions that we were able to observe in our NMDS analyses indicate that there is an observable ecological distinction between the Braidwood and Essex assemblages, and evidently also between the Kankakee-Essex and Will-Essex assemblages. The differentiation between the Will- and Kankakee-Essex subassemblages persists even after the removal of the defining taxa Mazonomya and Essexella (Fig. 2B), confirming their validity as separate assemblages. Thus, instead of arguing for fewer assemblages, we advocate a more nuanced view with three conspicuous assemblages: (1) the Braidwood, a moderate-richness and high-evenness estuarine environment that is composed of a higher abundance of freshwater or marginally saline-tolerant taxa and terrestrial organisms carried from nearby river distributaries; (2) the Will-Essex, a high-richness and high-evenness proximal marine-influenced setting that is characterized by an abundant marine benthos, including Mazonomya bivalves, holothurians, worms, and trace fossils; and (3) the Kankakee-Essex, the lowest richness and evenness assemblage that preserves the most distal marine signal. This low evenness is likely driven by the localized predominance of cnidarian medusae or anemones (median value of 26%, significantly higher than that of the Braidwood (0%, p < 2.2 × 10⁻¹⁶) and Will (4.1%, p < 2.2 × 10⁻¹⁶) (Fig. 7).
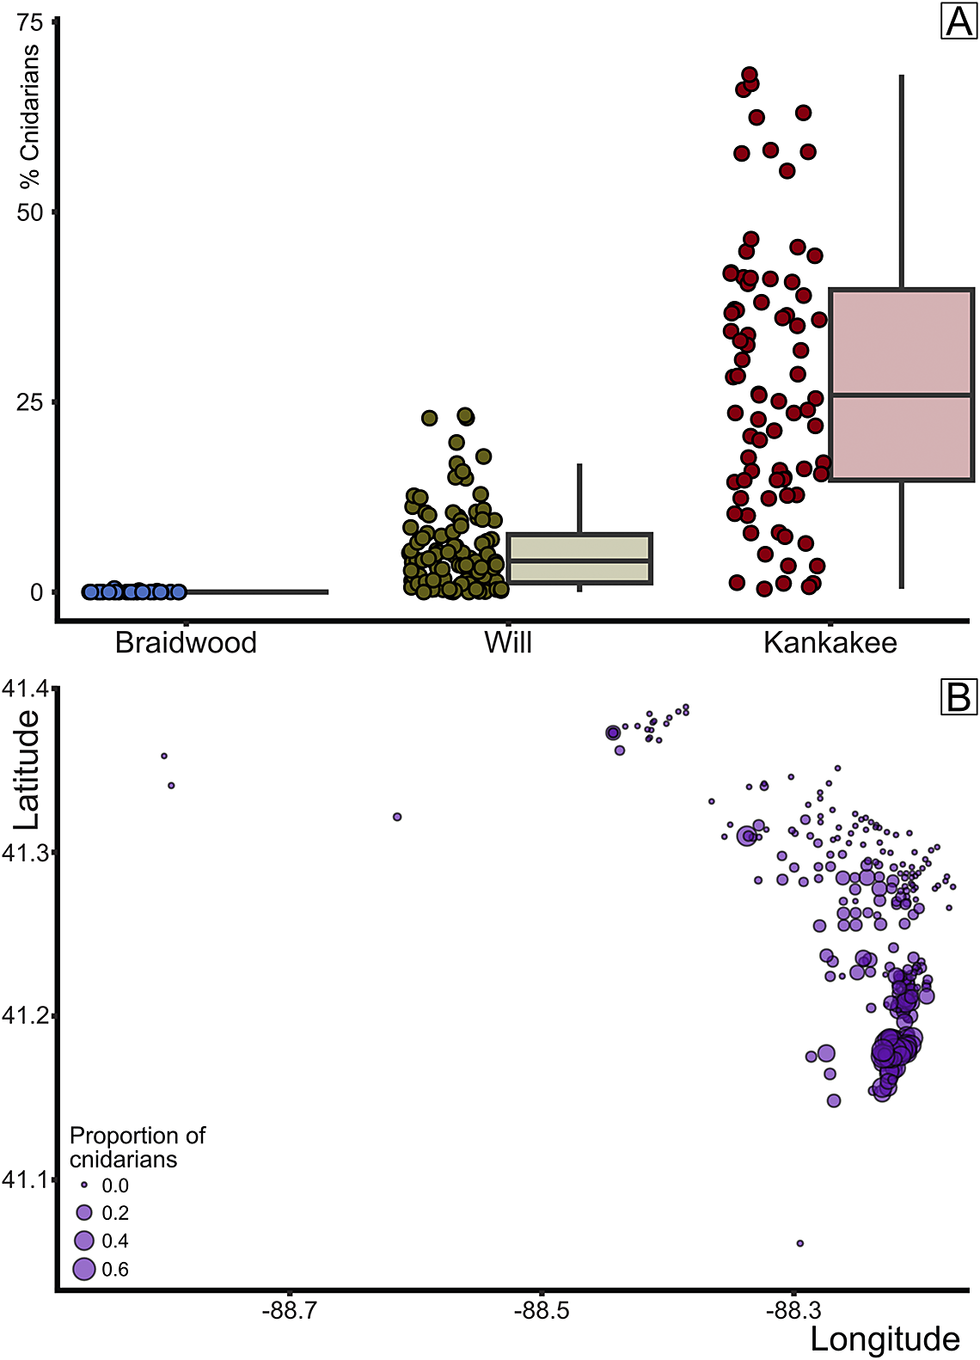
Figure 7. Percentage of cnidarian-grade organisms by biota. A, Box plot of cnidarian proportion by assemblage. B, Percent cnidarians plotted by mapview (longitude/latitude); circle size indicates proportion of concretions with cnidarian-grade organisms.
One could argue that the paleoecological variation is driven by the preponderance of “wash-out” components from terrestrial ecosystems (sensu Clements et al. Reference Clements, Purnell and Gabbott2019), which are notably dominant in the Braidwood samples. The concept that the terrestrial plants and arthropods represent allochthonous components is not a new one; indeed, Baird et al. (Reference Baird, Shabica, Anderson and Richardson1985a) noted that the terrestrial components were “clearly allochthonous, having been washed into marine water areas from land” (pp. 265–268). This quote addresses the presence of terrestrial organisms as limited components in the more distal samples (Essex), suggested to be the result of one-way, seaward transport and mixing, although their presence in more proximal Braidwood samples is also understood to be sourced from nearby terrestrial habitats. However, the Braidwood localities also include a residual component of distinctive aquatic or probably aquatic forms, such as nonmarine bivalves, estheriids, the shrimp Palaeocaris, and Euproops, as well as lungfish scales and teeth. Although this aquatic component of the Braidwood assemblage is low in diversity and abundance, it represents organisms that actually lived in the oligohaline-to-limnic belt of brackish-water settings. These taxa are largely restricted to Braidwood localities and are nearly to completely absent in the Essex areas. In the Essex localities where they do occur, this likely represents the seaward limit of their normal aquatic ranges (Baird et al. Reference Baird, Shabica, Anderson and Richardson1985a). Following on this, Baird et al. (Reference Baird, Shabica, Anderson and Richardson1985a) suggested a gradual disappearance of Braidwood aquatic taxa moving seaward but highlighted a much more abrupt disappearance of Essex animals toward the inferred paleocoast, plausibly related to narrower tolerances for fluctuating salinities closer to shore. Another argument that favors the Braidwood assemblage as a real entity is its recurrent character within the Moscovian Stage. Reviewing late Carboniferous siderite concretion biotas from Europe, including the British Midlands coal measures, France, and southern Poland, shows that these biotas are dominated by plants and, smaller in number, nonmarine bivalves, xiphosurans, and rare or exotic arthropods, as well as few fish and tetrapods (e.g., Charbonnier et al. Reference Charbonnier, Vannier, Galtier, Perrier, Chabard and Sotty2008; Garwood et al. Reference Garwood, Dunlop and Sutton2009; Pacyna and Zdebska Reference Pacyna and Zdebska2012)—comparable as well to other North American localities in Canada, Indiana, Missouri, and Oklahoma (e.g., Baird et al. Reference Baird, Sroka, Shabica and Beard1985b; Maples Reference Maples1986; Zodrow and Cleal Reference Zodrow and Cleal1999; Thomka and Lewis Reference Thomka and Lewis2013; Zodrow and Pšenička Reference Zodrow and Pšenička2022). Thus, in short, the Braidwood community corresponds to a recurrent brackish coastal facies within the overall late Carboniferous succession. In the global context, the Essex assemblage is actually the less well-characterized biota, temporally, because it is unknown outside of the Francis Creek Shale in Illinois and Missouri.
Implications of Mazon Creek Paleoecology for Paleoenvironmental Reconstruction
As our analyses show clear compositional segregation, we can now ask the follow-up question: are the Braidwood and Essex communities geographically or paleoenvironmentally distinct? Here again, we can make use of the collection metadata (Baird et al. Reference Baird, Shabica, Anderson and Richardson1985a) to plot the paleoecological characters of each sample in geographic space. First, when plotting each sample by its predefined classification, whether Braidwood, Will-Essex, or Kankakee-Essex, we gain a decidedly conspicuous view of the paleocoastline (Fig. 8), as was also inferred by Baird et al. (Reference Baird, Shabica, Anderson and Richardson1985a). In fact, in our construction of Figure 8, the original inferred paleocoastline frame from Baird et al. (Reference Baird, Shabica, Anderson and Richardson1985a: fig. 1.2) was lifted, scaled, and overlain on the newly plotted data, and it divided the Braidwood from summative Essex assemblages remarkably well. The localities with Braidwood-type assemblages clearly occupy the northeastern portion of the fossil deposits, including fossiliferous regions closest to Morris and Wilmington in Grundy and Will Counties, respectively. Moving offshore from the inferred paleocoast, Braidwood assemblages give way sharply to Essex-type assemblages, mostly those of the newly demarcated Will-Essex grouping, which is positioned largely around the town of Braidwood in Will County. The Will designation, as noted earlier, is based on the frequent occurrence of Mazonomya—a euryhaline bivalve rare in fully marine settings but absent in freshwater environments—along with sea cucumbers, various worm taxa, and burrows. The paleogeographic distribution of these assemblages indicates that they occupied nearer-shore paleoenvironments that were more stable in salinity with less disturbance than the nearest-shore Braidwood assemblage, thus permitting colonization of the benthos by clams and worms. These environments likely still had some influence from freshwater drainage but could be considered generally more marine than the nearest-shore Braidwood position with greater spatial and temporal salinity fluctuation. In fact, Bailey (Reference Bailey2011) suggested that the bivalve assemblages observed in what we have termed the Will-Essex assemblage were representative of predominantly brackish and oxygen-deficient to dysoxic conditions, noting that Mazonomya were infaunal chemoautotrophs that occupied organic-rich and sulfide-rich muds, following the deltaic drowning of peat swamps and resulting eutrophication. However, the assemblages noted as Will-Essex are those that show a localized presence of preserved burrowing traces (specifically summing Diplocraterion and those traces described only as “trails”; Fig. 9), albeit few in number. While the proportion of concretions that capture bioturbation is decidedly low across the entire Lagerstätte, with median values below 1% in each assemblage (Fig. 9A), the Will-Essex assemblage contains statistically more burrows than both the Braidwood (p < 2.2 × 10⁻¹⁶) and Kankakee (p = 0.02055). As such, we can surmise that the Will-Essex localities were perhaps less susceptible to high sedimentation rates and subsequent anoxia as is often inferred (Baird et al. Reference Baird, Sroka, Shabica and Kuecher1986; Feldman et al. Reference Feldman, Archer, Kvale, Cunningham, Maples and West1993; Clements et al. Reference Clements, Purnell and Gabbott2019), or at least ephemerally hospitable to bioturbators. This same biotic gradation is observed in the smaller Francis Creek Shale Lagerstätte in western Missouri (Henry County), where a well-defined Braidwood floral–faunal mix grades westward into a Will-Essex assemblage over a lateral distance of approximately 2–3 km (Baird et al. Reference Baird, Sroka, Shabica and Beard1985b). Among the Illinois localities, those identified as Kankakee-Essex assemblages represent further offshore environments that are the most marine in character. These locations, which are clustered dominantly to the southeast corner of the map (Fig. 8) in Kankakee County west of the town of Essex, show a high abundance of cnidarian fossils (Fig. 7) but include only infrequent benthos and minimal terrestrially derived plants (e.g., plants and other terrestrially derived organisms generally represent less than 10% of the assemblage compositions in southern Will and northern Essex counties; see Figs. 8, 10, Supplementary Material).
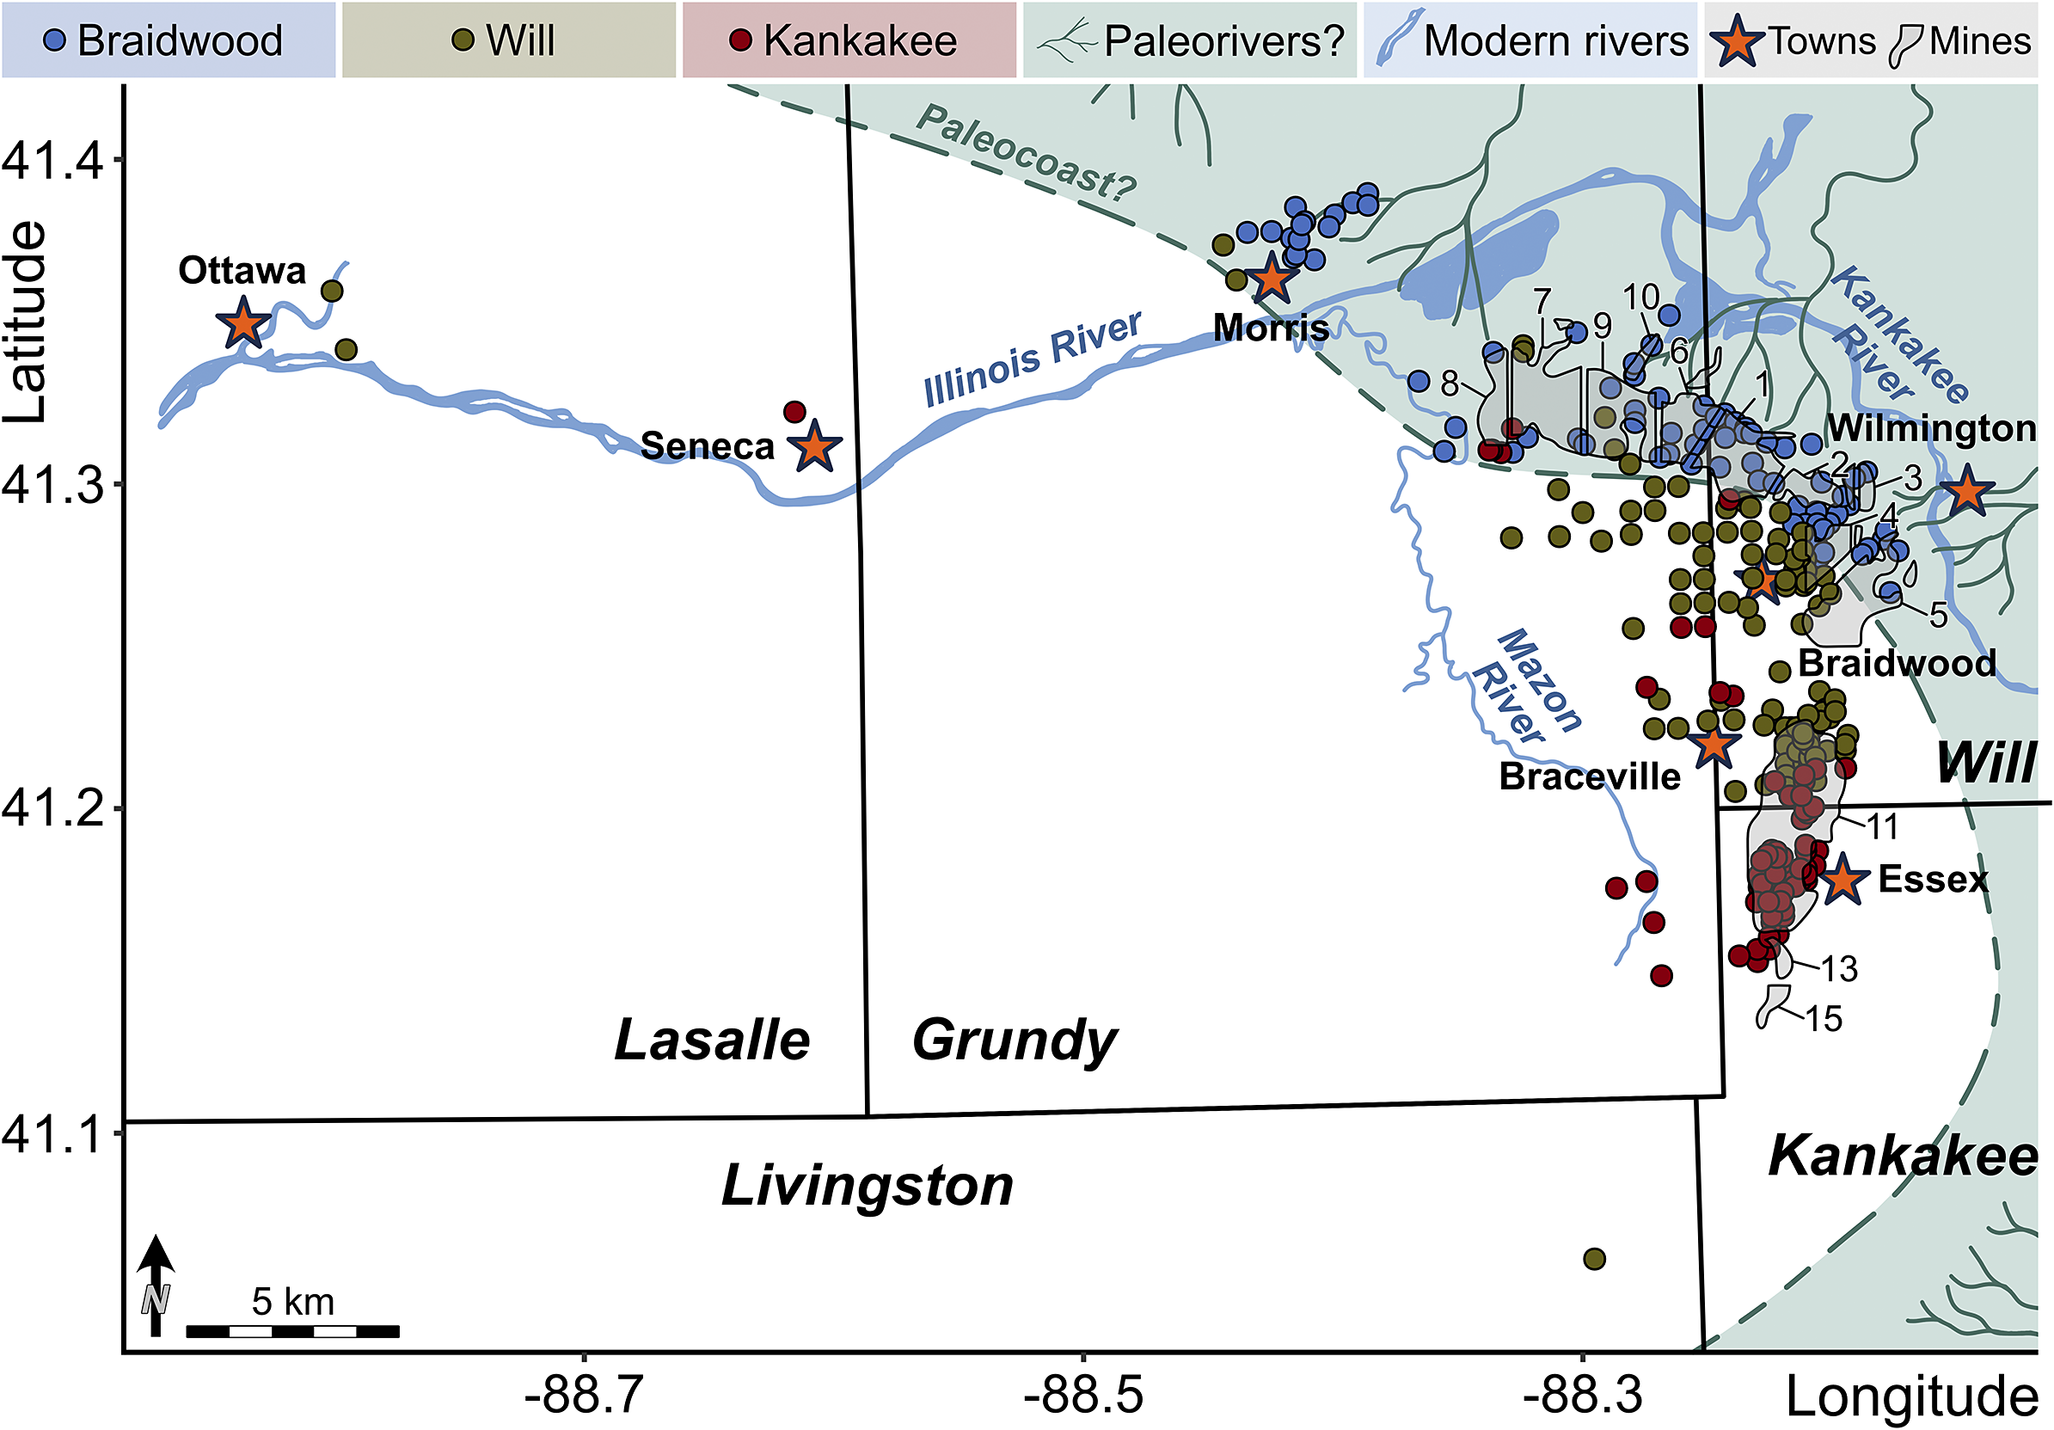
Figure 8. Map of each locality, plotted with respect to its assemblage classification into Braidwood, Essex indeterminate, Kankakee, and Will. Black lines correspond to county lines. Hypothetical paleocoastline and mine regions drawn with respect to the original interpretation of Baird et al. (Reference Baird, Shabica, Anderson and Richardson1985a: fig. 1.2).
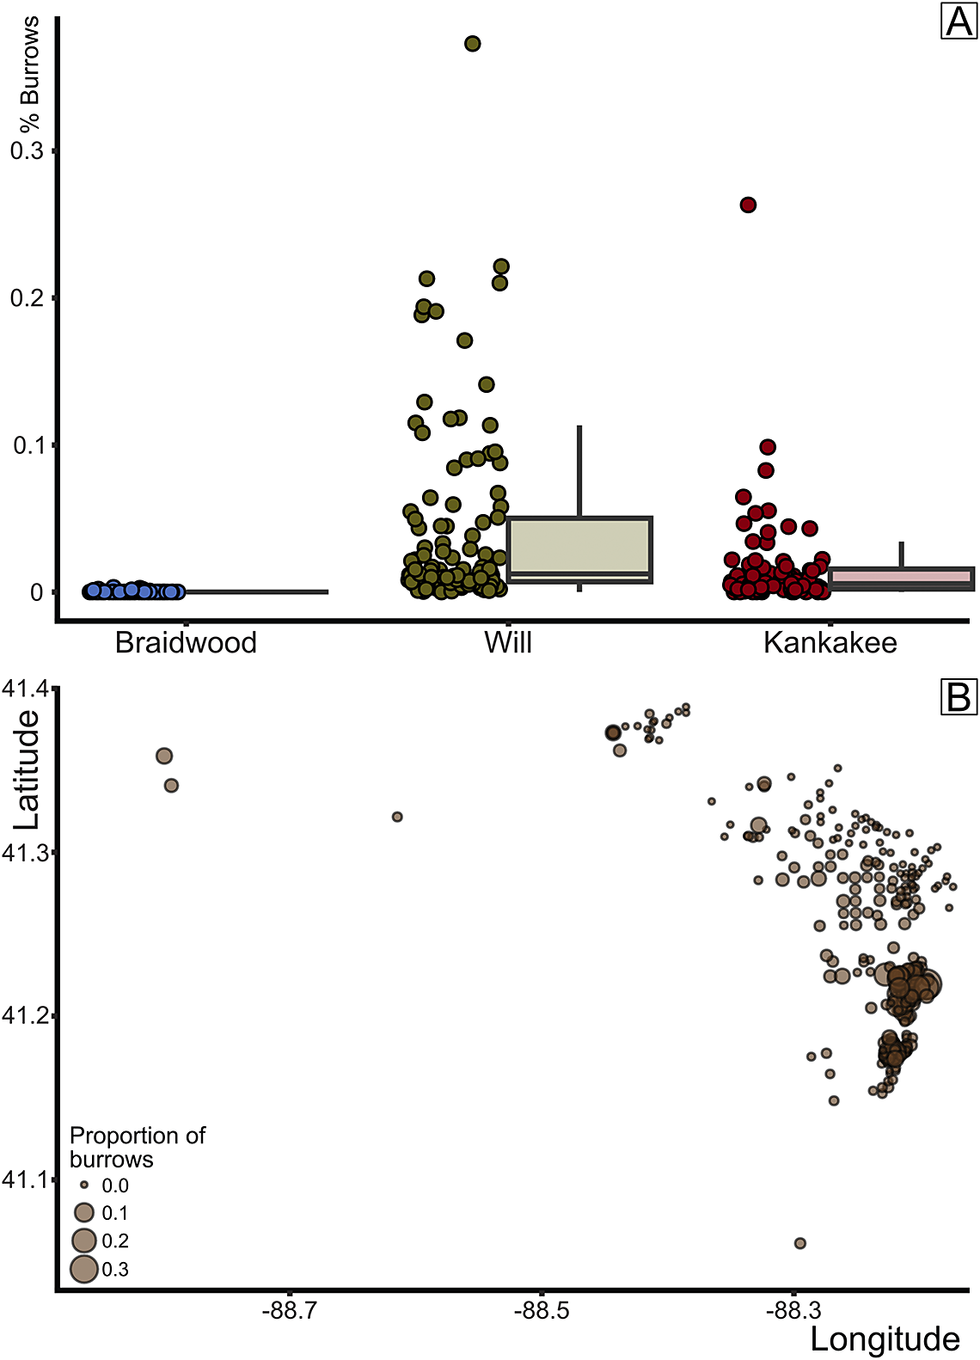
Figure 9. Percentage of burrow trace fossils by biota. A, Box plot of burrow proportion by assemblage. B, Percent burrows plotted by mapview (longitude/latitude); circle size indicates proportion of concretions with burrows.
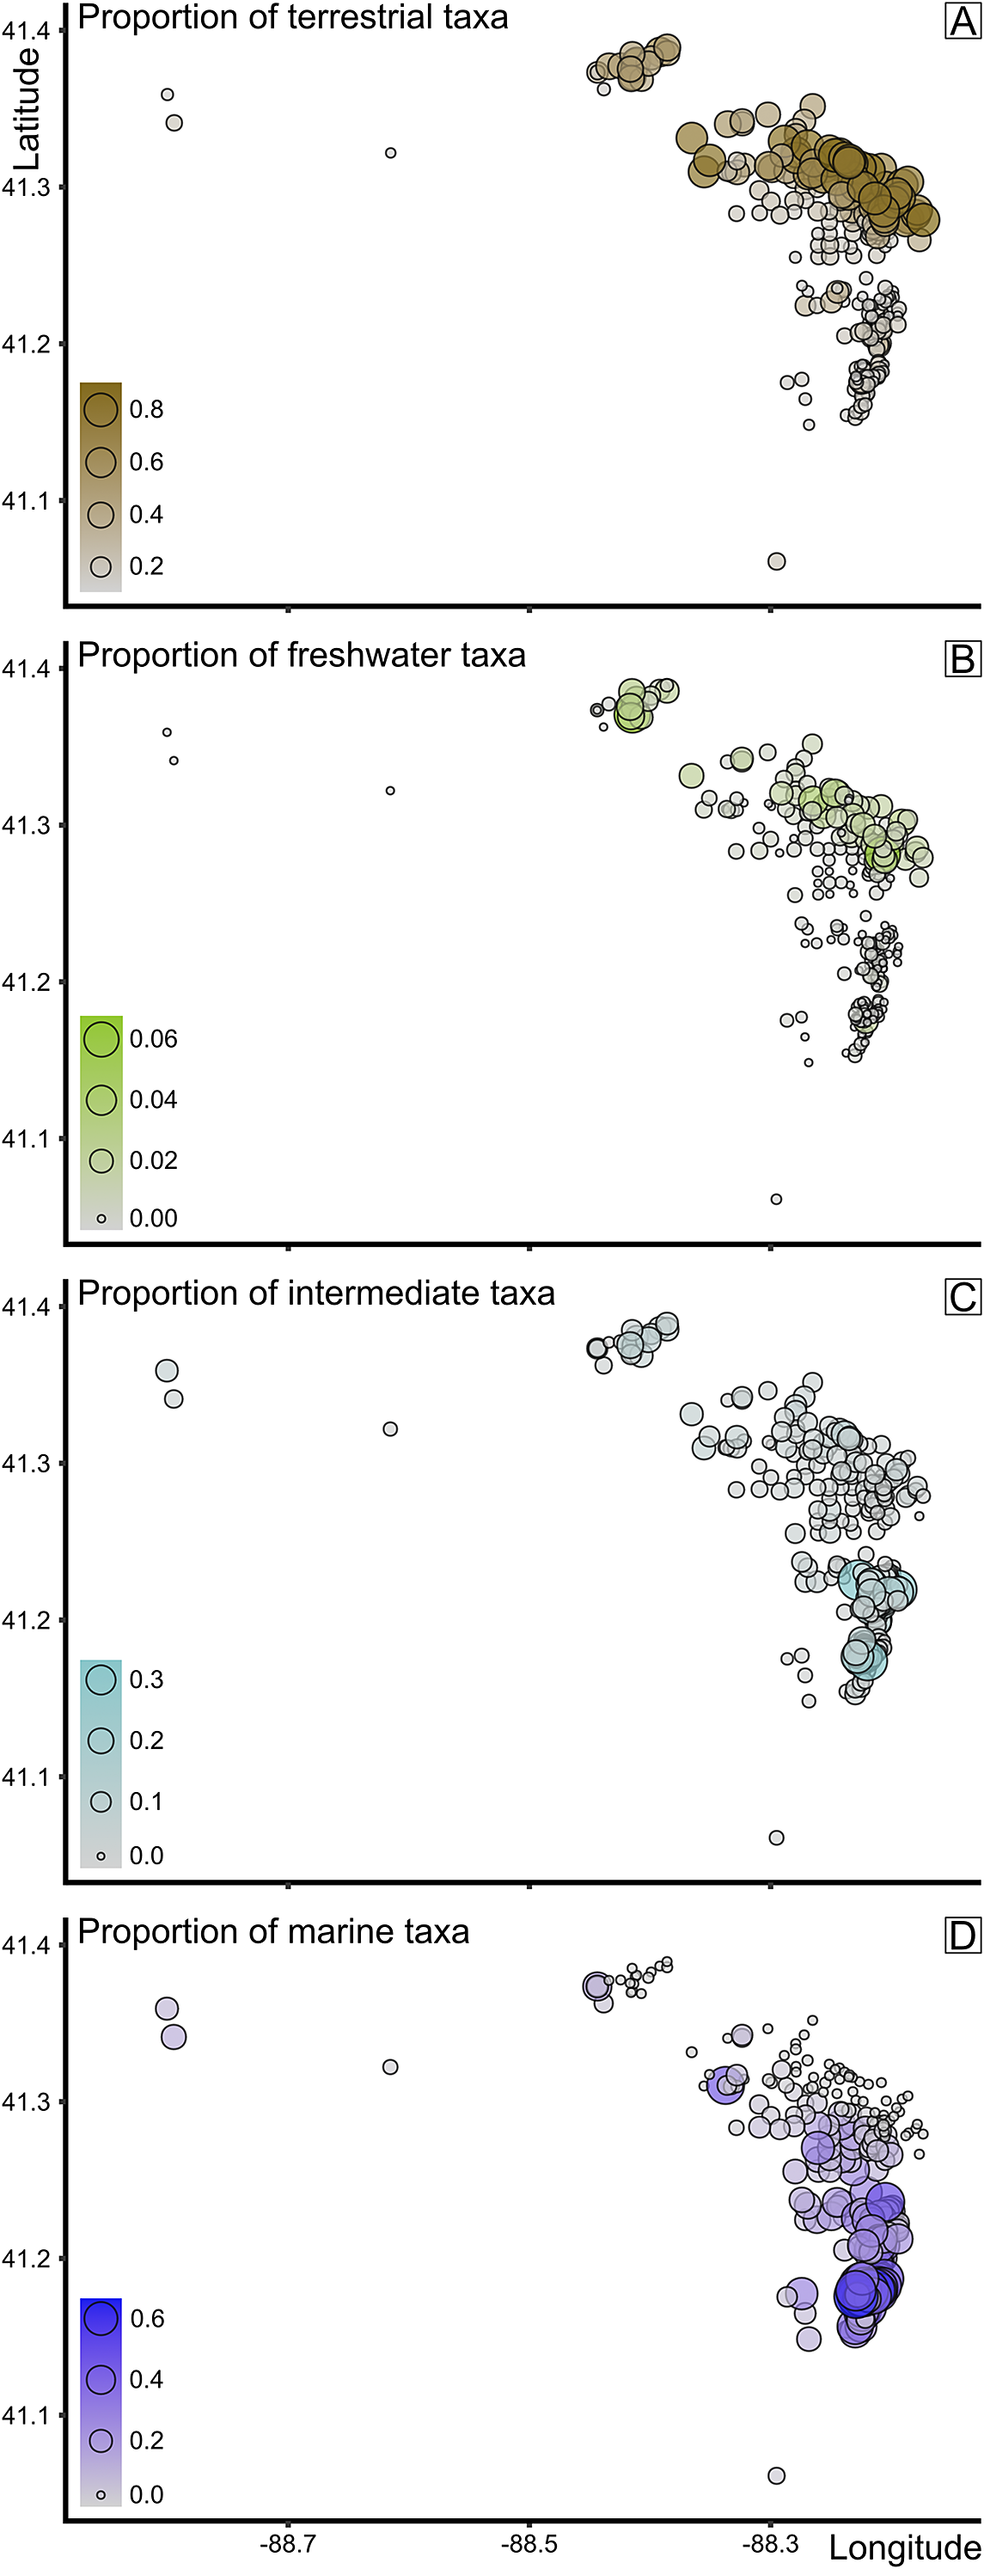
Figure 10. Proportional data in mapview of A, terrestrial taxa, B, freshwater taxa, C, intermediate taxa, and D, marine taxa. Brightness of color and size of data point both correspond to proportions, where the brighter the color and the larger the point, the higher the proportion of taxa composed of terrestrial, freshwater, and marine taxa, respectively.
While the geographic distribution of the a priori defined assemblage types is an important contextual view, we can observe this information in several different ways that remove any preconceived categorization bias. First, the significant, positive Mantel test comparing matrices of taxonomic dissimilarity and geographic distance between samples (Fig. 5) suggests that community compositions were structured by (presumably environmental) gradient(s) (e.g., see also Baird et al. Reference Baird, Shabica, Anderson and Richardson1985a: figs. 7–11). Further, when the spatial distribution of the proportion of samples composed of terrestrial, freshwater, or marine taxa is plotted (Fig. 10), a geographic distinction between freshwater and marine organisms becomes apparent. In conjunction with the map view in Figure 8, it is clear that the northeastern-most localities show higher proportions of terrestrial (Fig. 10A) and, importantly, freshwater (Fig. 10B) taxa. These localities do largely correspond to those classified as Braidwood-type assemblages, but what is of more consequence is the prominence of the sharp decline of both terrestrial and freshwater taxonomic proportions generally to the south of 41.3°N. The Morris- and Wilmington-area clusters demonstrably show very high proportions of terrestrial taxa (Fig. 10A), and these same regions show an underlying “nonmarine” (limnic to oligohaline) taxonomic component, although an order of magnitude lower. Several reasons may explain these low proportions, including being swamped by the abundance of terrestrial fossils and the expectations of lower abundances and diversity of freshwater taxa in these highly variable nearest-shore settings within the prodelta. However, what might be most striking is the conspicuous decline in nonmarine taxa (Fig. 10B), corresponding geographically to the same drop in terrestrial abundances. Simultaneously, the proportions of marine taxa increase sharply in these southern regions (Fig. 10D) with low-to-absent terrestrial and freshwater taxa, with a somewhat gradual increase to their highest proportions in Kankakee County near the town of Essex. Even in the absence of contextual geologic information from the Francis Creek Shale removed as mine overburden, the copious paleoecological data shown here confirm a geographic distinction between Braidwood- and Essex-type assemblages. The Braidwood assemblage, while rife with washed-out terrestrial components, occupied the nearest-shore settings that were home to a low diversity of freshwater organisms. The Essex assemblage was decidedly more marine influenced, with the Will-Essex assemblage largely representing a benthic assemblage of marine bivalves, along with soft-bodied sea cucumbers and worms, and the Kankakee-Essex localities capturing a sporadic benthos dominated by Essexella anemones (Plotnick et al. Reference Plotnick, Young and Hagadorn2023) and soft-bodied pelagic components like jellyfish medusae (e.g., Octomedusa and Anthracomedusa). An alternative interpretation of the Kankakee-Essex assemblage might be that it represents deeper water or further offshore regions with perhaps poor bottom-water circulation that were less favorable for diverse benthic communities. This follows Baird and colleagues’ (Reference Baird, Shabica, Anderson and Richardson1985a) hypothesis that there was an ecological subassemblage transition captured, geographically, within the localities they defined as Essex-type. They comment that the northern half of Pit 11, including most of the shaft mines between it, Braceville, and Braidwood, were dominated by benthic animals, including Mazonomya bivalves, polychaetes, and burrows, whereas south of this region in Pits 11 and 13, pelagic organisms and shrimp became more abundant. Our analyses here confirm that their intuitions were indeed correct, which we formalize into the Will- and Kankakee-Essex assemblages, respectively.
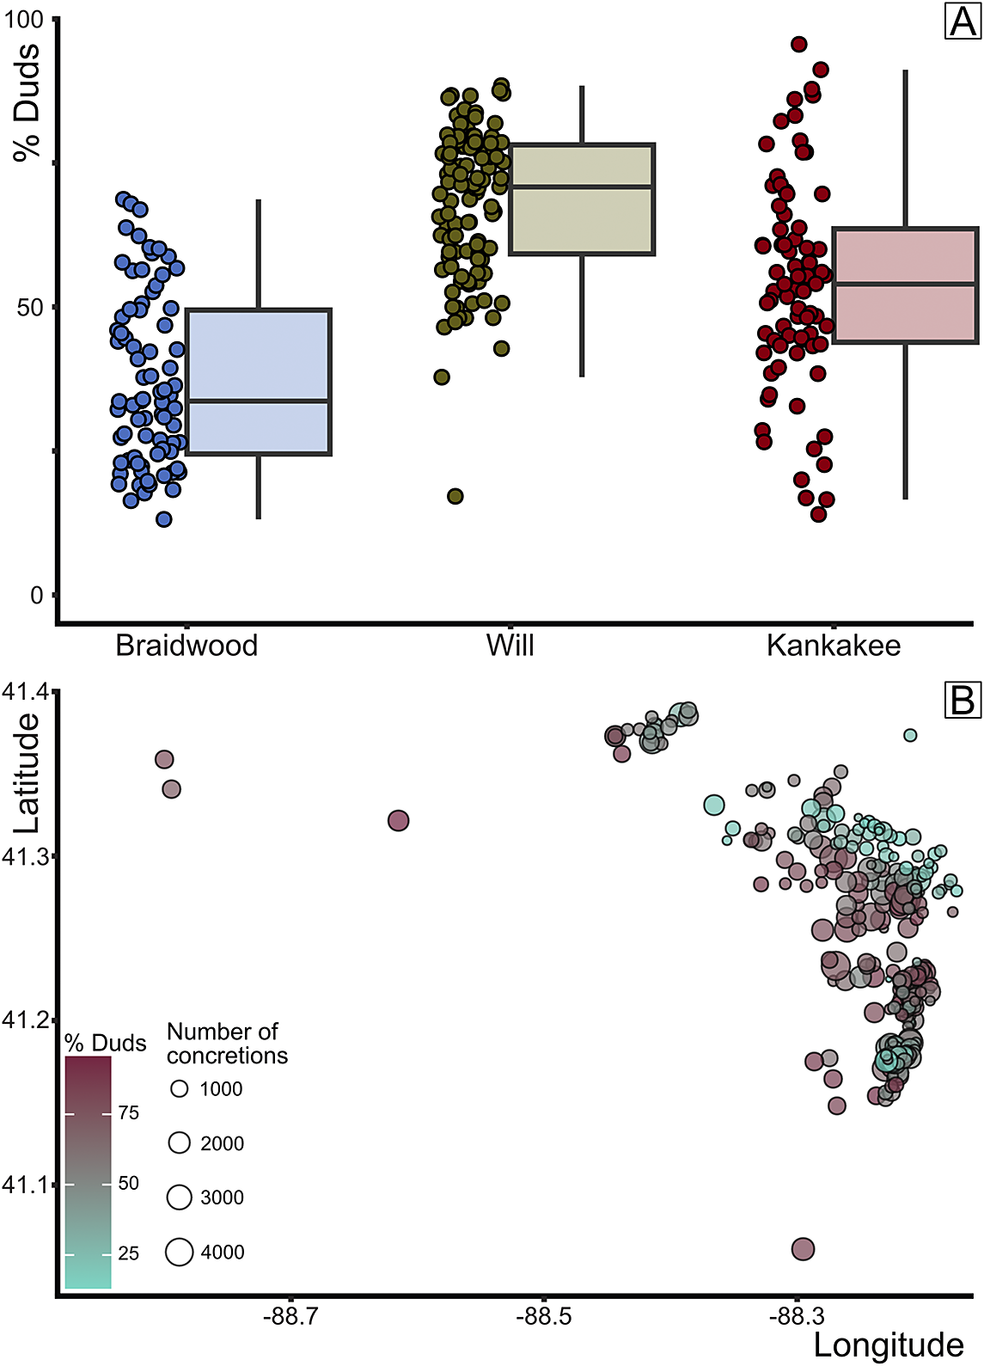
Figure 11. Analysis of duds. A, Box plot of percent duds among all collected concretions, grouped by assemblage. B, Percent duds plotted by mapview (longitude/latitude); turquoise to mauve gradient indicates increasing dud percentage, and circle size indicates the number of concretions.
Implications of Mazon Creek Paleoenvironments for Taphonomic Processes
We are additionally afforded a unique opportunity to develop a holistic taphonomic model that takes into account complementary perspectives of paleoecology and paleoenvironment. The conventional taphonomic progression proposed in Baird et al. (Reference Baird, Sroka, Shabica and Kuecher1986)—burial, microbial sulfate reduction and pyritization, siderite cementation, and sediment compaction—still holds value today, although a more nuanced view can be achieved. Furthermore, integrating the histologies of the organisms preserved across the Mazon Creek region with the likely geochemical conditions of the depositional environments in which they were captured may help to elucidate the timing of fossilization processes and other distinctions between the assemblages.
Comparable to our approach of plotting taxa by clade in the NMDS space, we took this one step further and classified each taxon by its dominantly preserved tissue type (Fig. 3B). The more recalcitrant histologies, lignin and chitin, plot more negatively along NMDS 1, whereas the soft-tissue dermis histology plots more positively. Biomineral materials can be found throughout NMDS 1, likely because both nonmarine and marine bivalves are important components across the Mazon biota and vertebrates likewise show a broad distribution. The general pattern of more robust tissues to the left and more labile tissues to the right along NMDS 1 are likely results of the abundance of recalcitrant plants and terrestrial arthropods in the Braidwood assemblage and the surplus of soft-bodied worms in the Will-Essex and cnidarian-grade organisms in the Kankakee-Essex assemblages.
Coupled with the exploration of histology, we also analyzed the percentage of dud concretions across the samples, which revealed notable differences by assemblage. By increasing percentage, the median of dud concretions equals 33.6% for the Braidwood assemblage, 53.0% for the Kankakee assemblage, and 70.0% for the Will assemblage (Fig. 11A). These differences are all statistically significant: Braidwood versus Kankakee p Wilcoxon = 1.5 × 10⁻⁷, Braidwood versus Will p Wilcoxon = 2.2 × 10⁻¹⁶, and Kankakee versus Will p Wilcoxon = 8.5 × 10⁻⁸. The geographic distribution of the percentage of concretions that are duds by sample is presented in Figure 11B. This seaward gradient showing an increase in the percentage of unfossiliferous dud concretions has been referred to as the “taphonomic discontinuity” by Clements et al. (Reference Clements, Purnell and Gabbott2019: fig. 2d), although the original taphonomic discontinuity discussed by Baird et al. (Reference Baird, Sroka, Shabica and Kuecher1986) represents a different concept. Rather than a distal increase in dud concretions, Baird et al. (Reference Baird, Sroka, Shabica and Kuecher1986) describe a barren lateral, fossil-poor zone within detrital wedges and regressive shales positioned between the delta and distal-shelf facies. These facies belts are often nearly devoid of fossils—concretion-hosted or not—with the exception of coprolites and lebensspuren as represented by the “Danville association” (Baird et al. Reference Baird, Sroka, Shabica and Kuecher1986), noted farther south in Danville, Vermilion County, Illinois. Danville-grade associations are tentatively understood to border deposits displaying calcareous-shelled stenotopic taxa of the open shelf. From our analyses, the observable increase in the proportion of empty concretions occurs not in the most distal Kankakee-Essex units, but rather in the marginal Will-Essex deposits, contra Clements et al. (Reference Clements, Purnell and Gabbott2019). By instead plotting the geographic positions of the localities excluded by our data-culling procedure, or those with very few (>50) concretion-hosted fossils, we might gain some additional insight into the spatial positioning of taphonomic discontinuities (Fig. 12). For instance, while several fossil-poor sampling sites exist westward in Lasalle County, between Seneca and Ottawa (sites to the west of label 1 in Fig. 12), there are also dense clusters of exceptionally dud-rich samples in and around the Braidwood deposits near Morris (label 1), among the Braidwood-Will transition in eastern Grundy County (label 2), and in a north-south trending transect in deposits toward the eastern interior of southern Will and northern Kankakee Counties near the town of Essex (label 3). The excluded sampling sites are not necessarily devoid of concretions, with some reaching several hundred (>700) empty concretions collected. Nevertheless, this serves to reiterate that the “glass in the Mazon Creek taphonomic window” (Baird et al. Reference Baird, Sroka, Shabica and Kuecher1986: p. 283) through which we can view these late Carboniferous ecosystems is truly provided by the concretions.
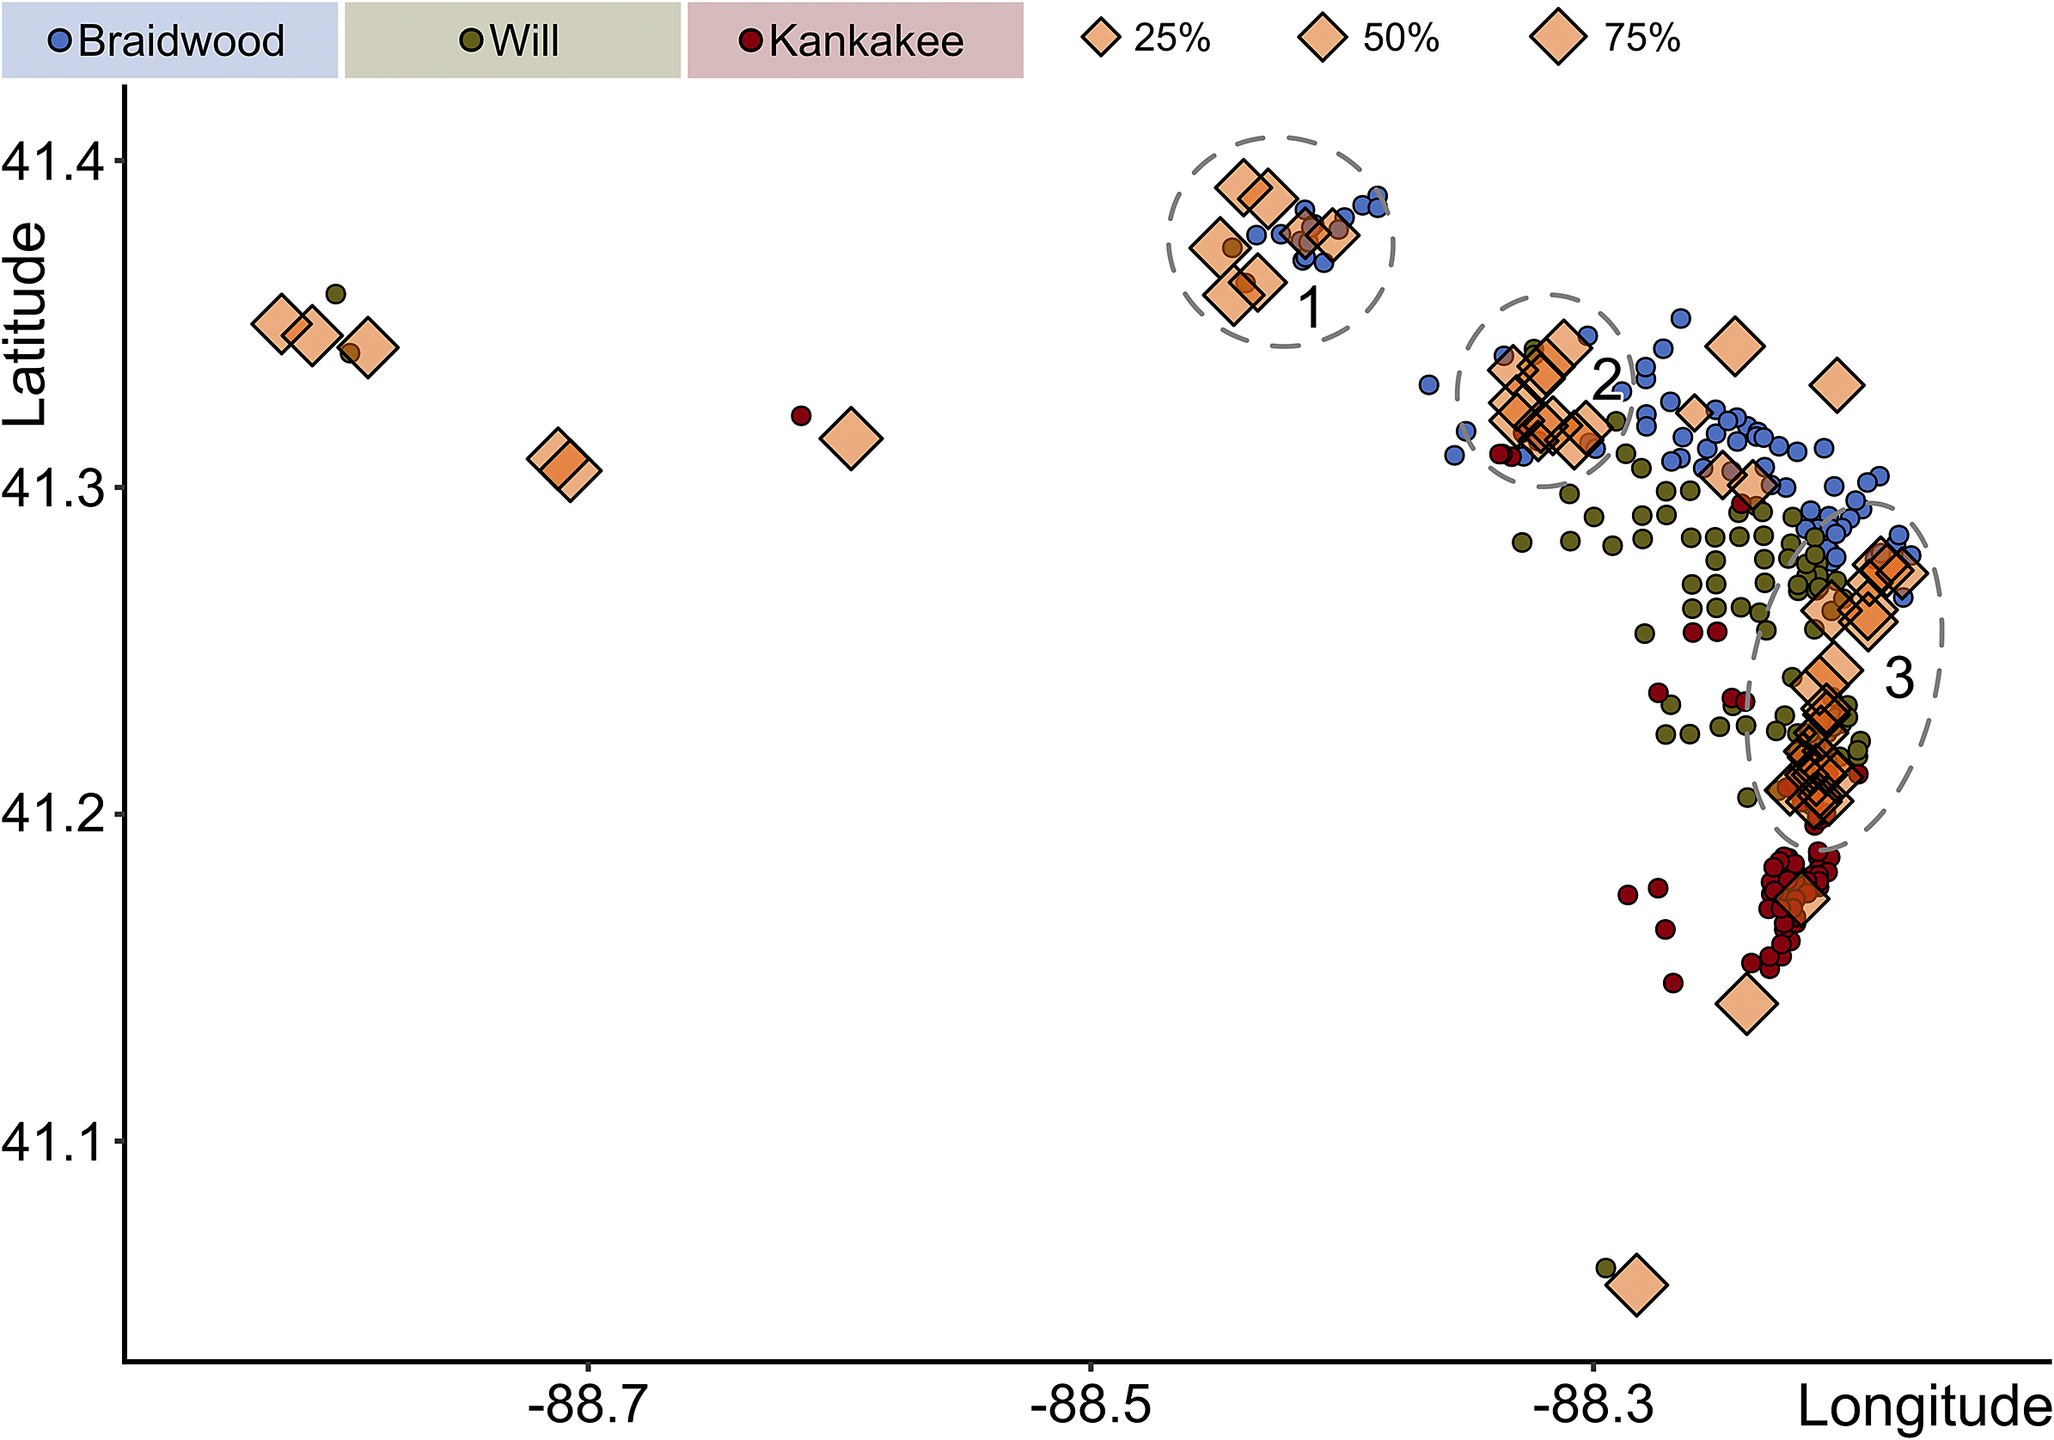
Figure 12. Map showing excluded sampling localities (orange diamonds) during the data-culling process. Size of diamond corresponds to percentage of concretions represented by duds at that locality. Dashed ovals, 1 through 3, correspond to regions with localized clusters of fossil-poor sites: 1, Morris region in Grundy County; 2, eastern-most Grundy County; and 3, north-south transect through southwest Will County and northwest Kankakee County.
The last question that we ask from our analyses regards taphonomy: can the spatial distribution of flora and fauna from the three Mazon assemblages, along with information inferred from their paleoenvironments, inform us about the tempo and mode of preservation? We believe the answer is yes for the following reasons.
First, while we cannot rule out the influence of intermittent storm events, we can infer that relatively little consistent transport has taken place other than that of the allochthonous terrestrial components being transported to aquatic, or in rare cases marine, environments. This is supported by the burial of some organisms oblique to bedding, which can imply in situ burial and possibly even death by sediment smothering. Further, the recent reenvisioning of Essexella as an anemone rather than a medusan (Plotnick et al. Reference Plotnick, Young and Hagadorn2023) invokes in situ and in vivo burial positions in many cases, and thus the lack of significant transport is not just restricted to the high sediment flux environments of the nearest-shore delta fronts. Death of the Mazon organisms can happen from many causes, not least among them being sediment smothering, high fluctuations in salinity, or episodes of anoxia- or dysoxia-associated eutrophication (e.g., see Bailey Reference Bailey2011). An important distinction to draw, however, at least for its taphonomic implications, is the type of environment in which the burial occurs. Braidwood settings represent burial under fresh-to-brackish water conditions. In similar modern settings, these environments often represent the highest sedimentation rates and greatest sediment flux in deltaic systems and also provide an abundance of continental weathering–derived dissolved ions. Against the backdrop of high atmospheric oxygen levels in the Carboniferous (e.g., Brand et al. Reference Brand, Davis, Shaver, Blamey, Heizler and Lécuyer2021), these burial environments were initially oxic with neutral to slightly acidic pH values, if comparable to modern riverine or deltaic systems (Garrels and Christ Reference Garrels and Christ1965). Conversely, the Essex settings probably had lower sedimentation rates, lower ion influx, and a slightly basic pH—but their oxygen content at the spatiotemporal moment of burial may have been distinct between the Will and Kankakee localities, with the benthos of the Will being suggested as low to dysoxic in oxygen concentration (Bailey Reference Bailey2011), supported by the presence of bioturbators (Fig. 9) but also dysoxia-tolerant bivalves. Thus, while our burial environments start with the same general redox potential, ranging from oxic to marginally dysoxic, they would have differed in pH space (see Fig. 13 for generalized background geochemical constraints in the Mazon settings), which may affect the onset and progression of early mineralization processes involved in preservation.
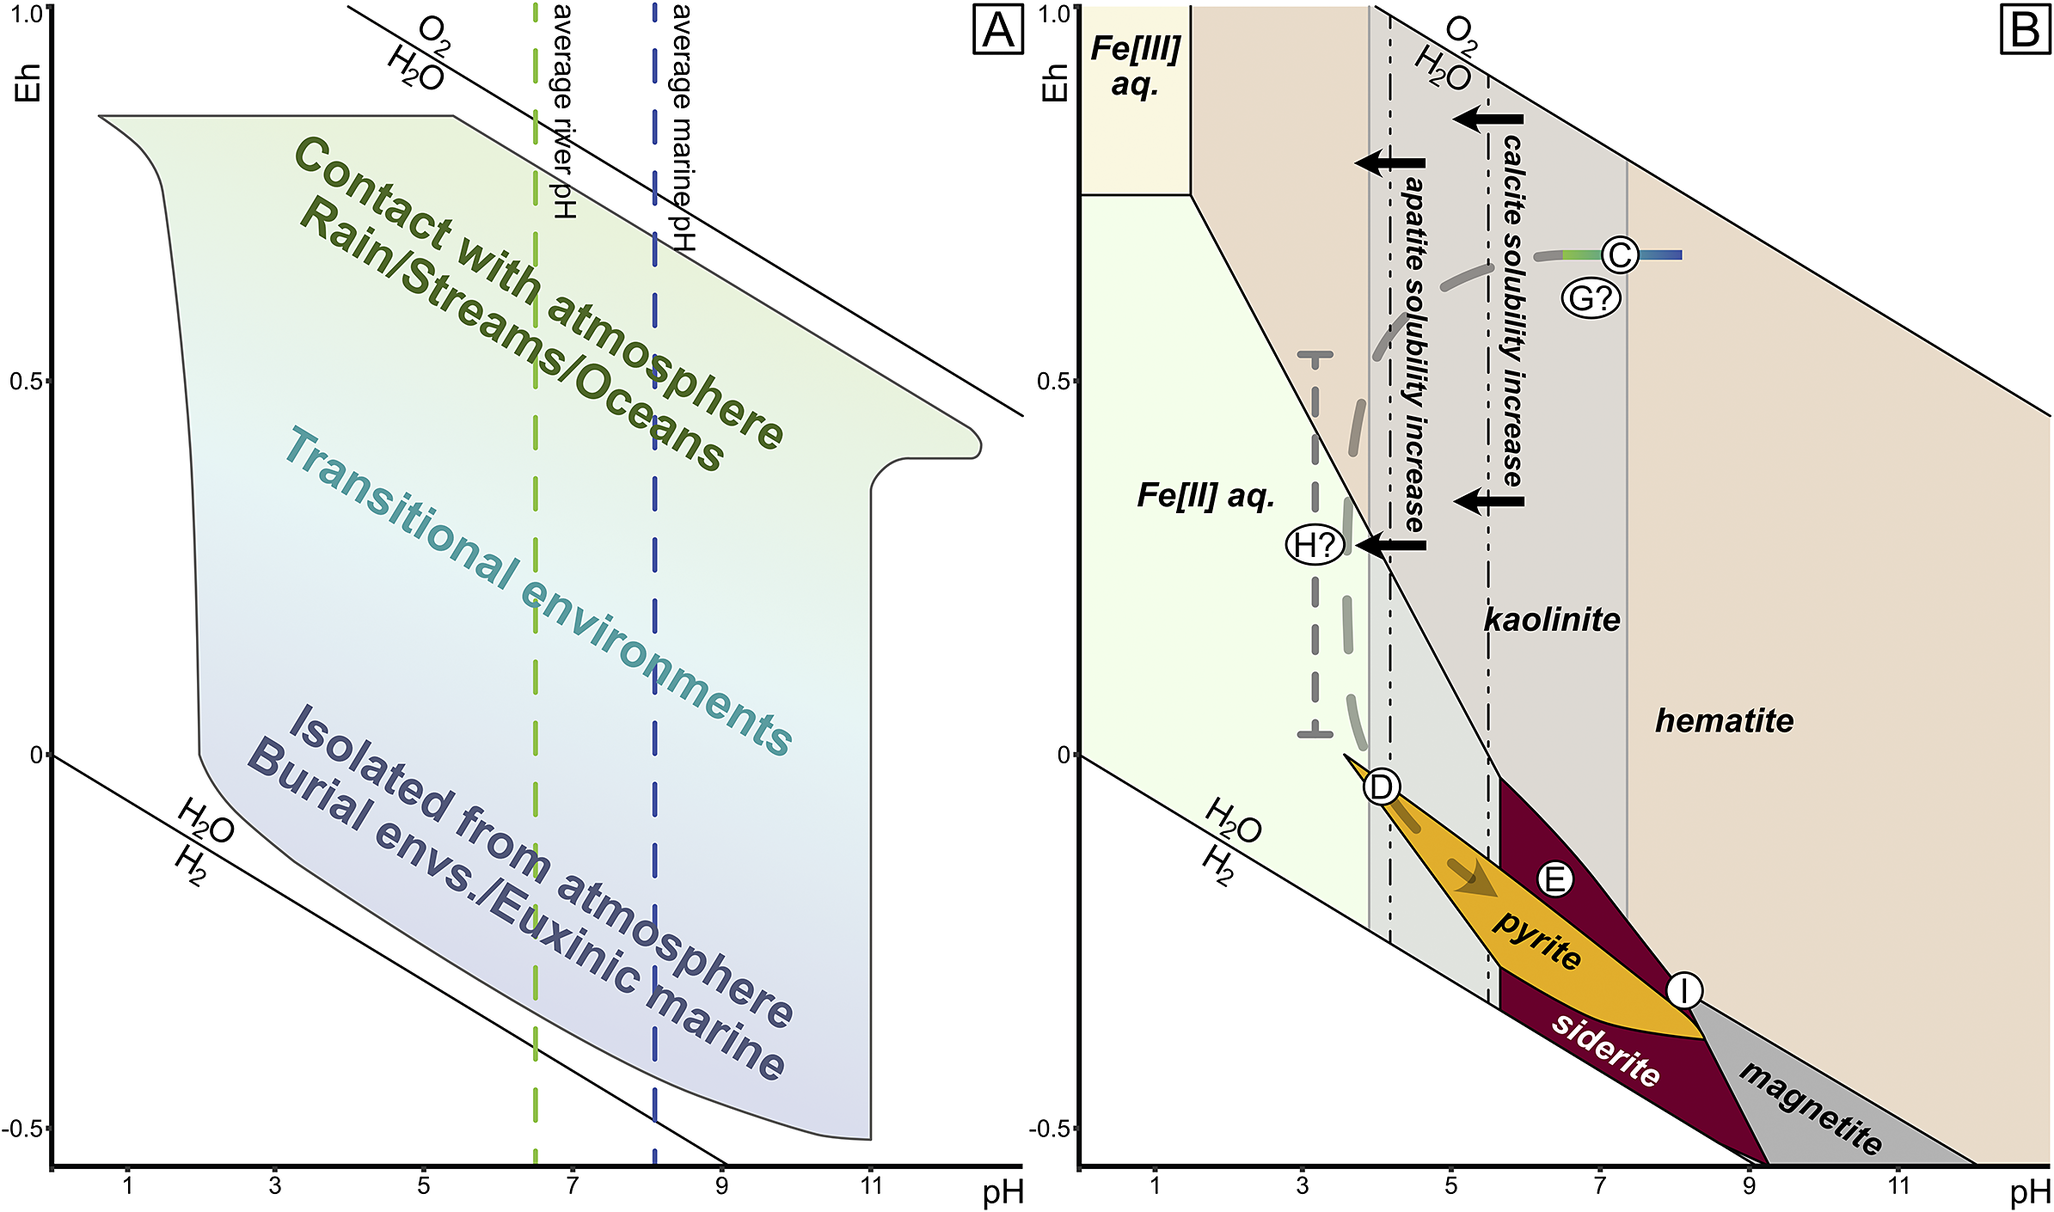
Figure 13. Geochemical constraints of Mazon preservation. A, Eh-pH space of aqueous systems after Garrels and Christ (Reference Garrels and Christ1965), with surface waters at the top and isolated burial environments at bottom. B, Eh-pH space of iron mineralization, including pyrite (gold) and siderite (maroon) at bottom. Kaolinite clay also highlighted in gray. Hypothetical pathway through Eh-pH space of Mazon Creek organisms shown in dashed gray curve, with circled letters corresponding to taphonomic sequence in Fig. 14.
One notable effect from the difference of sedimentation rates between the delta front (Braidwood) and marine benthos (Essex)—excluding storm-induced obrution events—would be the exposure time of dead and decaying carcasses on the seafloor, which would affect soft-tissue preservation and the extent of seafloor scavenging. For example, Baird et al. (Reference Baird, Sroka, Shabica and Kuecher1986) noted a range of preservation of Essexella, from very well-preserved and ornamented specimens to more cryptic blobs, some associated with intense microburrowing. In some larger Essexella, selective consumption can be observed, such that the organism itself is burrowed and taphonomically “erased,” but the surrounding concretion matrix remains unborrowed, which may indicate that the burrowers feasted until they were trapped by siderite mineralization within the evolving nodule. Nevertheless, the range of taphonomic fidelity observed in soft-bodied organisms is likely a direct result of duration of post-death exposure and variability in burial rate (e.g., Plotnick et al. Reference Plotnick, Young and Hagadorn2023) in the seaward Essex localities. In short, the longer a carcass spends unburied, the more biological information that can be lost from decay and scavenging activities, and the lower taphonomic fidelity of individuals and the assemblage. Conversely, in the delta front setting with very high sedimentation rates, dead organisms would not spend much time uncovered on the seafloor, if any time at all, considering that many were smothered in vivo as evidenced by attempted escape fugichnia or other abnormal death postures (Baird et al. Reference Baird, Sroka, Shabica and Kuecher1986). Combined with this, the organisms captured in the nearshore Braidwood assemblages generally exhibit more recalcitrant tissues, such as lignin, cellulose, and chitin, which have an easier path toward entering the fossil record from their higher resistance to decay. The comparative lack of such robust tissues in many of the Essex sites indicates that they were truly absent and not taphonomically excluded. We cannot speak to the nature of burial in each individual case, such that there were likely some Essex organisms buried quickly and vice versa some Braidwood organisms allowed to decay on the seafloor for an extended period of time. Instead, our inferences here are based on suppositions of mean burial rates of the assemblages on the whole.
Pyritization was the first taphonomically valuable diagenetic process (see Fig. 14 for taphonomic model and sequence). Pyritization usually proceeds from focused microbial sulfate reduction (MSR) on buried organics (e.g., Raiswell et al. Reference Raiswell, Whaler, Dean, Coleman and Briggs1993; Xiao et al. Reference Xiao, Schiffbauer, McFadden and Hunter2010; Farrell Reference Farrell2014; Schiffbauer et al. Reference Schiffbauer, Xiao, Cai, Wallace, Hua, Hunter, Xu, Peng and Kaufman2014; Tomašových et al. Reference Tomašových, Berensmeier, Gallmetzer, Haselmair and Zuschin2021); in the absence of significant organics in the surrounding sediment, the buried carcass could quickly become the carbon locus for MSR. While this would have more likely been the case for the marine Essex regions, sulfate-reducing microbes in the delta front Braidwood regions would have had an influx of excess terrestrial organics, and thus MSR might not have been as localized to only carcasses, at least at the onset of burial. In either setting, however, MSR should have proceeded relatively uninhibited by the concentration of sulfate early in the taphonomic sequence, generating a diffusion–precipitation front that would form radiating outward from the carcass (Raiswell et al. Reference Raiswell, Whaler, Dean, Coleman and Briggs1993; Xiao et al. Reference Xiao, Schiffbauer, McFadden and Hunter2010). Within this anoxic microenvironmental envelope, sulfide species (either hydrogen sulfide, H2S, in the fresh- or brackish-water settings with pH below 7; or bisulfide, HS−, in the marine settings with higher pH) would diffuse outward until meeting inward diffusion of dissolved reactive iron (aqueous Fe[II]), which should be in reasonably high concentrations sourced from terrestrial weathering and supplied by the delta or alternatively expelled from decay of the underlying peat layer. At this chemical interface, pyrite will readily precipitate. As viewed in μCT imaging (Fig. 15), 3D pyrite halos are frequently present and take many different forms, ranging from carcass-shaped oblate ovoids to more disseminated pyrite throughout the concretion. Such halos were also two-dimensionally observed via scanning electron microscopy by Cotroneo et al. (Reference Cotroneo, Schiffbauer, McCoy, Wortmann, Durroch, Peng and Laflamme2016) and confirmed to be pyrite in mineralogy. Herrara et al. (Reference Herrera, Hotton, Smith, Lopera, Neander, Wittry, Zheng, Heck, Crane and D’Antonio2023) also note the presence of taphonomically associated pyrite within their scanned Mazon Creek plant materials, although the mineralization appears to be immediately proximal to the plant tissues rather than dispersed into halos or larger pyrite masses farther into the concretion periphery as observed here. The onset of pyritization may occur later in the marine environment as compared with nearshore, owing largely to slower burial rates and thus protracted entrance into the MSR zone, although this also presumes that at least some of the biomass of the buried organism remains through early burial (e.g., it is not scavenged or too extensively degraded). However, MSR (and as a result, pyritization) would have likely been more diffuse in the earliest taphonomic stages in the Braidwood settings because of the abundance of buried organics. At least the Braidwood organisms were more likely to be rapidly buried and thus protected from more aggressive aerobic decay processes and, with the highest presumed sedimentation rates, activity of scavengers and/or bioturbators. This would not have been the case in the Essex localities, where elongated exposure to aerobic decay processes on the seafloor would have degraded unburied remains and removed many others. Although raw fossil counts and taxonomic richness (Fig. 6) from the marine Will- and Kankakee-Essex localities do not necessarily support the latter possibility, the higher proportion of dud concretions may (Fig. 11), whereby the empty concretions plausibly followed the same taphonomic pathway as fossiliferous concretions, but the enveloped organism decayed beyond recognition. It is also worth noting that siderite pseudomorphs after pyrite are abundant in fossiliferous Essex concretions (Bailey Reference Bailey2011), which may suggest that some organisms quickly promoted a reducing and anoxic microenvironment around the decaying carcass from the work of the sulfate-reducing microbes. Nevertheless, the similarity of pyrite halos observed in both Braidwood and Essex representatives through μCT imaging should imply that the stages within the taphonomic pathway experienced in each locality were comparable, even if the timing of these stages may have varied as a function of paleoenvironment.
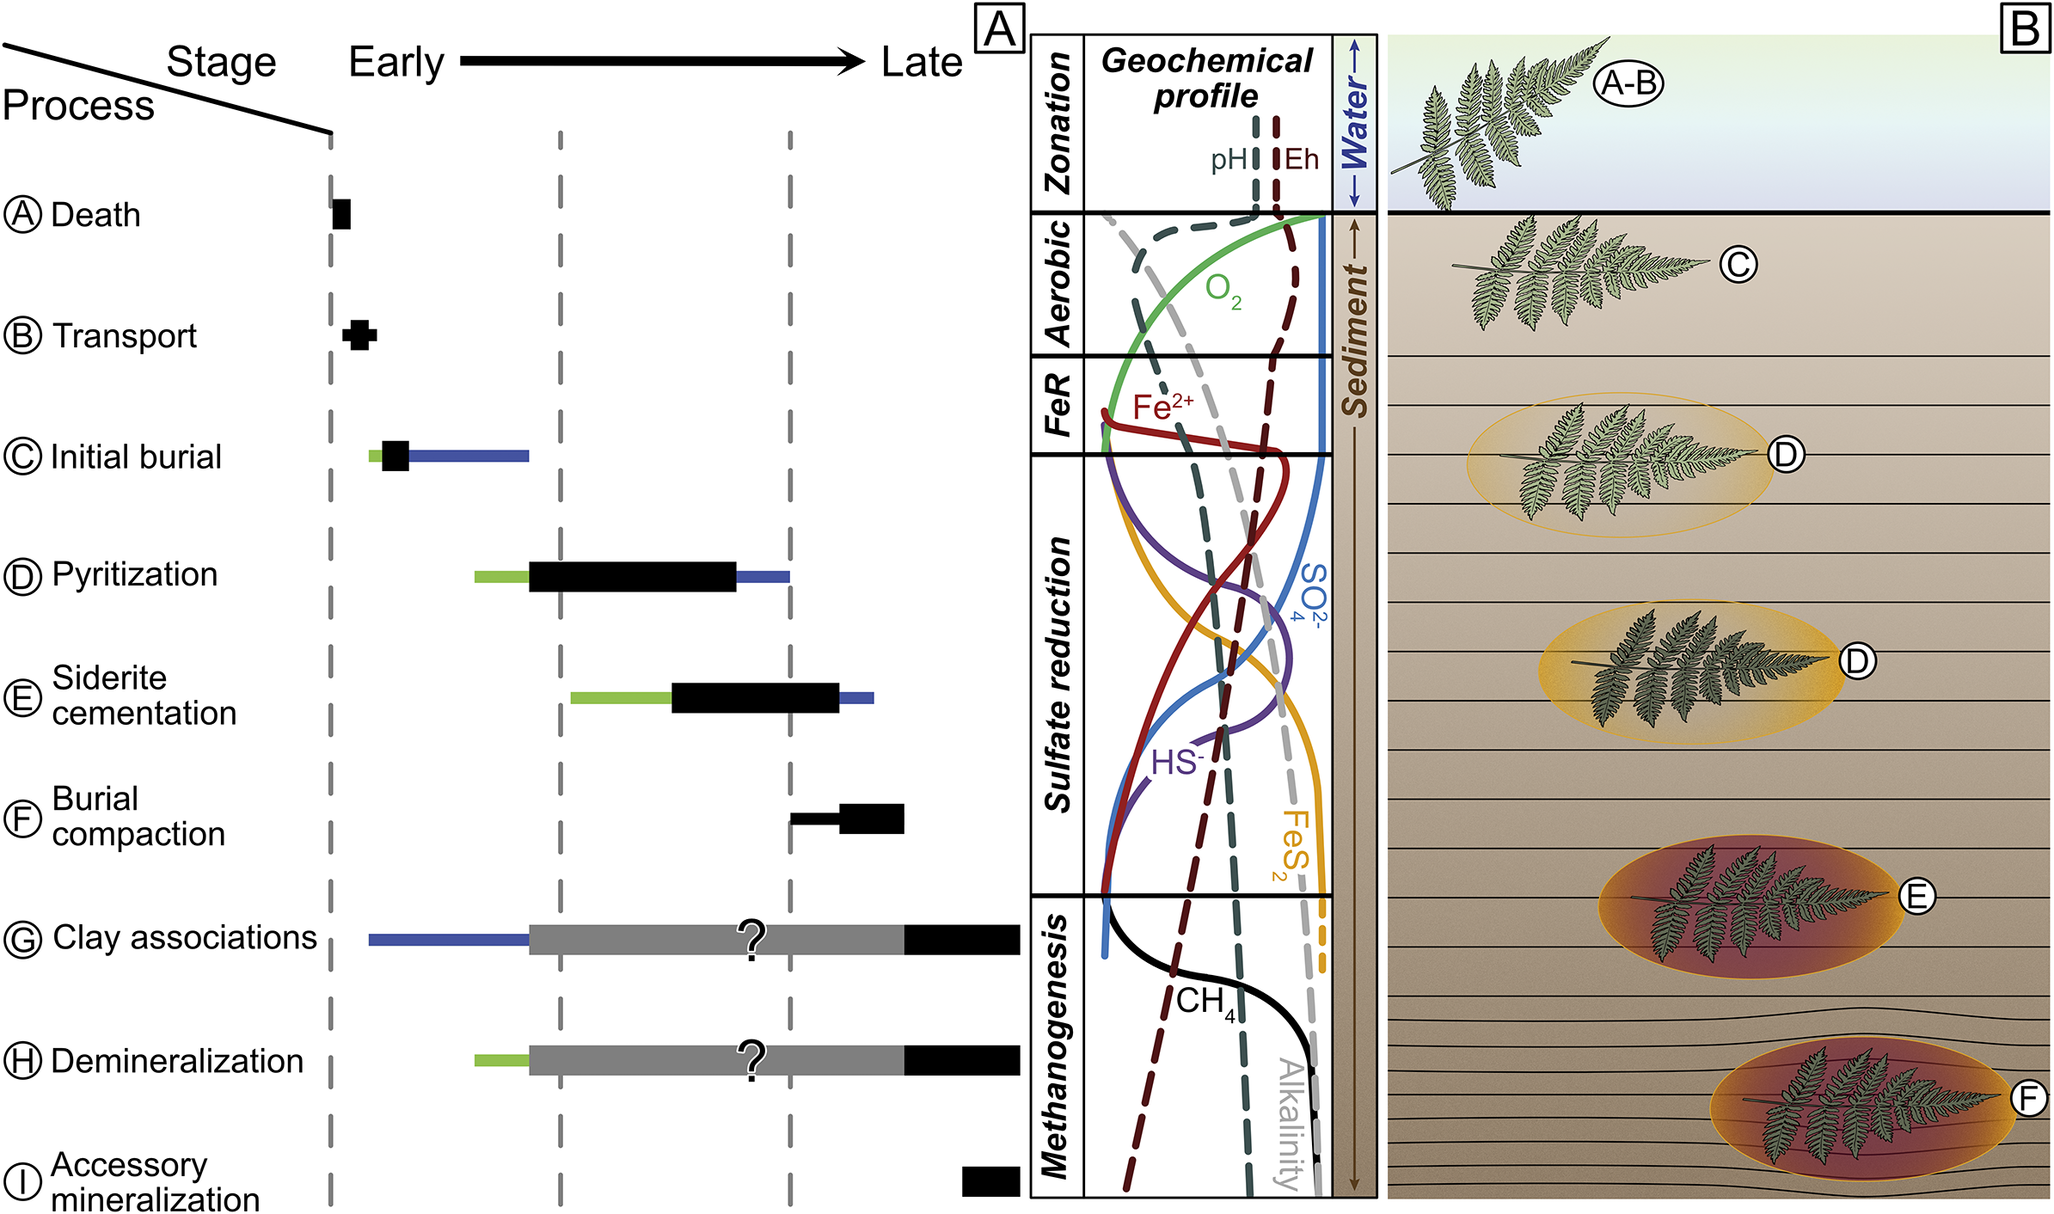
Figure 14. Taphonomic model of Mazon preservation A, Paragenetic sequence diagram of Mazon taphonomy including all steps in the formation of Mazon Creek concretions, even those with uncertain timing or preservational influence (clay associations and demineralization). Thick black bars indicate more certain timing, extensions of smaller black bars show some uncertainty, and gray bars are decidedly uncertain. Extensions of blue or green bars suggest longer durations of processes in either marine or freshwater systems, respectively. B, Geochemical and microbial zonation profile after Schiffbauer et al. (Reference Schiffbauer, Xiao, Cai, Wallace, Hua, Hunter, Xu, Peng and Kaufman2014) and Muscente et al. (Reference Muscente, Schiffbauer, Broce, Laflamme, O’Donnell, Boag and Meyer2017) and equivalent space of Mazon Creek organism burial, with circled letters corresponding to taphonomic sequence in Fig. 13.
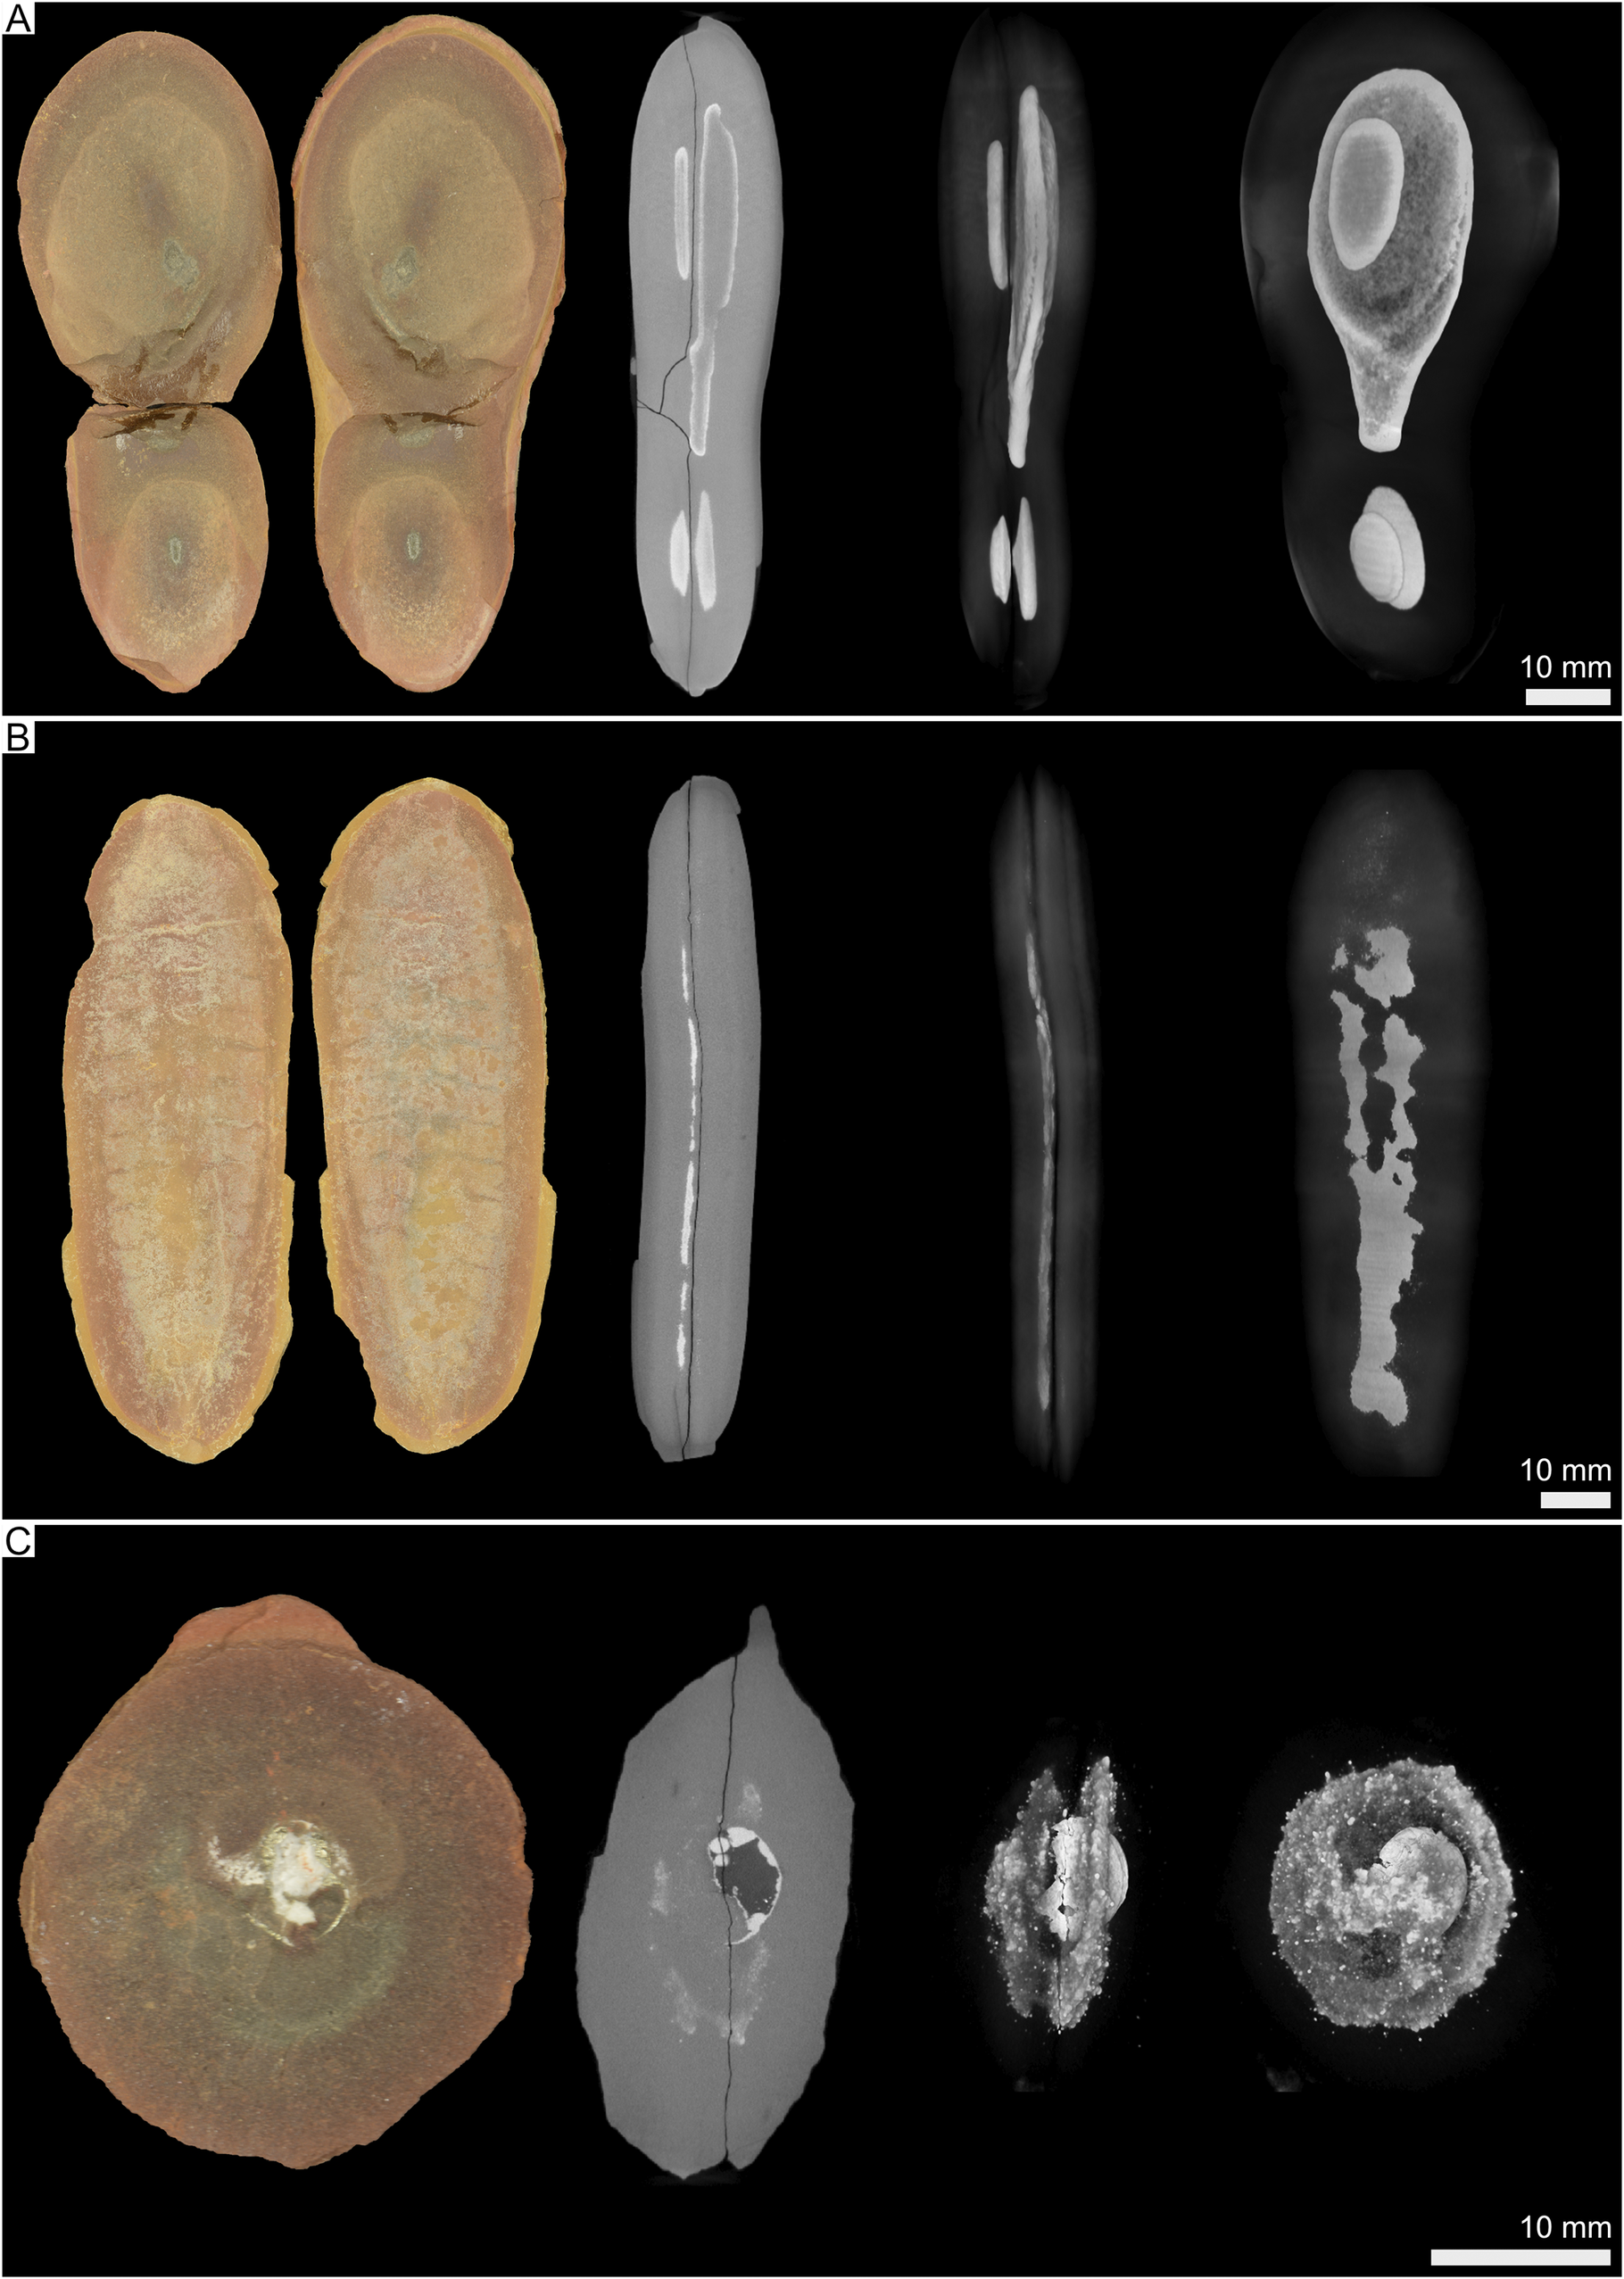
Figure 15. X-ray tomographic data of Mazon fossil concretions showing light image, 2D slice image, and 3D renders of internal pyritization in both side and oblique profiles. A, Sample P11-INHS-25, Essexella. B, UImX-7636, Tullimonstrum. C, UImX-8488, mollusk. Scale bars are applicable across all images within each frame.
Successively, the transition to siderite mineralization should occur once the sulfate supply was exhausted, either by the work of the microbes or with greater burial depth from continued sedimentation, thus moving the proto-concretion out of the MSR zone (Woodland and Stenstrom Reference Woodland, Stenstrom and Nitecki1979; Baird et al. Reference Baird, Sroka, Shabica and Kuecher1986; Cotroneo et al. Reference Cotroneo, Schiffbauer, McCoy, Wortmann, Durroch, Peng and Laflamme2016). High sedimentation rate would again account for moving Braidwood carcasses through the MSR zone and into sulfate-free sediment quickly, whereas the Essex carcasses might spend more time in the MSR zone. This should be testable by comparing bulk pyrite abundance in Braidwood versus Essex nodules and is perhaps a hypothesis that can be addressed by continued μCT imaging. The presence of sulfur poisons the precipitation of siderite, and thus the cementation of the concretions must have followed any production of pyrite. Further, siderite forms pervasively, with simultaneous nucleation and precipitation of siderite in the enclosing sediment, rather than precipitating in a concentric manner (Raiswell and Fisher Reference Raiswell and Fisher2000). Therefore, it would have filled pore spaces surrounding the carcass reasonably quickly once sulfate and/or sulfide were exhausted. The region of siderite precipitation was perhaps bounded by the decay microenvironment around the carcass, with increasing burial alkalinity and bicarbonate (HCO3−, the ion favored across the expected range of fresh/brackish to marine pH) possibly sourced from terrestrial runoff or the dissolution of shelly or bony materials. The cessation of siderite cementation likely resulted from the local exhaustion of bicarbonate or Eh fluctuations, as suggested by Schopf (Reference Schopf and Nitecki1979). It is interesting to note that many shelly fossils in the Mazon concretions have little to no shell remaining, and sometimes vertebrates are even missing evidence of bone preservation (Bailey Reference Bailey2011). These missing biominerals are usually replaced, reprecipitated, or preserved in moldic fashion (Baird et al. Reference Baird, Sroka, Shabica and Kuecher1986; Bailey Reference Bailey2011). This suggests that such carcasses spent an interval of time at a pH lower than 5.5 for calcareous shells or 4.0 for apatite bone, although the timing of biomineral dissolution is not well constrained. Similarly, many Mazon fossils have associations with kaolinite or other aluminosilicate clays, along with some other accessory sulfide minerals like sphalerite [(Zn,Fe)S] and galena [PbS]. The timing and taphonomic influence of authigenic clay emplacement have been contentious elsewhere in the Paleozoic (e.g., Orr et al. Reference Orr, Briggs and Kearns1998; Gaines et al Reference Gaines, Briggs and Yuanlong2008; Anderson et al. Reference Anderson, Tosca, Gaines, Koch and Briggs2018), and its origin in the Mazon seems also to be problematic, although it commonly forms as either fossil-surface coatings or void fillings (Baird et al. Reference Baird, Sroka, Shabica and Kuecher1986). Less questionably, the accessory sulfide minerals sphalerite and galena, which also occur as void fills, are presumed to be later in the diagenetic sequence (Baird et al. Reference Baird, Sroka, Shabica and Kuecher1986) and taphonomically unimportant. These voids may occur from demineralization of biological materials, along with other later diagenetic processes like syneresis or desiccation cracking. Nevertheless, when siderite cementation forms the concretion, it becomes compression and compaction resistant, evidenced by warping sediment laminae around concretions observed in outcrop, sealing off and protecting the fossil within.
Conclusions
In resurrecting the raw concretion data and associated metadata from the publications of the mid-1980s by Baird and colleagues (Reference Baird, Shabica, Anderson and Richardson1985a,Reference Baird, Sroka, Shabica and Beardb, Reference Baird, Sroka, Shabica and Kuecher1986), we have been able to statistically corroborate the appropriateness of two regional distinctions in Mazon Creek fossil assemblages, the nearshore Braidwood and marine Essex assemblages. The Braidwood assemblage is characterized by terrestrial fauna and flora, which exist as allochthonous components washed in to an estuarine coastal system, but there is a real, underlying, but low-diversity and significantly understudied aquatic assemblage that signifies deposition in a fresh-to-brackish setting. Moreover, our investigation supports the further division of the Essex assemblage into two subassemblages: (1) the benthic Will-Essex, dominated by clams and traces and likely representing a transitional assemblage between nearshore and offshore deposits; and (2) the Kankakee-Essex, instead largely consisting of cnidarians, and representing an undoubtedly marine ecosystem.
The differences in paleoenvironment between the Braidwood and Essex localities should impart some taphonomic distinctions as well, largely related to depositional geochemistry, burial rate and decay exposure, and tissue histology. The organisms captured in the Braidwood assemblage are composed of more resistant tissues on the whole, although their burial should be the most rapid as well. Both of these factors should help ensure that the Braidwood fossils are exceptionally well preserved. Moving seaward, however, a larger constituent of the Essex assemblages becomes composed of more labile, easily decayed tissues, and the burial rate is presumably slower, leaving more time for aerobic decomposition. Simultaneously, the Essex localities show a higher proportion of dud concretions, which is the apparent record of excessive decay beyond the point of taxonomic resolvability. This paleoecologically refined taphonomic model thus helps to holistically explain the distribution of organisms, concretions, and fossil fidelity among the Mazon Creek localities.
Acknowledgments
A.D.M. acknowledges support from the Cornell College Summer Research Institute. J. F. Z. DeBrower, A. S. Harwood, and L. M. Zonarich are thanked for their contributions to data formatting and initial exploration; and S. Rosbach and D. Maverick are acknowledged for their contributions to initial μCT data exploration. J.D.S. acknowledges conversations with M.S. Appold that helped shape thoughts of aquatic-to-marine geochemical transitions. J.D.S. and T.S. were supported by the National Science Foundation, EAR Instrumentation and Facilities Program (NSF# 2242732). J.D.S. was supported by the National Science Foundation, EAR SGP CAREER (NSF# 2319423). J.W.H. was supported by the National Science Foundation, EAR SGP CAREER (NSF# 1650745) and SGP (NSF# 2409210). M.L. thanks the National Science and Engineering Research Council of Canada (NSERC RGPIN435402). G.C.B. was initially supported by the National Science Foundation grant no. EAR 257029, commencing in 1979 to complete a census of Mazon Creek fossil organisms across the entire Mazon Creek area and to produce initial metadata analysis. The resulting data serve as the basis of further multivariate analyses presented here. Finally, we would like to thank E. Saupe, G. Slater, R. Plotnick, and two anonymous reviewers for constructive feedback and assistance that greatly benefited the quality of this report.
Competing Interests
The authors declare no competing interests.
Data Availability Statement
Data are available from the Dryad data repository https://doi.org/10.5061/dryad.z8w9ghxr2. Supplementary Material (Supplementary Appendix 1, Supplementary Appendix 2) are available from the Zenodo repository: https://doi.org/10.5281/zenodo.15283541.


 Open access