Introduction
Evaluation of the quality and outcomes of the care of patients with stroke or transient ischemic attack (TIA) typically relies on data from clinical stroke registries. However, there is increasing interest in the use of administrative data to identify cohorts and provide follow-up information for epidemiological and comparative effectiveness studies.Reference Appelros, Jonsson, Åsberg, Asplund, Glader and Åsberg 1 - Reference Yip, Jeng, Lee, Chang, Huang and Ng 9 As our health systems experience economic pressures and at the same time are expected to be accountable for the services provided, the need to rely on a comprehensive, cost-efficient and sustainable data source will become more important. In Canada, a country with universal publicly funded coverage of hospital-based services, administrative data offer an accessible and population-based source of information associated with each patient encounter. The validity of administrative data in identifying discrete health conditions, like stroke and TIA, is fundamental to the utility and ultimately the quality of the research based on these data.
Prior studies of the validity of coding for stroke and TIA in administrative data have been conducted in many jurisdictions, typically in the subgroup of patients admitted to hospital, with medical record review as the reference standard and in many cases in earlier eras when access to imaging and specialized stroke centres was limited.Reference Andrade, Harrold, Tjia, Cutrona, Dodd and Goldberg 10 In a systematic review of methods for identifying stroke events using administrative and claims data, Andrade et al. (2012)Reference Andrade, Harrold, Tjia, Cutrona, Dodd and Goldberg 10 compiled 26 articles that met their criteria for evaluation. The selected validation studies employed administrative data from as early as 1970 and up to 2006, though more than half of those included for review were based on data collected prior to 2000. Only one of the reviewed studies used ICD–10-coded data, 1 of the 26 studies based its validation on a stroke registry, and the remainder utilized review of the medical record. Validation of outpatient administrative data for stroke was evaluated in one study using a paediatric population. TIA has received less attention, and the Andrade review identified only seven studies specific to validation of TIAs. These TIA validation studies employed data from 1992 to 2006, while one study was based on the ICD–10 standard, and one reported outpatient results of the validation. We used the Ontario Stroke Registry (the OSR, formerly known as the Registry of the Canadian Stroke Network) as the reference standard for validation of administrative data for diagnoses of acute stroke and TIA, for identification of vascular risk factors, and for diagnostic and treatment interventions among inpatients with stroke or TIA.
Methods
Data Sources
Registry
In Ontario, Canada, a province-wide system of stroke care management was launched in 2000 and fully implemented by 2006, the details of which are reported elsewhere.Reference Fang, Kapral, Richards, Robertson, Stamplecoski and Silver 11 , Reference Kapral, Fang, Silver, Hall, Stamplecoski and O’Callaghan 12 As part of the implementation of the stroke system, a registry was established, and it utilized an active method of identifying potentially eligible patients seen in the emergency department or admitted to any of the 11 regional stroke centres (with resources similar to American comprehensive stroke centres). In fiscal year 2007/2008 (April 1, 2007–March 31, 2008), 31% of all acute stroke and TIA events in Ontario were managed at these regional stroke centres.Reference Hall, Khan, O’Callaghan, Meyer, Fang and Hodwitz 13 Specifically, onsite-trained neurology nurse research coordinators used a variety of recruitment strategies, including a review of lists of potential stroke patients generated by emergency and inpatient wards and medical records departments. The charts were then reviewed by research coordinators, eligibility assessed through review of ED and/or neurology consultation notes, as well as diagnostic imaging reports, and eligible patients were entered into the OSR.
Chart abstractors for the registry received intensive training by a research nurse and two physicians specializing in stroke. As part of their training, abstractors were required to abstract ten test charts of various levels of complexity. Interrater discrepancies identified during the test chart abstraction were discussed and resolved. Once abstractors were in the field, interrater reliability was periodically assessed. In addition, once a month the research physicians teleconferenced with abstractors for the purpose of adjudicating clinical scenarios that had not been accounted for during training. In late 2006, abstractors from all 11 sites attended a one-day training workshop covering such topics as an overview of neuroimaging and review of the Canadian Neurological Score, the National Institutes of Health Stroke Scale and Oxfordshire Community Stroke Project scoring. In the 2007 reliability testing, excellent agreement (100%) was found for key variables, including age, sex, stroke type and use of thrombolysis. Cases were comprehensively documented using a combination of prospective data collection and chart review after the patient was discharged. Each stroke or TIA event represents one record in the registry and includes information about the patient’s symptoms, stroke severity, medical history, diagnostic and treatment services provided, complications, and functional ability at discharge. Data collection for the OSR is done without patient consent since the OSR is housed at the Institute for Clinical Evaluative Studies (ICES), an organization designated as a prescribed entity under provincial privacy legislation.
Administrative Databases
Two administrative databases were utilized in this validation study: (1) the National Ambulatory Care Reporting System (NACRS) database, which includes information on all visits to hospital emergency departments (ED); and (2) the Discharge Abstract Database (DAD), a repository of all inpatient hospitalizations in Ontario. These databases are developed and maintained by the Canadian Institute for Health Information. For both administrative data sources, clinical and demographic information are abstracted from the hospital chart by trained health records technicians following a patient’s discharge. Abstracted data elements include the main problem determined at the end of the ED visit (the diagnosis identified by the provider as being the most clinically significant reason for the visit), and, among admitted patients, the most responsible diagnosis (defined as the single diagnosis that contributes the most to the patient’s length of stay or consumes the majority of resources during admission). Other recorded diagnoses are conditions that existed prior to or occurred during hospitalization and that affected the patient’s treatment and management during hospitalization. The International Classification of Diseases, Tenth Revision, Canada (ICD–10–CA) and the Canadian Classification of Interventions (CCI) coding standards were employed to capture diagnoses and interventions, respectively. Up to ten diagnoses and ten interventions can be recorded in the ED database, and up to 25 diagnoses and 20 interventions can be recorded in the admitted patient database. In both the ED and inpatient databases, the procedure or intervention considered the most clinically significant is entered as the main intervention. For inpatient data, each diagnosis is assigned a type according to the temporal relationship it has with the admission date. Type 1 diagnoses are pre-admission comorbid conditions, while type 2 diagnoses represent conditions that develop during the admission. Age and sex variables were obtained from the Registered Persons Database, a file maintained by the provincial health authority and containing demographic information about all persons who have received a health card number.
These datasets were linked using unique encoded identifiers and analyzed at the ICES. Our study was approved by the Sunnybrook Health Sciences Centre Research Ethics Board.
Study Population
We identified all patients recorded in the ED or inpatient administrative data with an ICD–10–CA diagnosis code of a subarachnoid haemorrhage (160.x, excluding 160.8), intracerebral haemorrhage (161.x), ischemic stroke (163.x and H34.1, excluding 163.6), a stroke not specified as haemorrhage or infarction (164.x) or TIA (H34.0 and G45.x, excluding G45.4), and with a service date (for ED visits) or discharge date (for inpatients) between April 1, 2006, and March 31, 2008 (see Figure 1). An individual may appear more than once in the study dataset if they experienced two or more strokes or TIAs over the observation period.
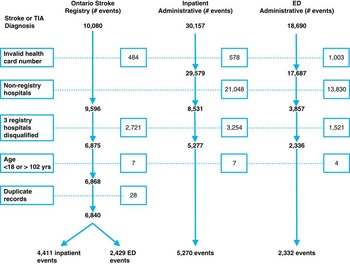
Figure 1 Flowchart of exclusions in the Ontario Stroke Registry and administrative data.
In both the registry and administrative data, we excluded events where the patient was younger than 18 or older than 102 years of age, as well as those where the health card number on the record was invalid. if the ED visit was a scheduled appointment, or if the stroke or TIA was a result of a post-admission complication. For the ED data, we excluded events that resulted in admission to an acute hospital, as these would already be captured in the inpatient group (see Figure 1). Three regional stroke centres were excluded from the analysis. Two centres were multi-site corporate entities but reported under a single hospital identifier in the administrative database. The third centre had incomplete registry data collection for a portion of the period under review, leaving registry data from eight regional stroke centres to compare with administrative data (see Figure 1). Stroke events recorded in the administrative data of these three hospitals were also excluded. Hospitals were grouped according to the peer groups defined by the Ontario Joint Policy and Planning Committee.Reference Tu, Donovan, Lee, Austin, Wang and Newman 14 Teaching hospitals are acute hospitals with membership on the Council of Academic Hospitals of Ontario and that provide complex patient care, are affiliated with a medical or health sciences school, and have significant research activity and postgraduate training. Community hospitals are defined as large hospitals that do not meet the definition of a teaching hospital. 15
Analysis
We linked events from the administrative databases to a registry record using encrypted patient identifier, institution, and date and time of registration in the ED, or, for those admitted, date of discharge. We allowed a 24-hour absolute difference in ED registration time and the registry, and a one-day absolute difference between discharge dates recorded in the inpatient administrative data and the registry.
We evaluated the validity of administrative data from eight regional stroke centres in identifying acute stroke and TIA events (excluding in-hospital strokes) in three ways. First, we compared events with an exact code match of acute stroke or TIA at the level of the main problem (ED) or most responsible diagnosis code (inpatient). Second, we created two stroke groups based on the reported main problem or most responsible diagnosis. The ischemic stroke group consisted of ischemic stroke (I63) and stroke not specified as haemorrhage or infarction (I64), while the haemorrhagic group was a combination of intracerebral haemorrhage and subarachnoid haemorrhage. 16 Third, we compared events with stroke or TIA appearing in any diagnosis position and excluding those that occurred post-admission. We calculated sensitivity and positive predictive value (PPV), with sensitivity defined as the percentage of stroke and TIA events in the registry that linked to an administrative record, and PPV as the percentage of acute stroke or TIA identified in administrative records that linked to an event in the registry. We also calculated agreement using Cohen’s kappa methodology, which corrects for chance agreement. Kappa values <0.2, 0.2-0.39, 0.4-0.59, 0.6-0.79 and 0.80-1.00 correspond to poor, fair, moderate, good and very good agreement, respectively.Reference Altman 17
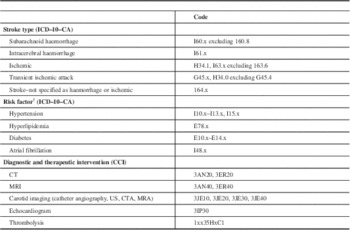
For the secondary objectives, we calculated the agreement between inpatient administrative data reporting of risk factors (hypertension, hyperlipidemia, diabetes, atrial fibrillation), stroke-related diagnostics (computed tomography [CT] of the brain, magnetic resonance imaging [MRI] of the brain, carotid imaging [includes catheter angiography, carotid Doppler ultrasound, CT angiography and MR angiography of the carotid artery], and echocardiography), and the use of tissue plasminogen activator (tPA) with what was documented in the registry. We excluded ED data from the risk factor analysis due to the minimal reporting of diagnoses beyond the main diagnosis (median number of diagnoses=0, mean=0.4). The ICD–10–CA and CCI codes used in this analysis are included in Appendix 1.
Where reported, 95% confidence intervals (CI 95%) were calculated using the binomial approximation method. Data management and statistical analyses were performed using SAS software (v. 9.2, SAS Institute, Cary, NC).
Results
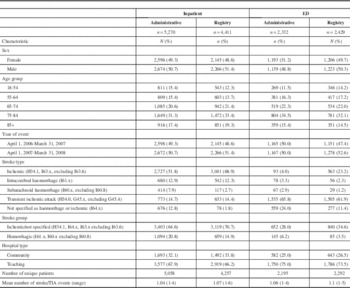
The characteristics of patients with acute stroke or TIA in the administrative data and registry are shown in Table 1. Of the various stroke types, ischemic stroke represented the largest percentage of events in the inpatient setting (51.8% in administrative data and 68.9% in the registry), while TIA represented the largest percentage of events in the ED (65.8% in administrative data and 61.9% in the registry). Both inpatient and ED administrative data sources had higher percentages of stroke of undetermined type compared to the registry (12.8 vs. 1.8% of inpatient events and 24.0 vs. 11.4% of ED events).
Table 1 Characteristics of Stroke Events in the Inpatient and Emergency Department Administrative Database and Ontario Stroke Registry, April 1, 2006-March 31, 2008
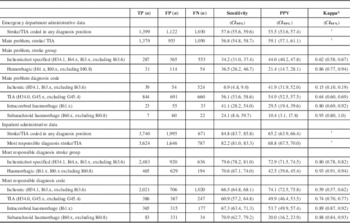
As shown in Table 2, when stroke or TIA (ignoring stroke type) is in the main diagnosis position, the sensitivity of the inpatient administrative data reached 82.2%, with a PPV of 68.8%. When all diagnosis positions were considered, sensitivity increased to 84.8% but PPV decreased to 65.2%. Events coded with ischemic stroke as the most responsible reason for hospitalization had poor sensitivity (66.5%), though when combined with UTD stroke (I64) sensitivity improved (79.6%), with only a small reduction in PPV. Subarachnoid haemorrhagic (SAH) stroke demonstrated the highest sensitivity (70.9%) among the various stroke types, and the lowest PPV (20.0%). For stroke or TIA events assessed in the ED and discharged to the community, the sensitivity and PPV for all stroke types were low, ranging from a sensitivity of 6.9% (ischemic) to 56.1% (TIA) and a PPV of 10.4% (SAH) to 54.9% (TIA). Although not shown, we investigated the sensitivity and PPV of stroke type stratified by service setting and teaching and community hospital status and found similar results for both institution types for stroke and TIA collectively, as well as for ischemic stroke type combined with unspecified stroke type.
Table 2 Diagnostic Accuracy of Stroke and Transient Ischemic Attack (TIA) Coded in Administrative Data Compared to the Ontario Stroke Registry, by Service Setting, Stroke ICD–10–CA Code and Stroke Group, April 1, 2006-March 31, 2008
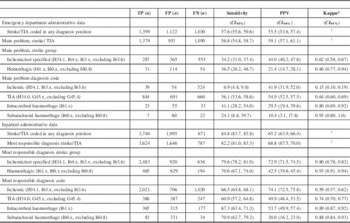
* Based on linked records: n=3,624 (inpatient) and n=1,379 (ED).
† Value of κ cannot be calculated, as true negatives are not known.
TP=true positive; FP=false positive; FN=false negative.
We also reviewed the distributions of false positive strokes and TIA and found that ischemic stroke was frequently coded as stroke–not specified and TIA as ischemic, and in the case of haemorrhagic strokes, subarachnoid was substituted for intracerebral (results not shown). Similar patterns are reported in other studies.Reference Kirkman, Mahattanakul, Gregson and Mendelow 18 , Reference Kokotailo and Hill 19
Agreement between the administrative data and registry on documentation of risk factors, diagnostic procedures and treatment interventions is shown in Table 3. Among the risk factors examined, agreement was very good for diabetes (κ=0.83), good for atrial fibrillation (κ=0.60), fair for hypertension (κ=0.32) and poor for hyperlipidemia (κ=0.13). For diagnostic and therapeutic interventions provided to inpatients, agreement was good for both CT (κ=0.64) and MRI (κ=0.77) but poor for carotid imaging (κ=0.03) and echocardiography (κ=0.02). Agreement for thrombolysis administration was moderate (κ=0.47). In the ED setting, CT scan (κ=0.77) and MRI scan (κ=0.66) had good agreement while carotid imaging had poor agreement (κ=0.15).
Table 3 Prevalence and Agreement of Diagnostic and Therapeutic Interventions in the Administrative Data Record as Compared to the Ontario Stroke Registry Among Records that Linked (April 1, 2006-March 31, 2008)
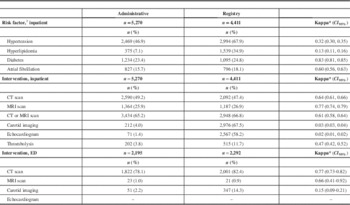
* Based on linked records.
Inpatient n=3,624; ED n=1,379.
† ICD–10–CA code of any diagnosis type.
CT=computed tomography scan, brain; MRI=magnetic resonance imaging scan, brain; –=suppressed due to small cell count.
Carotid imaging includes carotid catheter angiography, carotid Doppler ultrasound, CT angiography or MR angiography of the carotid artery.
Discussion
We found inpatient administrative data from regional stroke centres to be a valid data source for identifying stroke or TIA as well as for identifying the combined group of ischemic stroke and stroke–not specified. In contrast, ED administrative data had a low predictive value for identifying stroke or TIA.
The sensitivity and PPV of the inpatient administrative data were maximized when all stroke types were combined with TIA and appeared in the most responsible diagnosis position (sensitivity=82.2%, PPV=68.8%). These findings are consistent with previous studies suggesting that inpatient administrative data can be used to identify patients with stroke.Reference Kokotailo and Hill 19 - Reference Piriyawat, Smajsova, Smith, Pallegar, Al-Wabil and Garcia 21 When expanded to include all diagnosis positions, sensitivity for overall stroke and TIA increased to 84.8%, but at the expense of PPV (65.2%), that is, the number of false positive stroke/TIA events increased. Other studies have found that, while PPV was lower when all diagnosis positions were utilized to identify stroke, 20% of valid cases would be missed by focusing on the main diagnosis exclusively.Reference Thigpen, Dillon, Forster, Henault, Quinn and Tripodis 22 Tirschwell et al.Reference Tirschwell and Longstreth 23 found higher sensitivity and PPV when all diagnosis positions were included rather than using the most responsible diagnosis alone; however, their analysis was based on a 1% sample of eligible cases from acute hospitals in Seattle, Washington.
We found that the validity of administrative data for identifying TIA was poor, with PPVs of 49.9% in inpatient and 54.9% in ED administrative data. This is consistent with previous studiesReference Andrade, Harrold, Tjia, Cutrona, Dodd and Goldberg 10 that reported PPVs ranging from 28 to 97%. The limited and variable information about TIA validity suggests that caution is needed when using ICD codes to create a TIA cohort and that one should consider including an active approach for TIA case identification.Reference Piriyawat, Smajsova, Smith, Pallegar, Al-Wabil and Garcia 21
Our finding of poor validity of stroke coding in ED administrative data is consistent with the work of Johnsen et al.,Reference Johnsen, Overvad, Sørensen, Tjønneland and Husted 24 who found a PPV of 46.7% for TIA and even lower percentages for ischemic stroke, as well as for subarachnoid and intracerebral haemorrhage. This may be related to incomplete clinical investigations and/or documentation in the ED, as well as the challenges involved in selection of the main problem for the ED visit by the health records technician.
We found that the reporting of stroke risk factors in inpatient administrative data was limited, where diabetes was found to be very good (κ=0.83) and atrial fibrillation good (κ=0.60). Other important stroke risk factors, such as hypertension and hyperlipidemia, and a key intervention, thrombolysis, were poorly reported. This is in contrast to another Canadian study,Reference Andrade, Harrold, Tjia, Cutrona, Dodd and Goldberg 10 where these same risk factors had better kappa agreement than what was found in our study. This discrepancy may be attributable to the specialty training received by the health records technician at the largest of the three participating hospitals, including access to a stroke team for advice in resolving coding issues during the administrative database abstraction process.
There was good agreement between administrative and registry data for identification of brain imaging. However, there was only moderate agreement for the reporting of thrombolysis and poor agreement for the use of carotid imaging and echocardiography. The moderate agreement for thrombolysis is not unexpected, given that specific intervention codes for tPA administered for stroke did not exist during the study period (a dedicated CCI code for tPA was introduced on April 1, 2010). The poor agreement for carotid imaging and echocardiography is likely attributable to the fact that, when these diagnostics are performed on inpatients, the associated costs are absorbed by hospital global budgets and are not captured in the discharge abstract. Although we did not evaluate this in our project, use of other linked administrative data—such as physician billing data—may allow for better identification of inpatient diagnostic procedures.
The validity of administrative data depends in part on the quality of the initial clinical documentation in the medical chart, the training of health records technicians to locate and interpret information, the diagnostic and clinical expertise available, and hospital-specific coding practices. In 2010, directives from the Canadian Stroke Strategy specifically addressed the overuse of code I64.x—“stroke not specified as haemorrhage or infarction.” 16 The directive advised health records technicians to reduce the use of this code since most stroke patients seen in the ED receive brain imaging, allowing strokes to be categorized as ischemic or haemorrhagic. A recent evaluation of all acute hospitals in Ontario found that the prevalence of stroke–not specified among inpatient stroke and TIA patients has almost halved from 16.9% in 2010/2011 to 8.0% in 2012/2013, with a corresponding increase in the reported prevalence of ischemic stroke from 50.7% in 2010/2011 to 59.0% in 2012/2013.Reference Hall, Khan, O’Callaghan, Kapral, Cullen and Levi 25 Other efforts to improve the coding of administrative data include mandated collection of the date and time tPA is administered, an initiative introduced as of fiscal year 2012/2013. As part of the introduction of these new data elements, education workshops for health records technicians are provided with a focus on locating and interpreting chart information.
Some study limitations merit comment. We were unable to calculate specificity or negative predictive value because of the manner in which events were identified in the registry. Only those events presenting at a centre’s ED and suggestive of stroke or TIA were adjudicated, and, as a result, true negatives are not known. Some patients with true positive TIA or mild stroke may also have been missed. Benchimol et al.Reference Benchimol, Manuel, To, Griffiths, Rabeneck and Guttmann 26 found in their review of administrative data validation studies that the reference standard cohort in many studies did not include patients without disease, precluding the calculation of specificity. In addition, research nurses abstracting for the registry had the option of continuing to complete the chart as new information about the patient became available. Thus, the research nurse may have waited for a diagnostic report that was unavailable at the time of discharge before finalizing the stroke diagnosis in the registry, an option not available to the health records technician abstracting the administrative record. Using an active approach to identify admitted stroke or TIA patients, Piriyawat et al.Reference Piriyawat, Smajsova, Smith, Pallegar, Al-Wabil and Garcia 21 found that the majority (over 75%) of cases missed were due to admission terms not suggestive of stroke or TIA.
Additionally, our results were based on 2007 and 2008 data and may not reflect contemporary coding practices, diagnostic resources and clinical documentation. Furthermore, the hospitals participating in the registry are regional referring centres where there are stroke expertise and diagnostic resources, which may limit the generalizability of our findings to other hospital types. To this point, a studyReference Tu, Wang, Young, Green, Ivers and Butt 27 using primary care electronic medical records as the reference standard to assess the validity of physician claims and hospitalization data to identify prevalent stroke and TIA found that 45% of false positive cases associated with the best algorithm for capturing prevalent stroke/TIA were due to administrative data miscoding. Specifically, patients were coded as having a stroke before the investigation was complete and, when completed, were found not to have suffered a stroke.
Despite these limitations, our study contributes to the growing body of research on the validity of ICD–10–CA-coded stroke and TIA in administrative data and the importance of reporting observational research consistently and transparently to allow for interprovincial/territorial and international comparisons.Reference Kirkman, Mahattanakul, Gregson and Mendelow 18 , Reference Kokotailo and Hill 19 , Reference Piriyawat, Smajsova, Smith, Pallegar, Al-Wabil and Garcia 21 , Reference Johnsen, Overvad, Sørensen, Tjønneland and Husted 24 - Reference Bennett, Brayne, Feigin, Barker-Collo, Brainin and Davis 28
Conclusion
Routinely collected administrative inpatient data at regional stroke centres in Ontario, Canada, are accurate for identifying inpatients with stroke and TIA combined, and ischemic stroke when combined with stroke of undetermined type. Administrative emergency department data have lower accuracy for identification of stroke and TIA. As advances are made in stroke management and treatment, combined with health record technological improvements and the fact that facility use of administrative databases expands beyond resource utilization to system performance and capacity planning, evaluation of the validity of administrative data for identifying stroke and TIA will need to continue.
Acknowledgments and Funding
This study was supported by the Ontario Stroke Network (OSN) and the Institute for Clinical Evaluative Sciences (ICES), which are funded by a grant from the Ontario Ministry of Health and Long-Term Care (MOHLTC). The opinions, results and conclusions reported herein are those of the authors and are independent of the funding sources. No endorsement by the OSN, the ICES or the MOHLTC is intended or should be inferred. Parts of this work are based on data and information compiled and provided by Canadian Institute for Health Information (CIHI). However, the analyses, conclusions, opinions and statements expressed herein are those of the authors, and not necessarily those of CIHI.
Moira Kapral is supported by a Career Investigator Award from the Heart and Stroke Foundation (Ontario Provincial Office).
Disclosures
Ruth Hall, Luke Mondor, Joan Porter, Jiming Fang and Moira Kapral hereby state that they have nothing to disclose.
Appendix 1
Table A1 ICD–10–CA Diagnostic Codes and CCI Intervention Codes Associated with the Assessment and Treatment of Stroke and TIAs
