Introduction
The focus of this paper is the role of sea ice in the framework of an ocean general circulation model (OGCM). The aims are to estimate the impact of some specific characteristics of sea ice on large-scale hydrographic properties and the ther-mohaline circulation, and to contribute to improving the representation of sea ice in global climate models.
Earlier studies addressing the role of sea ice in global climate include Reference Aagaar, Carmack, Johannessen, Muench and OverlandAagaard and Carmack (1994). Reference Alekseev, Johannessen, Muench and OverlandAlekseev (1994) and Reference Wadhams, Johannessen, Muench and OverlandWadhams (1994) from the observational viewpoint, and Reference Yang and NeelinYang and Neelin (1993), Reference Rind, Healy, Parkinson and MartinsonRind and others (1993), Reference Wadhams, Johannessen, Muench and OverlandToggweiler and Samuels (1995) and Reference Maier-Reimer and PeltierMaier-Reimer (1993) from the modelling viewpoint. Most modelling studies suffer either from highly idealised settings or from simplified assumptions concerning the treatment of sea ice.
In this paper, a realistic representation of sea ice in the framework of a global, primitive-equation OCGM with “realistic” topography and seasonal forcing is proposed. With this configuration three sensitivity integrations are performed. The setup and the main results are reported here.
The Model
The tool used for this investigation consists of a global 3.5 × 3.5 11 layer resolution version of the Hamburg Ocean Primitive Equation (HOPE) model (Reference Wolff and Maier-ReimerWolff and Maier-Reimer. 1996; Reference LatifLatif and others. 1994; Reference Legutke, Maier-Reimer, Stössel and HellbachLegutke and others, 1997). It is based on an upgraded version of Reference Drijfhout, Heinze, Latif and Maier-ReimerDrijfhout and others (1996). Unlike the more commonly known z-coordinate ocean models (namely the Modular Ocean Model (MOM) (Reference BryanBryan, 1969; Reference CoxCox, 1984; Reference PacanowskiPacanowski, 1995) and the Large-Scale Geostrophic (LSC) model (Reference Maier-Reimer, Mikolajewicz and HasselmannMaier-Reimer and others, 1993)), this model uses the viscous-plastic constitutive law to describe the internal ice stress in the sea-ice momentum equation (following Reference HiblerHibler, 1979). Other differences are described in Reference Drijfhout, Heinze, Latif and Maier-ReimerDrijfhout and others (1996).
The sensitivity integrations are started from a cyclo-stationary condition arrived at after a 10 000 year integration with restoring boundary conditions for sea-surface temperature (SST) and salinity (SSS) (personal communication from Drijfhout, 1995). The forcing fields consist of monthly climatological data from Reference Hellerman and RosensteinHellerman and Rosenstein (1983) for the wind fields, and temperature fields from Reference Woodruff, Slutz, Jenne and SteurerWoodruff and others (1987), as well as annual mean data from Reference LevitusLevitus (1982) for the salinity restoring (all identical to Reference Drijfhout, Heinze, Latif and Maier-ReimerDrijfhout and others, 1996, and Reference Maier-Reimer, Mikolajewicz and HasselmannMaier-Reimer and others, 1993). The time-step is 20 hours. Each sensitivity experiment is integrated for 300–500 years to arrive at near-cyclostationary conditions with respect to the volume transport of the Antarctic Circumpolar Current (ACC).
The Reference Drijfhout, Heinze, Latif and Maier-ReimerDrijfhout and others (1996) HOPE version was recently modified, mainly in order to improve the strength of the ACC. “Salinity enhancement” following Reference EnglandEngland (1992), has been introduced to overcome the summer bias in the Reference LevitusLevitus (l982) surface salinity fields of the Southern Ocean (SO). The direct solar radiation over sea ice, as well as the salinity restoring under sea ice, have been withdrawn. Furthermore, the momentum flux under sea ice is now provided by the ice–ocean stress, the eddy viscosities and diffusivities have been increased, and the bottom friction decreased (personal communication from Drijfhout, 1995).
Background of the Experiments
Brine release
The most crucial impact of sea ice on SSS arises from brine release during sea-ice formation, and fresh-water release during melting. In marginally stably stratified regions, like most of the SO, these processes have a direct impact on the rate and sites of deep convection and bottom-water formation.
Reference Maier-Reimer and PeltierMaier-Reimer (1993) studied this effect with the global LSG OGGM. He indicated that brine release contributed substantially to the cooling of the deep ocean, while it contributed only marginally to the meridional heat transport in the ocean.
While the setting of his experiment is similar to the one in this paper, the sea-ice component of the LSG model is simplified in its dynamic formulation in that sea ice is driven by the upper-ocean current and provided with a simple viscous rheology to avoid excessive ridging in convergent regions.
Salinity enhancement
(Reference EnglandEngland 1992, Reference England1993) introduced the concept of salinity enhancement for his coarse-resolution, global MOM OGCM experiments. In order to compensate for the fact that no sea ice was included in his model version, and that the Levitus SSS in the SO is biased toward summer values (see previous section), the model SSS was restored toward 35.0 psu in the southernmost gridcells around Antarctica during the w inter months. With this measure, Reference EnglandEngland (1992) achieved a substantial increase in SO overturning, and a more realistic bottom-water salinity, which was underestimated in experiments without salinity enhancement. Reference Wadhams, Johannessen, Muench and OverlandToggweiler and Samuels (1995) criticized this measure as overestimating the brine-release effect of sea ice, and suggested a weaker (and more realistic) SSS restoring in an otherwise similar model configuration, locally employing the salinity observed near the bottom of the continental shelf around Antarctica.
In addition to the fact that these model experiments did not explicitly account for any sea-ice effects, they also did not consider seasonal variations (except for the imposed salinity enhancement during the winter months).
New-ice thickness growth in partially ice-covered gridcells
Explicit new-ice formation in the ice-free part of a model gridcell is often neglected or crudely parameterised in the framework of a global ocean model. Subtle change's in the formulation of this process have a crucial impact on the overall growth rate of sea ice, and thus on the ocean's upper-boundary conditions in terms of the SSS (Reference StösselStössel and others, 1996). The model formulation of new-ice ideally consists of explicit new-ice thickness growth combined with a parameterisation for the rate of lead closing.
The present HOPE model version employs the same formulation for sea-ice thermodynamics as the LSG model. It is simplified in comparison to the more commonly used descriptions based on comprehensive heat-balance calculations for the ice-free and ice-covered parts of a gridcell (e.g. Reference Parkinson and WashingtonParkinson and Washington, 1979; Reference Owens and LemkeOwens and Lemke, 1990; Reference OberhuberOberhuber, 1993; Reference Legutke, Maier-Reimer, Stössel and HellbachLegutke and others, 1997). The essential difference is the assumption that ice growth is a function of a specified surface temperature, instead of one that is diagnosed from the surface heat balance (see Reference StösselStössel, 1996, Reference StösselStössel and others, 1996, in press, for a detailed discussion). The other main difference is the way the thermodynamic lead closing is parameterised. This specific parameterisation partly compensates for the fact that there is no explicit new-ice thickness growth in the present HOPE model version and the LSG model.
The Results
Potential energy release through convection
A common measure for the overall rate of convection is the meridional–vertical volume transport displayed in the meridional overturning cells (see next section). The cells result from a zonal integration of the meridional velocity field, and thus do not take into account any zonal contributions of sinking or rising water masses. An alternative measure of convective activity is the potential energy release associated with convection, While the meridional overturning illustrates the overall advective pattern, the potential energy release is mostly a measure of vertical diffusion in the model essentially determined by convective adjustment).
Figure 1 shows the seasonal cycle of
the potential energy release as an average over the higher latitudes
![]() of both hemispheres.
of both hemispheres.

Fig. 1. Seasonal cycles of hemispherically averaged NH (open symbols) and SH (solid symbols) seasonal cycles of potential energy release by convection in mWm−2. The reference Simulation is demarked by circles; experiment 1 is triangles; experiment 2 is squares; and experiment 3 is stars.
If the effect of brine release is neglected (Experiment 1; triangles), hardly any change is found in the Northern Hemisphere (NH) while the seasonal cycle in the Southern Hemisphere (SH) is shifted toward decreased convection in the SH fall, and increased convection in the SH spring. As the sea-ice salinity in this experiment is assumed to be the same as the SSS, ice formation in the fall is not associated with brine release, leading to decreased convection during this time of the year, while melting in the spring is not associated with fresh-water release, thus leading to enhanced convection.
If the seasonal salinity enhancement in the SO is deactivated (Experiment 2; squares), a substantial overall reduction in SO convection is monitored. Note that salinity enhancement is only active in the ice-free part of a gridcell, which is subject to salinity restoring and only active in the three SH winter months. The convective activity is stronger in the SH fall. There is also a change in the NH, indicating an inter-hemispheric link.
If new-ice thickness growth in partially ice-covered gridcells is explicitly accounted for (Experiment 3; stars), the convection rate in the SH fall increases substantially, as expected due to brine release associated with enhanced ice formation.
Meridional overturning
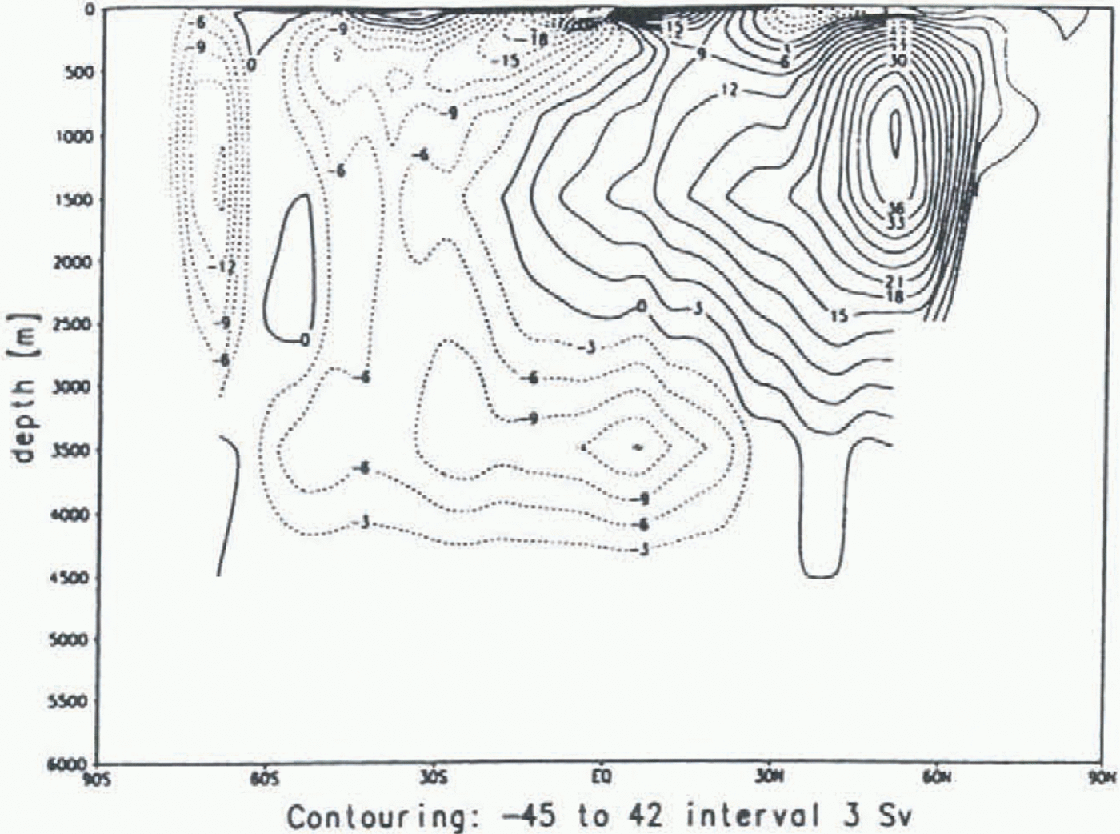
Figure 2 shows the global meridional overturning stream-function for the reference experiment. It shows a strong overturning cell of about 40 Sv in the NH, associated with deep-water formation in the northern North Atlantic. The SH overturning is split by a very weak Deacon cell, which is related to the northward Ekman transport in the belt of the SO westerlies. The strength of the SO cell south of 60 S is similar to the Overall SH cell; approximately 15 Sv of Antarctic Bottom Water (AARW) flow across the Equator.

Fig. 2. Global meridional overturning in
![]() for the reference simulation. Increment is 3
Sv.
for the reference simulation. Increment is 3
Sv.
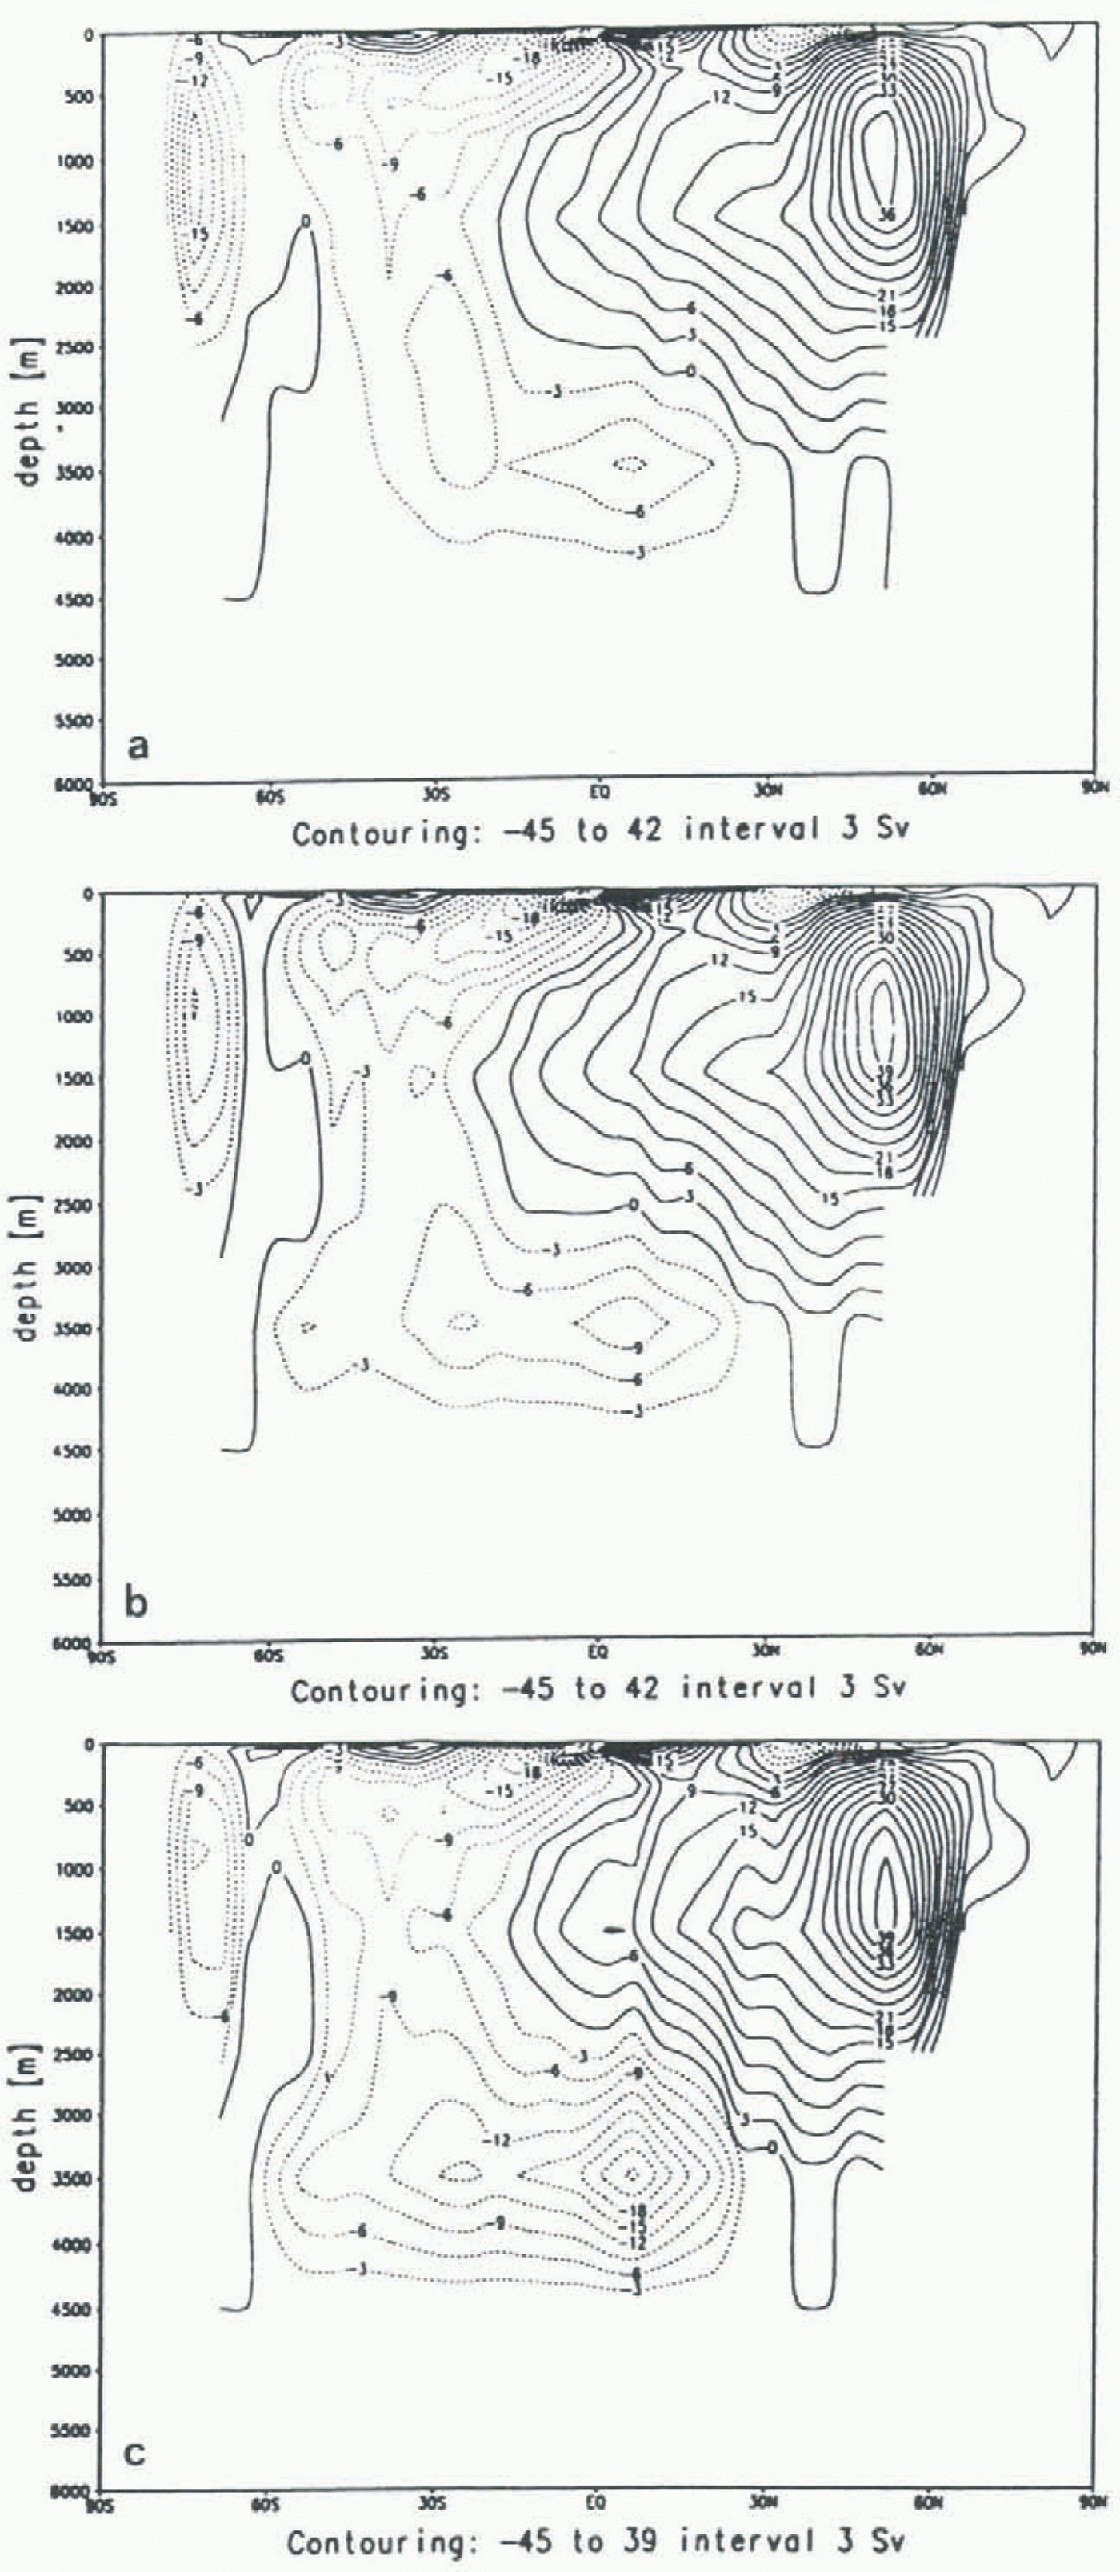
Figure 3 shows the corresponding stream-functions for the three sensitivity experiments. In the first experiment (Fig. 3a), the intrusion of AABW weakens to 10 Sv, while the strength of the SO overturning cell is almost unchanged. The second experiment (Fig. 3b) leads to a reduction of the strength of the SO overturning cell, while the intrusion of AABW is almost unchanged. The highest impact is brought about in the third experiment (Fig. 3c). The SO overturning cell is weakened and the intrusion of AABW increases substantially from 15 to 25 Sv.

Fig. 3. Global meridional overturning in
![]() for (a) Experiment 1, (b) Experiment 2, (c)
Experiment 3. ; Increment is 3 Sv.
for (a) Experiment 1, (b) Experiment 2, (c)
Experiment 3. ; Increment is 3 Sv.
These features are generaly consistent with the figures of potential energy release, with more SO convection leading to more intrusion of AABW. This suggests that the overall SH overturning cell is the decisive cell in indicating the strength of AABW formation.
Deep-ocean water mass
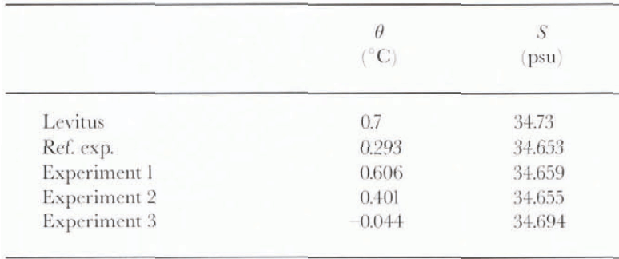
The changes in potential energy release due to convection, especially that associated with AABW formation, can be monitored as changes in deep-ocean temperature and salinity. As demonstrated in Reference StösselSöissel (1996) and Reference Maier-Reimer and PeltierMaier-Reimer (1993), changes associated with brine release originate in the marginally Stably stratified regions of the SO. Table 1 shows the global mean potential temperature (θ) and salinity (S) at 4 km depth for the reference HOPE OGCM simulation and the three sensitivity integrations, together with the observed figures according to Reference LevitusLevitus (1982). The reference simulation underestimates both temperature and salinity. An increase in convective activity, as obtained with the third experiment, is associated with a significant further decrease in temperature and an increase in salinity, indicating ice formation along the coast of Antartica (beyond the core of warmer and more saline deep water) to constitute the dominant role in the bottom-water formation. The first two experiments yield an increase in temperature, while the salinity remains almost unchanged; this suggests open ocean convection to be the dominant source of change in these experiments (see the next section).
Table 1. Global mean potential temperatuic and salinity

Conclusions
We performed three sensitivity integrations with the global HOPE OGCM, which includes state-of-the-art sea-ice dynamics. The forcing is provided by climatological monthly fields for momentum forcing and temperature re-storing, together with annual fields for salinity restoring (except for the contribution of salinity enhancement). Significant changes were observed in convective activity, the strength of the global meridional overturning of the SH, and the global mean deep-ocean water mass.
As expected, the effect of brine release, the salinity enhancement and new-ice thickness growth in partially ice-covered gridcells all lead to a significant increase in convective activity associated with colder deep-ocean temperatures and a higher intrusion of AABW into northern latitudes. While the overall large-scale features are consistent, differences occur in the strength of the SO overturning cell (e.g. the weakening demonstrated in Experiment 3).
The increase in new-ice formation (Experiment 3) and the neglect of brine-release (Experiment 1) are both associated with an overall increase in SH ice thickness (Figs 4a, c), though these experiments lead to opposite results in terms of AABW formation and the cooling of the deep ocean: only Experiment 3 is associated with a larger increase in deep-ocean salinity. This suggests that an effective increase in sea-ice formation yields temperature- and salinity-dominated convection, while brine release leads to the entrainment of warmer (and more saline) deep water into the mixed layer associated with sea-ice melting (e.g. Reference MartinsonMartinson, 1990). The convective activity in the latter case is thus temperature driven, with a concomitant cooling of the deep ocean. This suggests that the first experiment is mostly associated with open-ocean convection, while the third experiment more closely represents near-boundary convection (e.g. Reference Carmack and SmithCarmack. 1990), a phenomenon restricted to shelf regions and not associated with a direct upwelling of warm, deep water. Near-boundary convection is also indicated because of the fact that coastal polynyas are represented as gridcells with lower ice concentration in large-scale models. These gridcells were subject to more enhanced ice formation in the third experiment.
The salinity enhancement (Experiment 2) increases convection, balancing ice formation with warmer deep water, and cooling the deep ocean without significantly increasing its salinity. This is indicated in Figure 4b, which shows no significant change in SH winter ice thickness. Reference EnglandEngland (1992) and Reference Wadhams, Johannessen, Muench and OverlandToggweiler and Samuels (1995) applied their salinity enhancement on full gridcell fractions to mimic the “sea-ice effect”. In the present case, the SSS restoring (toward enhanced salinities) is restricted to the ice-free fraction of a gridcell. Over the ice-covered fraction, the sea-ice effect is “real” (through the sea-ice model). In the ice-free fraction, the SSS restoring is additionally modified in the case of new-ice growth. All of this leads to a much weaker effect, particularly on the deep-ocean salinity. It is clear that a variety of non-linear relationships need to be considered to describe properly the upper ocean boundary conditions in regions affected by sea ice. Thus, in order to estimate more reliably the “sea-ice effect” on the deep ocean, at least the first-order sea-ice processes interacting with the ocean should be included in subsequent analyses.

Fig. 4. SO winter sea-ice thickness differences: respective sensitivity minus reference integration; (a) Experiment 1. (by) Experiment 2, (c) Experiment 3. Increment is 0.2 m.
Overall, these experiments demonstrate that the way in which sea ice is treated in OGCMs may have a substantial impact on the ocean's hydrographic properties and circulation. This interdependency encouraged a series of further experiments, including a realistic forcing of the sea-ice component from the atmosphere. Specifically, the effect of a more realistic wind forcing is tested in terms of the data source itself (the Reference Hellerman and RosensteinHellerman and Rosenstein (1983) winds are notoriously poor in the SO (see Reference Toggweiler and SamuelsSöossel and others, 1990)) and in terms of its variability (monthly means vs daily winds (see e.g. Reference StösselStössel, 1996)). The ultimate goal is to assess the possible impact of sea ice on the global ocean, and to improve understanding of the various interactive processes of the coupled ice ocean system.
Acknowledgements
For valuable discussions on this topic I thank S. S. Drijfhout and S. Legutke. I also thank the former for providing the upgraded version of the “coarse resolution” HOPE model. Furthermore, I thank S. Kegutke and W. F. Budd for their constructive comments on an earlier draft of this paper. This research was financially supported by the College of Geosciences of Texas A & M University and to some extent bv the German Climate Computing Center (DKRZ) at Hamburg.


