Cardiometabolic diseases are important causes of adult disability and death in many countries. Among strategies for combating these complications, the dietary modulation of cardiometabolic risk has gained in popularity over the years(Reference Feldeisen and Tucker1, Reference Bruckert and Rosenbaum2). In addition to customary generic dietary regimens, such as the so-called Mediterranean and Nordic diets(Reference Adamsson, Reumark and Fredriksson3, Reference Estruch, Martínez-González and Corella4), the potential of ad hoc-designed diets for the treatment and prevention of cardiometabolic disorders has attracted attention recently. For instance, a portfolio of plant foods has proven effective in reducing plasma cholesterol levels and cardiovascular risk in hypercholesterolaemics(Reference Jenkins, Kendall and Faulkner5). A diet combining different anti-inflammatory functional components has also been shown to have notable ability to ameliorate multiple metabolic risk parameters in healthy mature volunteers(Reference Tovar, Nilsson and Johansson6).
An important aspect of risk management by dietary means is the degree of adherence to the prescribed regimen(Reference Bruckert and Rosenbaum2, Reference Jenkins, Kendall and Faulkner7). Therefore, documentation of the health-beneficial effects of common palatable foods is necessary, as good overall palatability and variety are key determinants of successful dietary compliance. Whole-grain cereals and legumes are interesting in this context, as they have been reported to be generally associated with health-beneficial effects(Reference Venn, Perry and Green8–Reference Björck, Ostman and Kristensen11). Previous work carried out by this research group has investigated acute and semi-acute metabolic effects of different legumes and whole-grain cereals. It has been shown that a portion of intact boiled barley kernels eaten at dinner improves postprandial blood glucose control the following morning(Reference Nilsson, Granfeldt and Östman12, Reference Nilsson, Östman and Preston13) and promotes a significant reduction in the levels of circulating markers of inflammation(Reference Nilsson, Ostman and Holst14), features that may be useful in relation to the dietary management of metabolic risk. These effects seem to be related both to the low-glycaemic index properties of the cereal and to the colonic fermentation of its prebiotic carbohydrates. Legume seeds constitute another promising ingredient, characterised by low glycaemic indices and significant fermentable substrate contents(Reference Hutchins, Winham and Thompson9, Reference Tovar15). Recent data indicate that brown beans, in particular, exert noteworthy beneficial effects on postprandial plasma levels of biomarkers of inflammation, a phenomenon that may be associated with the perceived prebiotic features of the indigestible fraction of pulses(Reference Nilsson, Johansson and Ekström16). Similar effects have been recorded with chickpeas (A Nilsson, E Johansson, L Ekström and I Björck, unpublished results).
Combinatory approaches exploiting possible synergistic effects of conventional functional food items appear valuable in the design of successful regimens for reducing metabolic risk(Reference Tovar, Nilsson and Johansson6). Based on the aforementioned evidence, the present study examined the effects of a diet enriched with whole-grain kernel-based barley, brown beans and chickpeas on cardiometabolic risk-associated parameters in a healthy cohort of mature overweight women. The intervention followed a randomised cross-over design, pursuing the amelioration of cardiometabolic risk through improved dietary quality under body weight-maintenance conditions.
Subjects and methods
Participants
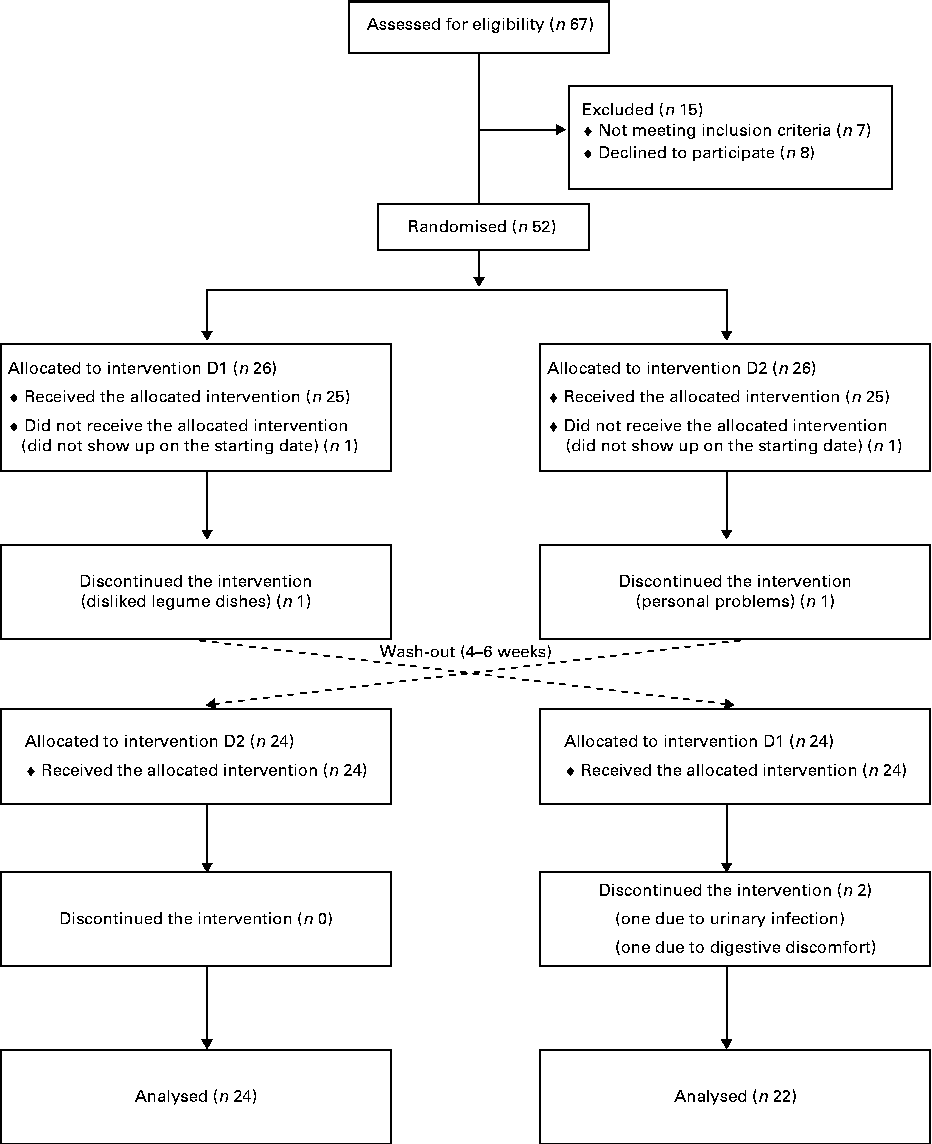
Non-smoking female volunteers without any known medical condition were recruited through advertisement in local newspapers and were informed orally and in writing of the project disposal, emphasising the non-weight-loss character of the investigation. Inclusion criteria were age between 50 and 73 years, BMI in the 25–33 kg/m2 range and fasting plasma glucose values ≤ 6·1 mmol/l. The only medications accepted were hormone replacement for thyroid problems (if constant during the whole trial) and prescription-free painkillers without anti-inflammatory action. The trial was initiated with fifty subjects. During the first week, two participants withdrew from the study: one disliked the barley/legume dishes and the other faced personal problems. Another two subjects withdrew within a few days of starting the second phase of the trial. A total of forty-six completed the two phases of the trial and were included in the analysis (Fig. 1). Data obtained from non-completers were excluded. Baseline data collected at the time of the first clinical visit are given in Table 1.

Fig. 1 Flow diagram of enrolment, random assignment, withdrawals and follow-up of the study participants. D1, diet 1 (functional diet); D2, diet 2 (control diet).
Table 1 Characteristics of the participants at baseline (Mean values with their standard errors, n 46)
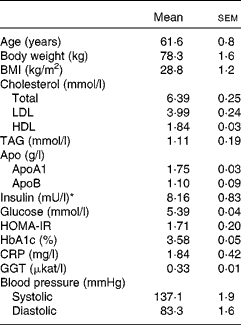
HOMA-IR, homeostatic model assessment of insulin resistance; HbA1c, glycated Hb; CRP, C-reactive protein; GGT, γ-glutamyl transferase.
* 1 mU/l = 6·945 pmol/l.
Study protocol
The study was designed as a randomised, controlled, cross-over trial of the effect of a legume–whole-grain barley diet (D1, diet 1 (functional diet)) on markers related to cardiometabolic risk. The participants were randomly assigned, using a computerised random number generator, to one of two treatment orders starting with D1 or D2 (diet 2 (control diet)), respectively (Fig. 1). The randomisation was carried out by the study coordinator. Each dietary phase lasted 4 weeks with a 4–6-week wash-out period. The participants paid four visits to the clinical unit (Lund University Antidiabetic Food Centre), one before and one after each intervention period.
During each clinical visit, fasting body weight was recorded, and blood pressure (BP) was measured twice, while seated, in the non-dominant arm using a digital automatic BP monitor (Model M3 Intelligence, Omron Healthcare Company, Limited). A finger-tip capillary blood sample was collected for blood glucose measurement, and venous blood was then drawn for the assessment of fasting insulin, glycated Hb, cholesterol (total, LDL and HDL), TAG, C-reactive protein, apoA1, apoB and γ-glutamyl transferase (GGT) levels.
The consumption of dietary supplements such as fish oil (seven subjects), probiotic-containing products (twenty subjects) and herbal extracts (three subjects) was stopped 2 weeks before the start of the trial and was not resumed during the wash-out period. Before each dietary phase, the participants attended an introductory session with the nutritionist, who explained the practical details of the upcoming dietary period.
The participants were asked not to alter their physical activity habits during the study. A pretrial questionnaire indicated that 11 % of the subjects had physical activity levels equivalent to 1 h/d or more and 54 % had levels equivalent to 30–60 min/d and 35 % reported a low activity level ( < 30 min/d). The subjects were also instructed to check their fasting body weight weekly. Variations greater than 1 kg were reported to the nutritionist, who suggested compensatory dietary modifications. The intake of key components in both D1 (legumes and barley products) and D2 (wheat products) was not affected by these modifications, which were only necessary for five of the subjects.
The food items provided for the 4-week D1 dietary period were as follows: canned brown beans (Phaseolus vulgaris cv. Katja, Kalmar-Ölands Trädgårdsprodukter) and chickpeas (Cicer arietinum, Zeta-Di Lucca AB); whole barley seeds (Finax AB); an experimental whole-grain barley bread, baked by Credin A/S. Some of the foods included in D2 were as follows: wheat bread (18 % whole grain, Kneipp type; Pågen AB); crisp rolls (60 % whole-grain wheat; Pågen AB); All-Bran Plus (Nordic Kellogg's). Additionally, cold-pressed rapeseed oil (Dr PersFood AB) and fish-based spreads (Kalles Kaviar and Creamed Salmon; Abba Seafood AB) were provided during both the dietary periods.
To assess dietary compliance, the participants completed a daily menu checklist covering each 4-week dietary period. These checklists included the ‘active components’ of D1 and the dietary fibre-providing items in D2. They also completed a questionnaire investigating their experience with each diet, including an estimation of the satiating power of the diet when compared with that of their regular regimen ( − 1 for ‘less satiating than the habitual diet’, 0 for ‘equally satiating’ and 1 for ‘greater satiating power’)(Reference Tovar, Nilsson and Johansson6). Coaching support was provided by the nutritionist, who contacted each participant at least once per dietary period.
The present study was conducted according to the guidelines laid down in the Declaration of Helsinki, and all procedures involving human subjects were approved by the Regional Ethical Review Board, Lund, Sweden (Dnr 2011/140). Written informed consent was obtained from all the subjects. Recruitment began in April 2011, and the experimental trials took place between September 2011 and May 2012. The study was registered at ClinicalTrials.gov as NCT01527253.
Diets
The participants ate their habitual diet before and between the experimental periods. A dietary habit questionnaire completed before randomisation to the starting dietary treatment was used to help the participants resume their eating habits during the wash-out period. To ensure good compliance, the participants were provided with a detailed 2-week rotating menu plan for each dietary period (D1 and D2) with all the food ingredients expressed in weight and/or volume measures. Electronic self-rating scales were made available whenever needed. The menu plan also included recipes for preparing meals.
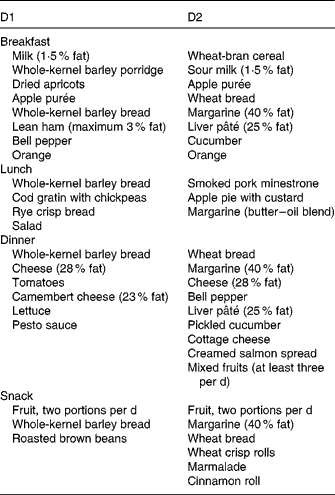
Both diets were designed in close agreement with the Nordic Nutrition Recommendations(17) and supplied 8786 kJ/d (2100 kcal/d), combining foods from plant and animal origins commonly available in food stores. D1 also included a whole-barley bread prototype. The nutritional profiles of D1 and D2 are given in Table 2.
Table 2 Nutritional profiles of diet 1 (D1, functional diet) and diet 2 (D2, control diet)* (Mean values with their standard errors)
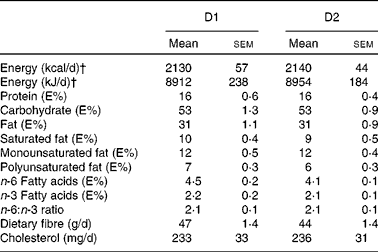
E%, percentage of energy.
* Mean daily values from 14 d (2-week rotating menu plan) with their standard errors.
† Increased energy intake was prescribed for subjects who experienced weight loss during the initial weeks (see Study protocol section).
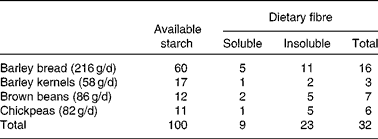
On a daily basis, D1 included 86 g (as eaten) brown beans, 82 g chickpeas, 58 g whole-grain barley kernels and 216 g whole-grain barley kernel bread. This bread contained whole barley kernels and whole-grain barley flour blended with a minor proportion of wheat flour (15 % of the DM). Based on previous studies showing overnight beneficial effects on glycaemic regulation(Reference Nilsson, Granfeldt and Östman12) and circulating markers of inflammation(Reference Nilsson, Ostman and Holst14, Reference Nilsson, Johansson and Ekström16), the aforementioned daily supply of legumes and barley was selected to provide 100 g of available carbohydrates, i.e. 77 g from barley and 23 g from the legumes (Table 3). Both diets provided similar amounts of cholesterol (D1: 233 mg/d; D2: 236 mg/d; Table 2) and total dietary fibre (D1: 47 g/d; D2: 44 g/d) (Table 3), with wheat-based products as the main fibre supplier in D2.
Table 3 Starch and dietary fibre supplied by barley and legumes in diet 1 (functional diet) (g/d)
The participants followed a 14 d rotating menu plan. A representative 1 d menu for D1 and D2 is given in Table 4. The participants were allowed to consume a limited amount of alcoholic beverages (30 g ethanol/week) during both the dietary periods. This limit, however, did not compel low drinkers to increase their usual ethanol consumption. Due to the low overall energy contribution from such contingent alcoholic drinks, they were not included in the estimation of the energy content of diets. The participants did not change their salt and coffee- and tea-drinking habits during the trial.
Table 4 Representative 1 d menus for diet 1 (D1, functional diet) and diet 2 (D2, control diet)

On the last day of the D1 dietary period, the participants ate an evening meal (1318 kJ (315 kcal), 10 g dietary fibre) containing 86 g of the experimental barley bread, 28 g chickpeas and 29 g brown beans, accompanied by margarine and vinegar. The D2 dietary period concluded with a dinner that included 34 g whole-grain wheat bread, 26 g whole-grain crisp rolls and 25 g All-Bran Plus (1297 kJ (310 kcal), 11 g dietary fibre).
Analyses
Routine blood tests were carried out at the Clinical Chemistry Laboratory/Skåne University Hospital Lund on fasting plasma (total cholesterol and HDL-cholesterol, TAG, apoA1, apoB, C-reactive protein and GGT), serum (insulin) or total blood (glycated Hb) samples. The concentrations of LDL-cholesterol were calculated(Reference Friedewald, Levy and Fredriksson18). Homeostatic model assessment of insulin resistance was calculated from fasting blood plasma glucose and serum insulin values(Reference Matthews, Hosker and Rudenski19).
The concentrations of fasting capillary plasma glucose were measured immediately after bleeding (HemoCue®B-glucose, HemoCue AB). Breath hydrogen levels were measured as an indicator of colonic fermentation, using an EC 60 Gastrolzser (Bedfont Scientific Ltd).
The compositions of the diets were analysed using the 2009 food database from the Swedish National Food Administration and a computerised calculation program (Dietist XP 3·1; Kost och Näringsdata AB).
The contents of soluble and insoluble dietary fibres(Reference Asp, Johansson and Hallmer20), as well as available starch(Reference Åkerberg, Liljeberg and Granfeldt21), were determined in chickpeas, brown beans and barley products included in D1.
Calculations and statistical analysis
Results are expressed as means with their standard errors. Data were evaluated by a mixed-model ANOVA with sequence and interaction between diets and start/end of treatment periods as fixed effects and participants within sequence and visit as random effects. Least-squares means were estimated for the start (D1/week 0 and D2/week 0) and end (D1/week 4 and D2/week 4) values for each diet. Least-squares means and CI were calculated for the differences among D1/week 0, D2/week 0, D1/week 4 and D2/week 4, as well as for the net difference between the diets, i.e. (D1/week 4 − D1/week 0) − (D2/week 4 − D2/week 0). Another set of analyses with body weight included as a continuous covariate was carried out. The analyses were carried out using SAS PROC Mixed (v. 8.2, SAS Institute, Inc.). Using the Framingham Study equation(Reference Anderson, Wilson and Odell22), 10-year CHD risk was calculated by considering age, sex, total cholesterol and HDL-cholesterol levels, smoking and systolic BP values. Blood marker and anthropometric data, including BP, were also subjected to a multivariate analysis (orthogonal partial least-squares discriminant analysis) using the SIMCA 13.0 software (MKS Umetrics AB)(Reference Eriksson, Johansson and Kettaneh-Wold23) for estimating overall difference between D1 and D2. Pearson's correlation analyses, using the MINITAB Statistical Software (release 13.32; Minitab, Inc.), were used to study relationships among the different biomarkers, satiety scores and results from the breath hydrogen tests. Values of P≤ 0·05 were considered statistically significant.
Power calculation
The primary outcome measure was change in plasma LDL-cholesterol levels. Assuming a 0·35 mmol/l (approximately 10 %) post-diet difference and a 0·8 sd(Reference Daryani, Berglund and Andersson24), with α = 0·05 and 1 − β = 0·8, a minimum of thirty-eight participants were required.
Results
Study population and dietary compliance
Baseline data (Table 1) confirmed the overall healthy condition of the cohort studied. In terms of blood lipids, the group can be considered to be mildly hypercholesterolaemic, borderline high for LDL-cholesterol, but with HDL-cholesterol and TAG values within the desirable range.
Adherence to both the dietary plans was good, with slightly greater compliance for D2 than for D1 (99 (sem 0·5) v. 97 (sem 0·3) %, respectively; P= 0·003). D1 was described as more satiating than the habitual diet by 75 % of the participants, while 63 % reported this sensation for D2. The overall daily satiety feeling with D1 was significantly greater than that with D2 (P= 0·001). Increased intestinal gas production was experienced by forty-one participants (90 %) with D1 than with their regular regimens. However, the majority of them (thirty-six subjects, i.e. 88 %) did not find this as a burden.
Anthropometric variables
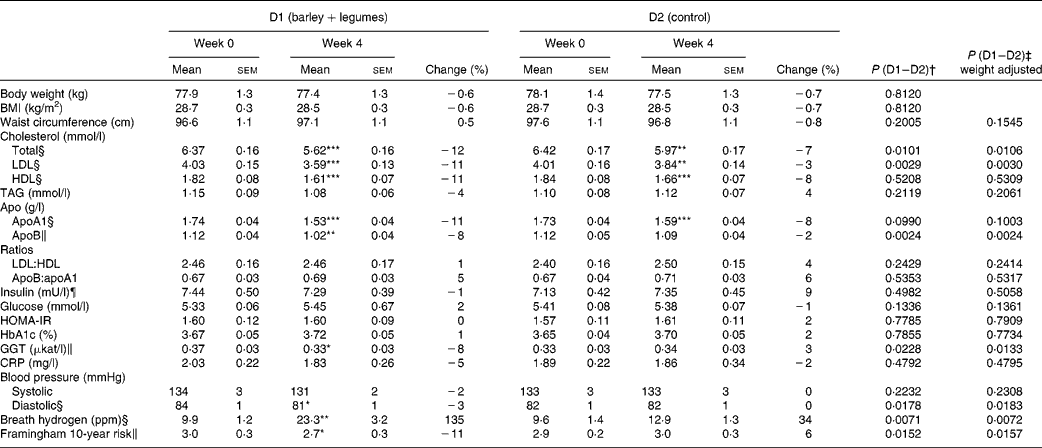
In accordance with the study design, body weight and BMI values did not change with any of the diets. No variation in waist circumference could be recorded either (Table 5).
Table 5 Effect of diet 1 (D1) and diet 2 (D2) on anthropometry, blood parameters, blood pressure, exhaled hydrogen and estimated cardiovascular risk (Mean values with their standard errors, n 46)
HOMA-IR, homeostatic model assessment of insulin resistance; HbA1c, glycated Hb; GGT, γ-glutamyl transferase; CRP, C-reactive protein; ppm, parts per million.
Mean values were significantly different from baseline (week 0): * P< 0·05; ** P< 0·001; *** P< 0·0001.
† P value for the comparison of changes after active diet and control diet consumption.
‡ P value for the comparison of changes after active diet and control diet consumption, after adjustment for weight change.
§ The overall effect of diet was significant (P< 0·0001).
∥ The overall effect of diet was significant (P< 0·05).
¶ 1 mU/l = 6·945 pmol/l.
Blood variables
Compared with baseline values, both diets reduced total cholesterol, LDL-cholesterol and HDL-cholesterol levels (Table 5). However, D1 had more pronounced effects on total cholesterol and LDL-cholesterol levels than D2 (P= 0·01 and P= 0·0029, respectively). Similarly, D1 had greater effect on apo fractions, particularly on apoB. None of the diets altered the LDL:HDL or apoB:apoA1 ratios.
Neither the glycaemic control variables measured (fasting glucose, insulin, homeostatic model assessment of insulin resistance and glycated Hb) nor the inflammatory marker C-reactive protein was affected by the diets. A significant decrease in circulating GGT levels was observed after D1 consumption (P= 0·05), but not after D2 consumption.
Blood pressure and cardiovascular risk
A significantly reduced ( − 3 %, P< 0·05) diastolic BP value was observed after D1 consumption, whereas D2 had no effect. None of the diets affected systolic BP. An 11 % lower (P< 0·05) overall cardiovascular risk score was calculated after D1 consumption, with no significant effect being observed after D2 consumption (Table 5).
Breath hydrogen
D1 promoted a 2·3-fold increase in fasting exhaled hydrogen levels (P< 0·001), while D2 had no significant effect (Table 5). The variation in breath hydrogen levels after D1 consumption exhibited a negative correlation with the change in systolic BP (r− 0·30 and P= 0·045). No other significant correlation among the different biomarkers could be recorded.
Discussion
A diet enriched with whole-grain kernel-based barley products, brown beans and chickpeas (D1) promoted reductions in plasma total cholesterol, LDL-cholesterol and apoliprotein B levels beyond those observed with a reference regimen rich in dietary fibre and complying with sound dietary recommendations. In addition to these changes in blood lipid profile, D1 decreased two other parameters associated with cardiometabolic risk, i.e. circulating GGT and BP. Furthermore, D1 also resulted in an 11 % drop in the Framingham cardiovascular risk estimate. Since the study was carried out in a cohort of mature women who had no medical condition besides mild hypercholesterolaemia, the present results may be of value for developing dietary strategies for the prevention of cardiometabolic diseases.
Overall, D1 promoted a 50 % greater improvement of risk markers than D2 (P< 0·0001), as estimated by the multivariate data analysis. The limited, but yet significant, effect of the reference diet (D2) on blood lipid profile reflects the improved nutritional quality of this regimen, including better fat composition and substantially increased dietary fibre supply (Table 2) in comparison with the habitual diet of the participants.
The important reduction in blood cholesterol fractions induced by D1 can be explained by the combined action of the functional components present in the two legumes and barley grains included in the diet. Whole barley kernels(Reference Nilsson, Granfeldt and Östman12, Reference Foster-Powell, Holt and Brand-Miller25), common beans(Reference Tovar, Granfeldt and Björck26) and chickpeas(Reference Nestel, Cehun and Chronopoulus27) have recognised low-glycaemic index features, and it has been shown that low-GI diets promote significantly improved lipid profiles in medium- and longer-term interventions, particularly with regard to lowered total cholesterol and LDL-cholesterol levels(Reference Frost, Leeds and Dore28–Reference de Rougemont, Normand and Nazare30).
Dietary fibre quality is another factor that may have played a role in the observed blood lipid response to D1. Diets having significant amounts of viscous fibres, such as β-glucans in barley(Reference Biörklund, van Rees and Mensink31) and the soluble indigestible fractions that characterise legume seeds(Reference Viuda-Martos, Lopez-Marcos and Fernandez-Lopez32), are acknowledged as cholesterol lowering(Reference Viuda-Martos, Lopez-Marcos and Fernandez-Lopez32–Reference Finley, Burrell and Reeves34). Besides the physico-chemical effects that viscous fibres have on the digestive/absorptive phase in the small intestine, the colonic fermentation of carbohydrates escaping ileal digestion may also have a beneficial impact on cholesterolaemia, via SCFA production. Propionate, in particular, acts as a negative modulator of hepatic cholesterol synthesis(Reference Jenkins, Kendall and Faulkner5, Reference Finley, Burrell and Reeves34). The indigestible fraction of cooked legumes and intact barley kernels is susceptible to fermentation by gut bacteria. In fact, dietary fibre, resistant starch and α-galactosides in legumes(Reference Tovar, Björck and Asp35–Reference Maathuis, van den Heuvel and Schoterman38), as well as β-glucans in barley(Reference Mitsou, Panopoulou and Turunen39), have been suggested as prebiotics. This idea is supported by recent evidence from meal studies carried out for a duration of 10–16 h indicating the prebiotic effects of the intrinsic indigestible fraction present in these foods(Reference Nilsson, Östman and Preston13, Reference Nilsson, Johansson and Ekström16). Moreover, supplementation of white wheat bread with resistant starch and dietary fibre from barley in amounts mimicking those of these carbohydrates present in barley kernel products has been shown to improve glucose regulation in healthy subjects, presumably through a mechanism involving gut fermentation(Reference Nilsson, Ostman and Holst14). Thus, the potential prebiotic action of legumes and barley has been proposed as a link between the consumption of these foods and the decreased levels of circulating markers of inflammation, with perceived impacts on cardiometabolic risk(Reference Nilsson, Ostman and Holst14, Reference Nilsson, Johansson and Ekström16). Polyphenols and phenolic acids, which are also abundant in common beans, chickpeas and whole barley kernels(Reference Hernandez-Salazar, Osorio-Diaz and Loarca-Pina40, Reference Gamel and Abdel-Aal41), may be additional substrates for colonic fermentation(Reference Parkar, Stevenson and Skinner42). The markedly higher breath hydrogen levels associated with D1 speak in favour of a mechanism associated with prebiotic effects. In fact, changes in exhaled hydrogen levels after D1 consumption exhibited a negative correlation with the change in systolic BP (r− 0·30 and P= 0·045).
Circulating GGT is another interesting biomarker the levels of which decreased with D1 consumption. High levels of this enzyme are indicative of non-alcoholic liver disease and are associated with incident diabetes, hypertension and vascular events(Reference Fraser, Harris and Sattar43). Recently, GGT activity has also been proposed as an independent predictor of the incidence of cardiometabolic risk(Reference Montonen, Drogan and Joost44, Reference Liu, Zhou and Fang45). Among the possible mechanism(s) behind the positive association between GGT and cardiometabolic risk, inflammation-related mechanisms may be involved(Reference Liu, Zhou and Fang45). Only a few studies have examined the influence of diet functionality on GGT(Reference Aller, De Luis and Izaola46, Reference Franzini, Ardigò and Valtuena47). Further investigation on the dietary modulation of this emerging risk marker may give deeper insights into its usefulness in preventive nutrition.
In spite of its relative simplicity, D1 has important anti-inflammatory, cholesterol-lowering, low-glycaemic index and potential prebiotic features, which are substantial components of effective multifunctional metabolic protective diets(Reference Tovar, Nilsson and Johansson6). This fact may be advantageous for sustaining adequate adherence to treatment in prolonged experimental trials or under common living conditions.
In full compliance with one of the study design premises, the beneficial action of D1 was observed in the absence of significant body weight reduction. Considering the appreciable satiating power mentioned by most participants, it is tempting to speculate about possible additional metabolic improvement under conditions where reduced voluntary intake may lead to weight loss. Such a possibility, as well as the potential impact of D1 on food intake-regulating hormones, may require further investigation.
Due to practical reasons, the present study was carried out in an exclusively female cohort, which limits the extrapolation of the results to the general population. Nonetheless, the general amelioration recorded is worth noting, since the association between cardiovascular events and altered metabolic profiles is greater in women than in men(Reference Gami, Witt and Howard48, Reference Rachas, Raffaitin and Barberger-Gateau49) and, in addition, responses to pharmacological treatments for dyslipidaemia are more limited in women than in males(Reference Mehner, Lindblad and Råstam50).
Conclusion
A diet combining the functional features of legumes and kernel-based barley products reduced the levels of different cardiometabolic diseases-related markers, including a comprehensive cardiovascular risk estimate, in a group of mature overweight women. The results are in accordance with previous evidence for the potential prebiotic beneficial action of these foods. This type of diet has potential for the dietary prevention of cardiometabolic diseases.
Acknowledgements
The authors thank Dr Peter Höglund (Region Skåne Competence Centre for Clinical Research, Lund) and Dr Olof Rosén (MKS Umetrics AB, Malmö) for their assistance with the statistical analysis. They also thank Ulla Johansson's for her skilful support in designing the menus and providing dietary coaching as well as Ingrid Ristilammi's for her help in recruiting and logistics management of participants.
The present study was funded by the Lund University Antidiabetic Food Centre, a VINNOVA VINN Excellence Centre, which had no role in the design and analysis of the study or in the writing of this article.
The authors’ contributions are as follows: I. B., J. T., A. N. and M. J. designed the research; A. N. and J. T. coordinated the dietetic instruction and coaching of the subjects; J. T. conducted the research and coordinated the whole study; J. T. and A. N. analysed the data; J. T. drafted the manuscript; J. T. and I. B. had primary responsibility for the final content. All authors revised, discussed and approved the final paper.
None of the authors has any conflicts of interest.


