During recent decades there have been considerable changes in lifestyle and dietary patterns in China. Prospective epidemiological studies have shown increased abdominal fat accumulation to be an independent risk factor for type 2 diabetes mellitus (T2DM). The number of people with diabetes in north-east China has been increasing rapidly. The 2002 China National Nutrition and Health Survey( Reference Wang, Kong and Wu 1 ) showed that there were more than 20 million people with T2DM and millions more with impaired glucose tolerance (IGT). It also indicated that there were over 260 million Chinese adults with abnormal weight( Reference Gu, Reynolds and Duan 2 , Reference Wang 3 ). As obese people are susceptible to diabetes, hypertension and other chronic diseases( Reference Cameron and Zimmet 4 ), it is essential to assess the relationship between anthropometric indices and diabetes risk in the north-east Chinese population and also to provide an effective screen for the presence of diabetes using highly sensitive and specific anthropometric indices.
The most widely used anthropometric index, BMI, gives information on total obesity( 5 ). The measurement of waist circumference (WC)( 6 ) and waist:hip ratio (WHR) is recommended for the assessment of central obesity. BMI, WC and WHR are the most commonly used indices, as they are simple and cheap tools for assessing body composition and different types of obesity. In 1998, the WHO recommended that a BMI greater than 25·0 kg/m2 be the criterion for overweight and greater than 30·0 kg/m2 for obesity, and presented international definitions for central obesity based on WC (i.e. ≥94 cm for men; ≥80 cm for women)( 5 ). Compared with Caucasian populations, Asian people, despite having a lower fat mass at the same body weight, have a higher presence of diabetes( Reference Cockram 7 ). According to the recommendations for Asians( 8 ), obesity was defined as BMI≥25·0 kg/m2. Moreover, for Chinese adults, the Working Group on Obesity in China has recommended the appropriate range of healthy weight and optimal cut-off points of BMI, WC and WHR. These recommendations proposed definitions for overweight (i.e. BMI≥24·0 kg/m2) and suggested that the WC cut-offs be 85 cm for men and 80 cm for women( Reference Bei-Fan 9 ) and that the WHR cut-offs be 0·90 for men and 0·85 for women.
Recently, it was discussed that weight:height ratio (WHtR) is not only more sensitive than BMI and WHR, but also that a cut-off point of 0·50 can be applied in all age and ethnic groups and both genders( Reference Ashwell and Hsieh 10 ). Several authors have proposed the use of WHtR as an indicator of central obesity, to enable adjustment for various body frame sizes( Reference Hsieh, Yoshinaga and Muto 11 ). All of the mentioned anthropometric indices have been found to be associated with T2DM( Reference Batty, Kivimaki and Smith 12 ). In Koreans, the maximum lifetime BMI (MAXBMI) of T2DM patients was significantly higher than that of control subjects (P<0·001)( Reference Park, Lee and Kim 13 ). It was reported in certain Chinese articles( Reference He, Zhai and Ma 14 , Reference Zhu, Wang and Heshka 15 ) that MAXBMI is a better screening indicator of the presence of T2DM.
Currently, to some extent, total and central obesity explanations for the presence of T2DM in China need more argument. Thus, the goals of the present study were to (i) estimate the strength of the associations of BMI, MAXBMI, WC, WHR and WHtR with T2DM and glucose tolerance abnormalities (i.e. T2DM and IGT), in order to (ii) test cut-off values of BMI, MAXBMI, WC, WHR and WHtR associated with the presence of T2DM and glucose tolerance abnormalities, in north-east Chinese adults.
Materials and methods
Participants
The present cross-sectional study was carried out among residents over 20 years of age, who were selected by a multistage random cluster sampling method to select the province, the city, the districts/counties and communities, in 2005. It was conducted in communities of every four districts and one county in the city of Mudangjiang, a region with a catchment population of 2·8 million in Heilongjiang Province in north-east China, with four districts and six counties. One thousand and seventy-one adults agreed to participate in the study; full relevant data were available for 530 males and 528 females. All potential participants were told the aim of the study and gave written consent before they were enrolled, and the authors followed the principles of the Declaration of Helsinki on biomedical research involving human subjects.
Methods
The anthropometric measurements and laboratory methods were the same in each community. Six trained professional staff completed the interview questionnaires. Body weight, height, WC, hip circumference (HC), blood pressure and 2 h post-load glucose (2hPG) were measured in all participants. Age, gender, race, family history of diabetes, smoking and drinking status were recorded with a standardized questionnaire. Smoking status included current smoking, non-smoking and ex-smoking. Drinking status included current drinking and non-drinking.
Anthropometric measurements
Body weight of the participants wearing light clothing without shoes was measured with 0·1 kg precision. For height, which was measured using a standard steel strip stadiometer to the nearest 0·1 cm, barefoot participants stood in erect posture, vertically touching their occiput, back, buttocks and heels on the wall, gazing horizontally in front and keeping the tragus and lateral orbital margin in the same horizontal plane( 16 ). BMI was calculated as [weight (kg)]/[height (m)]2. Each participant was asked to recall his/her maximum weight( Reference Park, Lee and Kim 13 ). MAXBMI was calculated as [maximal weight in the past (kg)]/[height (m)]2, which was BMI at the time of maximum weight since birth. WC was measured halfway between the costal border and the iliac crest at the end of exhalation( 16 ). HC was measured horizontally on the greater trochanters. WHR was calculated as [WC (cm)/[HC (cm)]( Reference Vazquez, Duval and Jacobs 17 ). WHtR was calculated as [WC (cm)]/[height (cm)]( Reference McCarthy and Ashwell 18 ). After each participant had been seated for 5 min, blood pressure was measured three times to the nearest 2 mmHg on the left arm using a standard sphygmomanometer. Diastolic blood pressure was recorded at the fifth Korotkoff sound. Hypertension was defined as systolic blood pressure ≥140 mmHg and/or diastolic blood pressure ≥90 mmHg. All these measurements were defined as the average of three measurements.
Laboratory methods
After an overnight fast and each participant had excreted, 75 g of anhydrous glucose dissolved in 300 ml of water was given orally in 5 min. A blood sample was drawn 2 h later for glucose determinations and immediately processed. Plasma glucose was detected in duplicate within 2 h by the glucose oxidase method. T2DM was defined as fasting plasma glucose ≥126 mg/dl (≥7·0 mmol/l) or 2hPG ≥200 mg/dl (≥11·1 mmol/l). IGT was defined as 2hPG between 140 mg/dl (7·8 mmol/l) and 200 mg/dl (11·1 mmol/l)( 19 ). Patients with an acute presentation suggesting type 1 diabetes, including diabetic ketoacidosis and heavy ketonuria (>3+), were excluded( Reference Ko, Chan and Yeung 20 ).
Statistical methods
Data were entered by two researchers into EpiData 3·0 software that could control the primary secured analysis of data and also be manually corrected by Microsoft® Access. Characteristics of the participants were compared by Student’s t test or Wilcoxon’s rank sum test and the χ 2 test for continuous and categorical variables, respectively. Spearman’s coefficient of partial correlation test was used between anthropometric indices. The area under the receiver-operating characteristic (ROC) curve (AUC), which takes values between 0 and 1, where 1 is a perfect screening test, was used to evaluate the accuracy of the diagnostic tests between T2DM or glucose tolerance abnormalities and BMI, MAXBMI, WC, WHR and WHtR at different cut-off points. The distance in the ROC curves( Reference Zhu, Wang and Heshka 15 ) was calculated according to the equation: [(1−sensitivity)2+(1−specificity)2]1/2. Youden’s index was calculated according to the equation: sensitivity+specificity−1; this takes values from −1 to 1, and the closer to 1, the better. The optimal cut-off value for anthropometric indices was based on the shortest distance and the highest value of the Youden’s index. Odds ratios and 95 % confidence intervals were calculated by logistic regression. The SAS statistical software package version 9·1 was used for statistical analyses. All P values were two-sided and those less than 0·05 were considered to indicate statistical significance.
Ethical approval
The study was approved by the Ethics Committee of the School of Public Health, Harbin Medical University. Informed consent was obtained from all participants.
Results
Table 1 summarizes the mean age, characteristics and mean anthropometric measurements of the men and women. There were significant differences by gender as follows. Men were more likely to be current smokers (P<0·001), drinkers (P<0·001) and to have hypertension (P=0·004) than women; while women had higher 2hPG levels than men (P=0·018). Men had significantly higher levels of WC (P<0·00) and WHR (P<0·0001). Men also had lower levels of maximal BMI than women (P=0·004). There were no significant differences between men and women in mean age, family history of diabetes, BMI or WHtR.
Table 1 Characteristics of the study population by gender: adults (n 1058) aged 20 years or over, north-east China, 2005

MAXBMI, maximal BMI in the past; WC, waist circumference; WHR, waist:hip ratio; WHtR, waist:height ratio; 2hPG, 2-h post-load glucose.
* Significant difference: P<0·05.
The prevalence of T2DM in the participants is shown in Fig. 1. There was a trend of increasing T2DM prevalence with age. As shown in Fig. 2, the same age trend also held true for glucose tolerance abnormalities, including T2DM and IGT status.
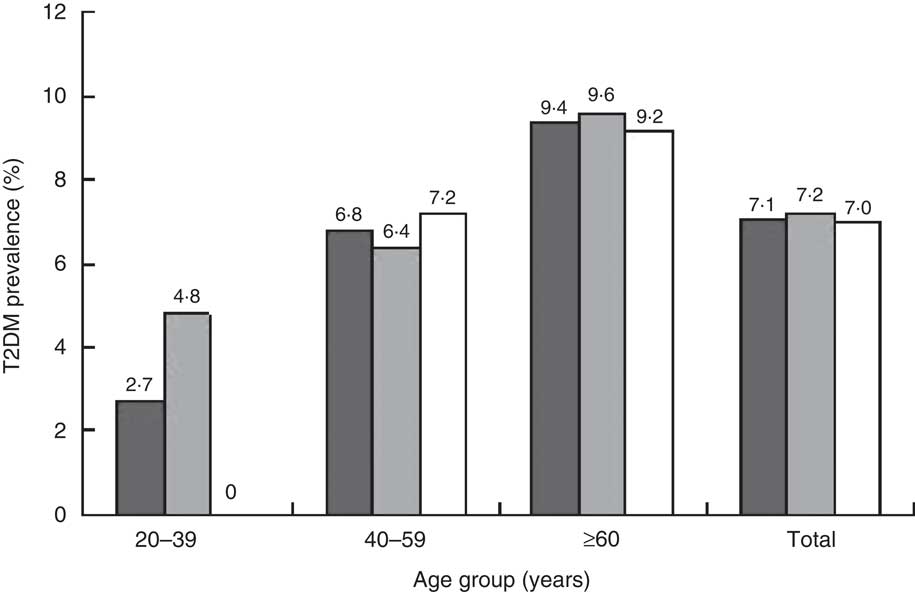
Fig. 1 The prevalence of type 2 diabetes mellitus (T2DM) according to age group among adults (![]() , men+women;
, men+women; ![]() , men;
, men; ![]() , women) aged 20 years or over (n 1058), north-east China, 2005
, women) aged 20 years or over (n 1058), north-east China, 2005
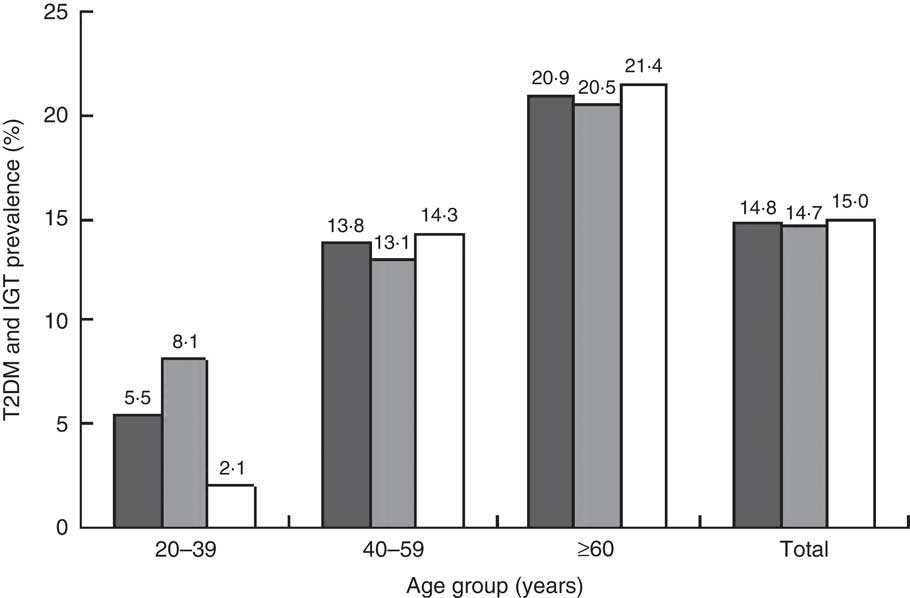
Fig. 2 The prevalence of glucose tolerance abnormalities (type 2 diabetes mellitus (T2DM) and impaired glucose tolerance (IGT)) according to age group among adults (![]() , men+women;
, men+women; ![]() , men;
, men; ![]() , women) aged 20 years or over (n 1058), north-east China, 2005
, women) aged 20 years or over (n 1058), north-east China, 2005
Figure 1 shows that there were more males with T2DM than females in the age group of 20–39 years and females aged 40–59 years had higher prevalence of T2DM compared with males. Figure 1 also demonstrates a sudden rise in T2DM prevalence in females between the two age groups of 20–39 years and 40–59 years, which also existed for the prevalence of glucose tolerance abnormalities in Fig. 2.
In the age group of 40–59 years, more females than males had T2DM and glucose tolerance abnormalities. Fewer males than females had glucose tolerance abnormalities in the age group of ≥60 years; however, more males than females in this age group had T2DM. Thus females got IGT on a large scale, compared with males, at ≥60 years of age.
The Spearman partial correlation coefficients between the anthropometric indices (BMI, MAXBMI, WC, WHR and WHtR) for the total group and each gender are shown in Table 2. Each anthropometric indicator had a significant association with the others. The coefficients of partial correlation between WHtR and WC, and between MAXBMI and BMI, were higher than the correlations seen between the other anthropometric indices.
Table 2 Coefficients of partial correlationFootnote * between anthropometric indices among adults (n 1058) aged 20 years or over, north-east China, 2005
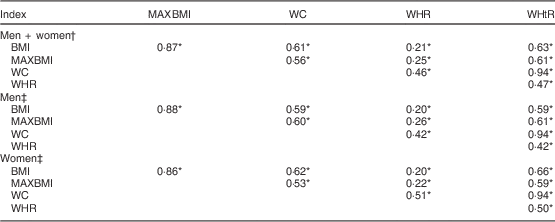
MAXBMI, maximal BMI in the past; WC, waist circumference; WHR, waist:hip ratio; WHtR, waist:height ratio.
* All correlations were statistically significant: P<0·05.
† Controlling for age and sex.
‡ Controlling for age.
Table 3 shows the coefficients of partial correlation between the anthropometric indices and 2hPG. The correlations between BMI and 2hPG, and between MAXBMI and 2hPG, had statistical significance. MAXBMI and 2hPG had a higher coefficient of partial correlation. The association between WC and 2hPG, and between WHtR and 2hPG, was not statistically significant for men, nor was the relationship between WHR and 2hPG for women.
Table 3 Coefficients of partial correlation between anthropometric indices and 2hPG among adults (n 1058) aged 20 years or over, north-east China, 2005

2hPG, 2-h post-load glucose; MAXBMI, maximal BMI in the past; WC, waist circumference; WHR, waist:hip ratio; WHtR, waist:height ratio.
* Significant correlation: P<0·05.
From Table 4, the AUC for the diagnosis of T2DM ranged from 0·54 to 0·61. In the main, the AUC for WHtR and MAXBMI were higher than those for WC, WHR or BMI. The AUC showed that WHtR above 0·52 had the largest AUC (0·61) for discrimination of T2DM, with a low Youden’s index (−0·089). The AUC of WHtR≥0·50 was 0·57 for discrimination of T2DM, with a low Youden’s index (0·174). In view of cut-off points analysed for all indices, MAXBMI≥23·0 kg/m2 reached the maximum value of OR (3·85, 95 % CI 1·53, 9·66), with the largest Youden’s index (0·718) and the shortest distance (0·226). The cut-off point of MAXBMI≥23·0 kg/m2 had a high sensitivity (93·3 %) and specificity (78·4 %).
Table 4 Association between T2DM and different anthropometric indices, as analysed by AUC of the ROC curves, among adults (n 1058) aged 20 years or over, north-east China, 2005
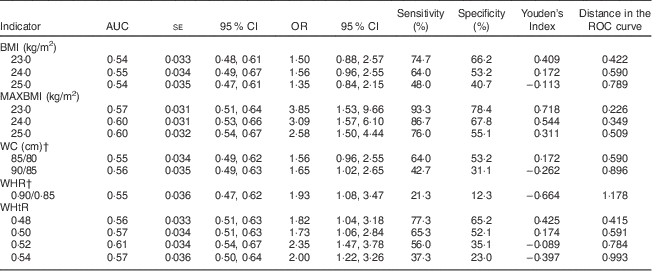
T2DM, type 2 diabetes mellitus; AUC, area under the curve; ROC, receiver-operating characteristic; MAXBMI, maximal BMI in the past; WC, waist circumference; WHR, waist:hip ratio; WHtR, waist:height ratio.
† Presented as value for men/value for women.
Additional analysis for the diagnosis of glucose tolerance abnormalities (T2DM and IGT) showed some similar results to the diagnosis of T2DM (Table 5). No matter which cut-off points were used, WHtR, MAXBMI, BMI and WC were all significantly associated with the presence of glucose tolerance abnormalities. The AUC of WHtR≥0·52 was superior to other indices in discriminating the presence or absence of glucose tolerance abnormalities (0·58), with a low sensitivity and specificity. The index MAXBMI≥22 kg/m2 had the largest Youden’s index (0·829) and shortest distance in the ROC curve (0·130). Participants with a threshold MAXBMI≥22 kg/m2 had 2·54 times more risk than those with a MAXBMI<22 kg/m2 to have glucose tolerance abnormalities. There also were fewer differences in the AUC of WC (men: 85 cm; women: 80 cm) and WC (men: 90 cm; women: 85 cm) for glucose tolerance abnormalities.
Table 5 Association between glucose tolerance abnormalities (T2DM and IGT) and different anthropometric indices, as analysed by AUC of the ROC curves, among adults (n 1058) aged 20 years or over, north-east China, 2005
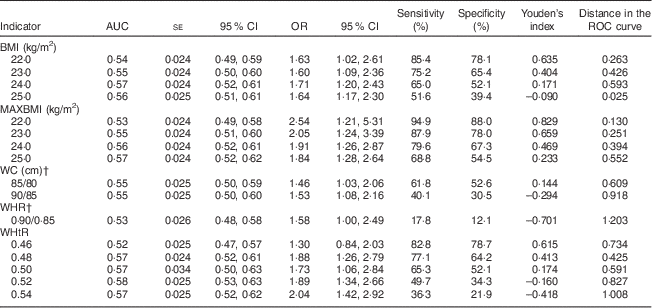
T2DM, type 2 diabetes mellitus; IGT, impaired glucose tolerance; AUC, area under the curve; ROC, receiver-operating characteristic; MAXBMI, maximal BMI in the past; WC, waist circumference; WHR, waist:hip ratio; WHtR, waist:height ratio.
† Presented as value for men/value for women.
Discussion
The trends of diabetes discrimination using easy indices among the north-east Chinese are different from those who live in other places of China, not just for the whole nationwide cut-off. The cut-off point of MAXBMI≥23·0 kg/m2 for screening T2DM, as well as that for screening glucose tolerance abnormalities (MAXBMI≥22·0 kg/m2), were better than other measurements. MAXBMI did not have gender differences, was simple and low cost.
This is inconsistent with the current definitions of overweight (BMI≥24·0 kg/m2) recommended by the Working Group on Obesity in China( Reference Bei-Fan 9 ) or the recommendation of BMI≥25·0 kg/m2 as the overweight threshold according to the WHO( 5 ). Data from cohort studies in the USA, Germany, Sweden, Japan, Korea, Taiwan, Mexico and a cohort of Chinese women have shown that BMI is associated with increased risk of developing diabetes( Reference Vazquez, Duval and Jacobs 17 , Reference Hartemink, Nagelkerke and Jacobs 21 , Reference Rosenthal, Jin and Shu 22 ). Our results showed that the cut-off point of BMI≥24 kg/m2 was associated with T2DM and glucose tolerance abnormalities (OR=1·56 and 1·71, respectively), which was nearly equal to the meta-analysis result (OR=1·87) of BMI increasing diabetes risk( Reference Vazquez, Duval and Jacobs 17 ). However, this is in contrast with the results of a study by the Chinese Centers for Disease Control and Prevention which showed that diabetes was three times more prevalent in those with a BMI of 24·0 kg/m2 or more( Reference He, Zhai and Ma 14 ). This can probably be attributed to the influence of selection for samples or the diversity of Chinese dietary patterns and dissimilar ethnic group distributions.
Some previous studies have reported that maximum BMI in the past as well as current BMI is correlated significantly with T2DM, serum C-peptide level and insulin resistance( Reference Park, Lee and Kim 13 ). However, there are few studies about the MAXBMI threshold for increasing risk of T2DM in China. There are widely accepted reference values to define abdominal obesity by WHtR for Chinese people (WHtR≥0·50, no sex restriction), which may not fit well for north-east Chinese to screen the presence of T2DM as illustrated by the present study. Our study showed the cut-off point of MAXBMI≥23·0 kg/m2 combined with WHtR≥0·52 to indicate high risk of T2DM for both men and women, which needs more and further longitudinal studies to find the reason.
The cut-off point of WC for the association with T2DM was 85 cm for men and 80 cm for women in the present study. These figures are different from the WHO criteria of central adiposity (WC≥94 cm for men and ≥80 cm for women)( 5 ), but are consistent with Chinese national data for the WC cut-off point( Reference He, Zhai and Ma 14 ). WC was closely related with diabetes in women, but not in men, in our study, which was also found in Turkish adults( Reference Can, Bersot and Gönen 23 ). The limits existed when WC was used for screening or health education for the different sexes.
Our study also illustrated that WC as an indicator of T2DM had low sensitivity, specificity and Youden’s index. WC≥85 cm for men and WC≥80 cm for women was associated with 1·56 times the risk of T2DM presence, in comparison with the meta-analysis on WC use in screening incident diabetes (OR=1·87, 95 % CI 1·58, 2·20) and WHR in increasing T2DM risk (OR=1·88, 95 % CI 1·61, 2·19)( Reference Vazquez, Duval and Jacobs 17 ), while the OR we established for WHR risk was 1·93. Vazquez et al.( Reference Vazquez, Duval and Jacobs 17 ) did a meta-analysis in 2007 to find out a better choice among the indices of BMI, WC and WHR through thirty-two studies; they proposed that the usefulness of WC or WHR is better than that of BMI, which requires more research.
In our study, we confirmed that the AUC of WHtR of 0·52 was superior to the AUC of BMI, WC and WHR measures, which was also found in recent studies. For instance, WHtR appeared to be a better diabetes-associated factor than WC in a follow-up of adult men from Tehran( Reference Hadaegh, Zabetian and Harati 24 ). In Japanese adults, WHtR was more strongly associated with T2DM than was WHR( Reference Hsieh, Yoshinaga and Muto 25 ). So far, WHtR as an effective predictor of diabetes has been evaluated in the general Chinese population( Reference He, Zhai and Ma 14 ) and the highest AUC was observed for the 0·52 cut-off in both men and women, also in comparison with BMI and WC. Thus, WHtR is a good associated factor of T2DM among Chinese adults. However, we consider that the cut-off value of 0·50, widely proposed( Reference Ashwell and Hsieh 10 , Reference He, Zhai and Ma 14 ) to define abdominal obesity by WHtR for Chinese people (no sex restriction), may not be a good choice for north-east Chinese; a finding which deserves further research. One of the advantages of the WHtR over WC is the potential to use an overall cut-off value, possibly also in children( Reference McCarthy and Ashwell 18 , Reference Savva, Tornaritis and Savva 26 ). But in a previous study in a population aged ≥35 years from a Polish town, this indicator WHtR for T2DM was not a better than WC( Reference Lopatynski, Mardarowicz and Szczesniak 27 ).
Although WC is a simple measure of abdominal obesity and T2DM screening, it assumes that people with the same WC would have the same T2DM risk regardless of differences in height. However, this assumption is invalid, as the percentage of body fat and WHR are higher for shorter individuals compared with taller individuals with the same BMI( Reference Lopez-Alvarenga, Montesinos-Cabrera and Velazquez-Alva 28 ). Diabetes has also been shown to be more prevalent in short-stature compared with taller individuals even after adjusting for confounders( Reference Lara-Esqueda, Aguilar-Salinas and Velazquez-Monroy 29 ), and a recent cohort study showed that the predictive power of WC for incident hypertension was improved when WC was corrected with height or HC( Reference Fuchs, Gus and Moreira 30 ). In addition, WHR can remain the same even when there is a change in body size because WC and HC could increase or decrease proportionately; nevertheless, WHtR would change when there is a change of waist or height, while adults with different height approximately maintain different waist. MAXBMI contains information on the maximal body weight and stature, and a history of past obesity was associated with increased insulin secretion and higher levels of serum C-peptide in Far East Asians( Reference Park, Lee and Kim 13 ). Such changes may explain why MAXBMI and WHtR could be a better anthropometric index among these indices. Additionally, compared with other indices, WHR is also more susceptible to measurement errors.
We combined MAXBMI and WHtR and wished to examine whether this new measure could improve the screening power. Our study showed that the combination of MAXBMI with WHtR increased the discriminatory capability of WHtR for T2DM or for glucose tolerance abnormalities. It was not likely to relate with the meta-analysis results in 2008 that the combinations of BMI and abdominal obesity measures (WC, WHR or WHtR), in turn, did not increase the discriminatory capability of BMI for T2DM( Reference Lee, Huxley and Wildman 31 ).
The areas under ROC curves in our study showed some differences with other studies( Reference Can, Bersot and Gönen 23 , Reference Mansour and Al-Jazairi 32 ); their AUC of obesity measures (BMI, WC, WHR or WHtR) for T2DM ranged from 0·59 to 0·75, but our results showed the range of AUC was about 0·60. The reasons for this discrepancy need further study. In addition, the relationship above was also found in glucose tolerance abnormalities.
There are some limitations to the present study that should be considered and need further research. First, all data were obtained from a survey (response rate: 95·8 %) in four districts and one county, including a small-sized sample of the population of north-east Chinese. Although most questions on our survey were taken directly from the citations, some items have some recall bias. A third limitation was that the survey was not conducted in all ethnic groups of Chinese, with few minorities in the sample. As this was a cross-sectional survey, future studies using longitudinal data would provide stronger evidence on this evaluation. A final limitation is that there may be inherent differences between people who agreed to participate in the study and those who did not (selection bias), which may have biased the results in either direction.
Conclusions
Despite these limitations, the present study provides a better anthropometric index, MAXBMI combined with WHtR≥0·52, to indicate increasing risk of T2DM (MAXBMI≥23·0 kg/m2) or glucose tolerance abnormalities (MAXBMI≥22·0 kg/m2). This is inconsistent with the current definitions of overweight (BMI≥24·0 kg/m2) recommended by the Working Group on Obesity in China.
Acknowledgements
Financial support: This research received no specific grant from any funding agency in the public, commercial or not-for-profit sectors. Conflict of interest: None. Authorship: Authors W.W. and X.X. contributed equally to this work. W.W. and X.X. conceived of the study. W.W., X.X. and B.-Y.W. participated in the design of the study. W.W., X.X., F.-F.Z. and B.-Y.W. participated in the data collection and coordination. W.W., X.X. and B.-Y.W. performed the statistical analysis and drafted the manuscript. B.-Y.W. and E.J.L. carried out critical revision of the manuscript for important intellectual content. All authors read and approved the final manuscript. B.-Y.W. had full access to all of the data in the study and takes responsibility for the integrity of the data and the accuracy of the data analysis. Ethics of human subject participation: The study was approved by the Ethics Committee at the School of Public Health, Harbin Medical University.


