1. Introduction
Japanese Antarctic Research Expeditions (JARE) have observed the surface mass balance along many traverse routes in the area from west Enderby Land to east Dronning Maud Land, East Antarctica, for 25 years (Fig. 1). Along the route between Syowa Station (69°00′S, 39c35′E, 20 m a.s.l.) and Mizuho Station (70°42′S, 44°20′E, 2230 m a.s.l.), the surface mass balance has been observed every year by the snow-stake method since 1968. In the Glaciological Research Program on Mizuho Plateau from 1969 to 1975, surface mass-balance observations were carried out from the Yamato Mountains area in the west to the Sandercock Nunataks in the east. In the Glaciological Research Program in east Dronning Maud Land from 1982 to 1987, the observations were carried out over a wider area from the Sør-Rondane mountains area to the Mizuho Plateau including the highest point in east DronningMaud Land, Dome F (77°22′S, 39°37′E, 3800 m a.s.l ).. All these surface: mass-balance data have been compiled to obtain the distribution of surface mass balance in east Dronning Maud Land.
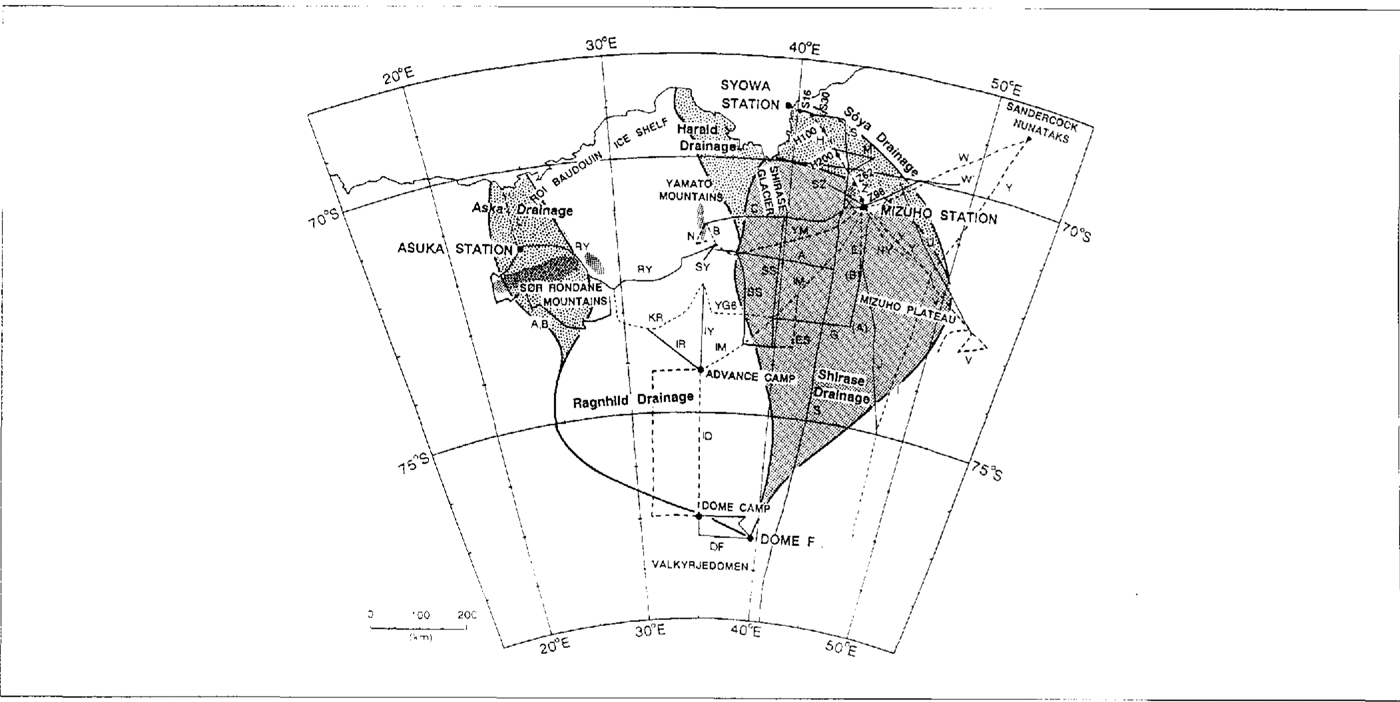
Fig. 1. Traverse routes on east Dronning Maud Land by Japanese Antarctic Research Expedition (JARE) The observation area is divided into five drainage basins, Asuka, Ragnhild, Harald, Shirase and Soya Drainage Basins.
2. Snow accumulation observed by the snow-stake method
At 2349 points along the 16 traverse routes on the ice sheet, snow stakes 2.5 m long were usually placed at intervals of 2 km (Table 1). Their height change with time was measured to determine snow accumulation.
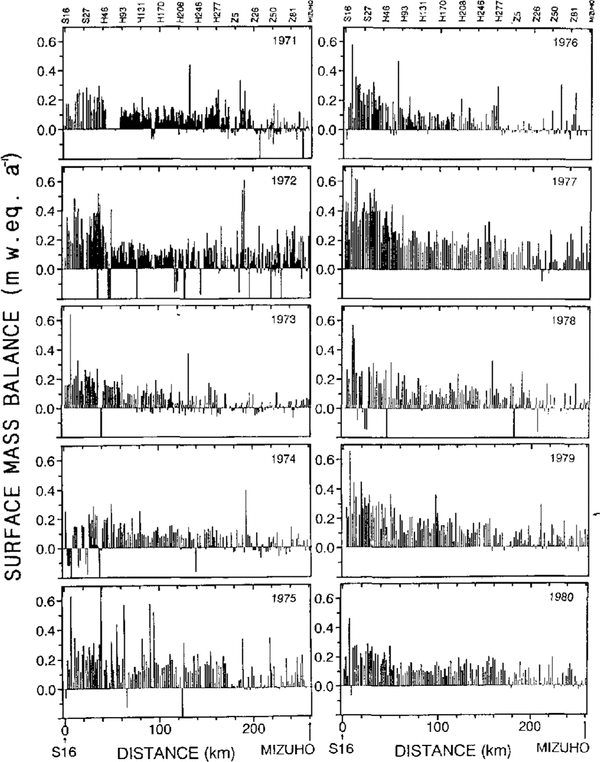
The surface mass balance was obtained by multiplying snow density by the accumulation. The surface mass balance along the route from S16 : (69°02′ S, 40°03′E, 553 m a.s.l.) near Syowa Station to Mizuho Station from 1971 to 1980 is shown in Figure 2. The route passes through three routes of S, H and Z. Though the annual accumulation varied year to year, we can see the regional characteristics along the traverse route. There is a region where the surface mass balance was constantly small or negative every year, as at distances of about 180 and 230 km from S16, while it was constantly large in the area between 50 and 150 km.
The snow-stake method for surface mass balance is easy to carry out but there is a difficult problem concerning variability with time and place. On the katabatic wind slope of the ice sheet, the wind redistributes the snow accumulation forming sastrugi and dunes. To avoid such variability as much as possible, we should measure the surface mass balance for a long period, or obtain a mean value among many observation points.
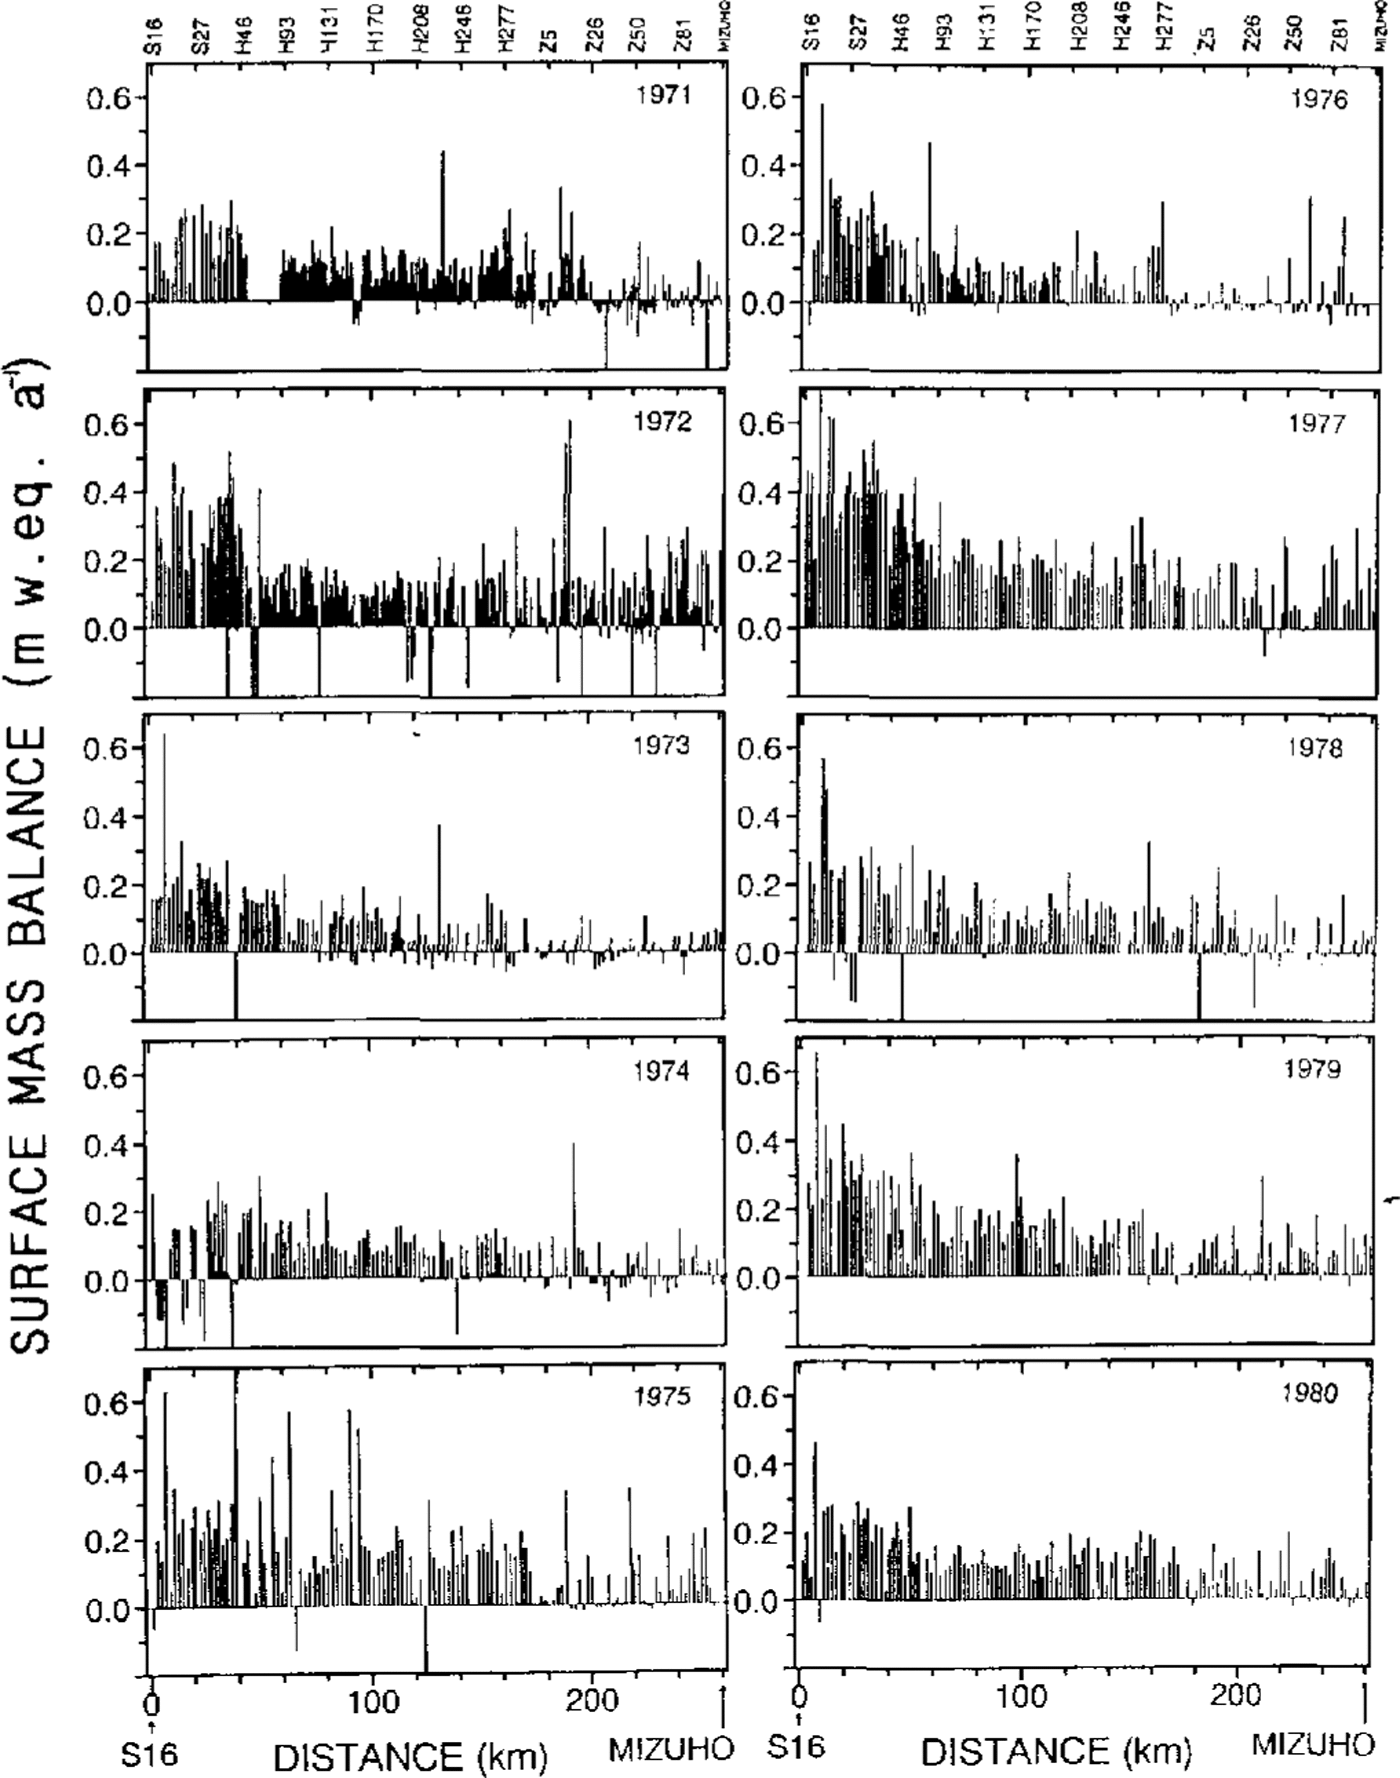
Fig. 2. Surface mass balance observed by the snow-stake method along a route from S16 (69°02′ S, 40°03′E, 553ma.s.l.) to Mizuho Station (70°42′S, 44°20′E, 2230m a.s.l.).
The cumulative snow accumulation along the route between Syowa Station and Mizuho Station from 1971 to 1986 is shown in Figure 3. In the coast zone between S16 and S30, the snow accumulation was large and depended on altitude; it was largest at S20 (653 m a.s.l.). In the accumulation zone between H100 and H200 (1300–1590 m a.s.l.), the accumulation increased steadily with only minor fluctuations. In the strong katabatic wind zone between Z62 and Z98 (2110–2200 m a.s.l.), the accumulation was small. Thus, the cumulative snow accumulation for more than 10 years can show the regional features of snow accumulation.

Fig. 3. Cumulative snow accumulation obserued by the snow-stake method from 1971 to 1986 along route S-H Z. (a) In the coastal region along S18 S27 (620–920 m a.s.l.),. (b) In the accumulation region along H100 H200 (1300 1590 m); (c) In the katabatic wind region along Z62 Z98(2110–2200 m).
Table 1. Traverse routes for snow accumulation observation

3. Snow accumulation observed by other methods
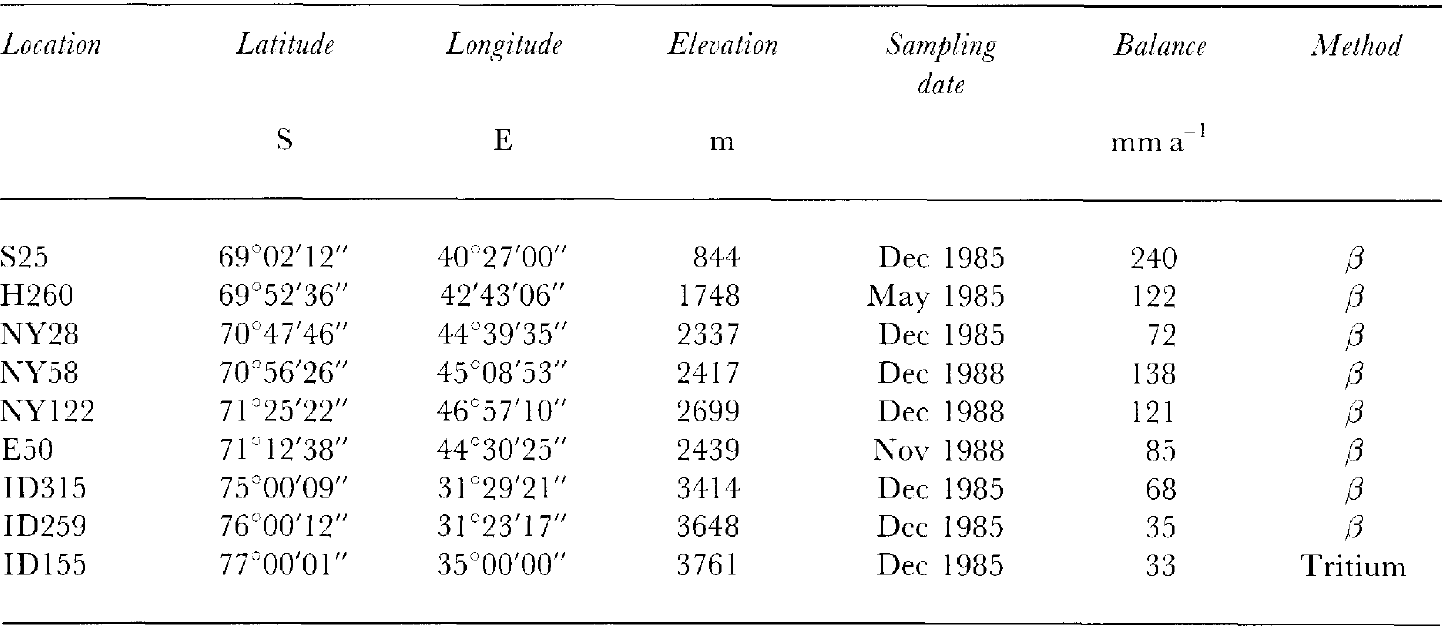
Gross β activity was measured on melt samples of ice cores at intervals of about 10 cm depth. In the gross β profile, large activity levels originating from nuclear experiments appear in layers formed in 1955 and 1965 (Reference Picciotto and WilgainPicciotto and Wilgain, 1963; Reference CrozazCrozaz, 1969). The snow accumulation can be estimated from the depths of these reference layers. This estimation was made at nine points in east Dronning Maud Land (Table 2).
From the vertical profile of grain-size in an ice core, Reference Narita and MaenoNarita and Maeno (1979) tried to estimate the snow-accumulation rate. Taking into account the growth rate of ice crystal grains under a load, they obtained the net annual accumulation of 70 mm a−1 at Mizuho Station. This method needs a temperature profile and an assumption of constant accumulation rate but it is useful in a region where the seasonal variation cannot be recognized.
4. Snow density
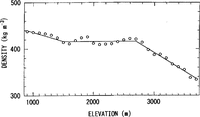
The surface-snow dcnsity is necessary to obtain surface mass balance from snow accumulation. Whcn JARE made a traverse from Syowa Station to Plateau Station along route S in 1967–68, mean snow density from the surface to 2 m depth was measured at intervals of about 10km (Reference Fujiwara and EndoFujiwara and Endo, 1971). As shown in Figure 4, at an altitude between 1500 and 2700 m the density was constant, about 416 kg m−3 on average. It decreased from 900 to 1500 m elevation and decreased in the inland region above 2700 ma.s.l.
The snow density depends on many factors, such as snow-crystal type, accumulation rate, lapse time after deposit, temperature, humidity, wind speed and other meteorological conditions. It is difficult to represent the snow density as a function of all these factors. To simplify the equation, the temperature is considered to be the main variable related to snow density. If the density varies mainly with temperature, the dependence of snow density on altitude can be explained by the lowering of temperature with altitude. Therefore, as a rough approximation, we used the simple relation between snow density and altitude shown in Figure 4 (a solid line) to obtain surface mass balance.

Fig. 4. Snow density versus elevation along route S from S31 (69°03′S, 40°43′ E, 961ma.s.I.) to S654 (79°06 S, 40°33′ E, 3618ma.s.l.). Circles are mean density ever v100 m in altitude. The solid line shows the simplified relation used to estimate water equivalent of surface mass balance from snow accumulation and elevation.
Table 2. Surface mass balance (in w.e.) estimated from gross β radioactivity and tritium profiles
5. Precipitation
Precipitation in polar regions is difficult to measure in an ordinary way, because a snow-gauge is not reliable owing to the strong katabatic winds.
At Mizuho Station, precipitation was measured during a drifting-snow observation. Assuming that all the snow was due to precipitation at 30 m height, Reference Kobayashi, Ishikawa and OhataKobayashi and others (1985) obtained a value of l40 mm a−1 for .the annual precipitation in 1980 from the snow-flux observation. By the same method, Reference TakahashiTakahashi (1985) obtained 260 mm a−1 as the precipitation rate in 1982 and 230 mm a−1 by distinguishing precipitation from the drift flux at 1m height (Fig. 5). Thus, the average precipitation was roughly 200 mm a−1 at Mizuho Station, within a wide range between 100 and 300 mm a−1, whereas the snow accumulation was estimated as 70 mm a−1 by grain-growth rate (Reference Narita and MaenoNarita and Maeno, 1979).
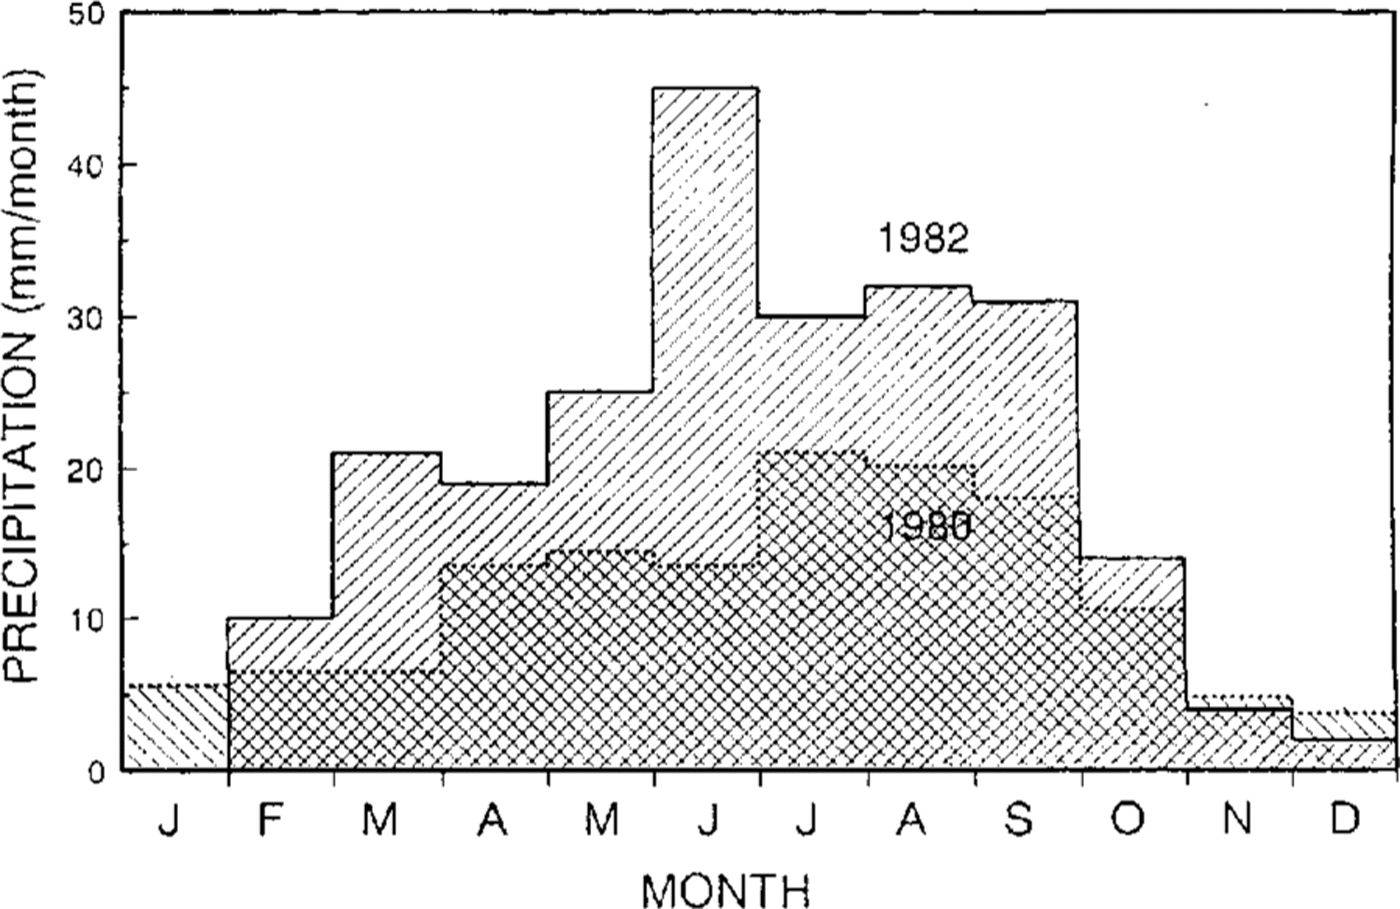
Fig. 5. Seasonal variation of precipitation at Mizuho Station (2230 m a.s.l.). Annual precipitation was 140 mm a−1 in 1980 (Reference Kobayashi, Ishikawa and OhataKobayashi and others, 1985) and 230 mm a−1 in 1992 ( Reference TakahashiTakahashi, 1985).
6. Sublimation from the surface
While ablation due to melting is limited to the coastalregion, sublimation from ice to water vapor occurs all over the ice sheet and plays an important role in the surface mass balance as a negative component.
Reference Fuji and KusunokiFujii and Kusunoki (1982) obtained an annual sublimation of about 50 mm a−1 as the loss at Mizuho Station for the period 1977–88 using the stake method and weighing an evaporimeter filled with ice. Reference Takahashi, Endoh, Azuma and McshidaTakahashi and others (1992) obtained an annual sublimation of 52 mm a−1 at Mizuho Station in 1982 by the evaporimeter method. In the seasonal variation, a large amount of sublimation occurs in summer from October to February. while much smaller amounts of sublimation and solidification alternate, with net solidification, in winter.
On a bare-ice surface, sublimation causes a large loss of ice from the surface. At Seal Rock in the Sør-Rondane, the sublimation was 200–280 mm a−1 . This large sublimation was explained by the low albedo of the bare-ice surface (Reference Takahashi, Endoh, Azuma and McshidaTakahashi and others, 1992).
7. Redistribution by drifting snow
The surface mass balance tends to depend on the ice-sheet topography. In Figure 6, the surface mass balance measured by the snow-stake method is shown on a cross-sectional profile of the ice sheet. On a large scale, the balance is small on the convex topography in the zones 250–350 km and 640–660 km from the coast, and large on the concave topography from 350 to 550 km. The same tendency is seen on a small scale over a short distance of 10–30 km; the balance was small on convex areas at 260 and 650 km. A similar relation between local mass balance and topography has been reported in other inland areas of Antarctica (Reference SchyttSchytt, 1955; Reference SwithinbankSwithinbank, 1958; Reference Black and BuddBlack and Budd, 1964; Reference Gow, deBlander, Crozaz and PicciottoGow and others, 1972; Reference WhillansWhillans, 1975)
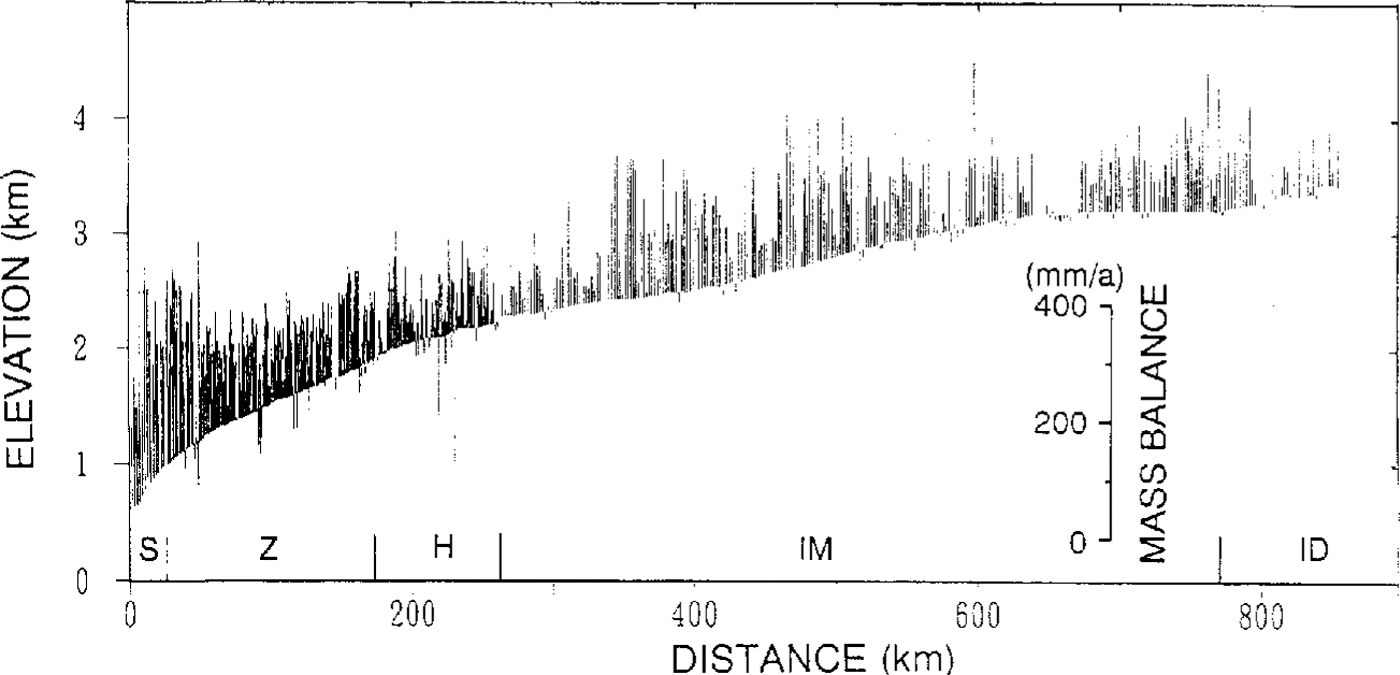
Fig. 6. Surface mass balance along route S–H–Z–IM–ID. surfacemass balance is expressed as bars on a cross-sectional profile of the ice sheet. Positive values are Plotted above the ice sheet surface and negative values below the surface.
This dependence of surface mass balance on topography is explained by redistribution of snow accumulation as follows. On the slope of the ice sheet in Antarctica, katabatic winds are formed by the gravitational force of cold air masses and generate drifting snow throughout the year. If the wind speed is accelerated on convex topography because the slope increases, the drift-transport rate increases along a wind-stream line and the surface snow layer is eroded. In other words, when considering the two-dimensional wind flow, horizontal divergence of drifting snow causes the erosion of surface snow. The opposite happens on concave topography; the horizontal convergence of drifting snow causes snow to deposit on the surface.
Reference Takahashi, Naruse, Nakawo and MaeTakahashi and others (1988) calculated the horizontal divergence of drifting snow from the ice-sheet topographyon Mizuho Plateau, using a relationship between drift-transport rate and wind speed as a function of surface slope. The results explain the existence of the bare-ice fields around the region south of the Yamato :Mountains.
At Mizuho Station, the loss due to horizontal divergence is estimated to be about 100 mm a−1), which agrees with the precipitation of 140–260 mm a−1, sublimation of 50 mm a−1 and surface mass balance from grain growth of 70 mm a−1.
8. Surface mass balance in east dronning maud land
The snow accumulation measured by the snow-stake method at more than 2300 points along 16 traverse routes is shown in Figure 7 as bar lengths. The results of gross β activity and tritium analysis are also plotted in this figure. From these data, the isolines of surface mass balance were drawn (Fig. 7).
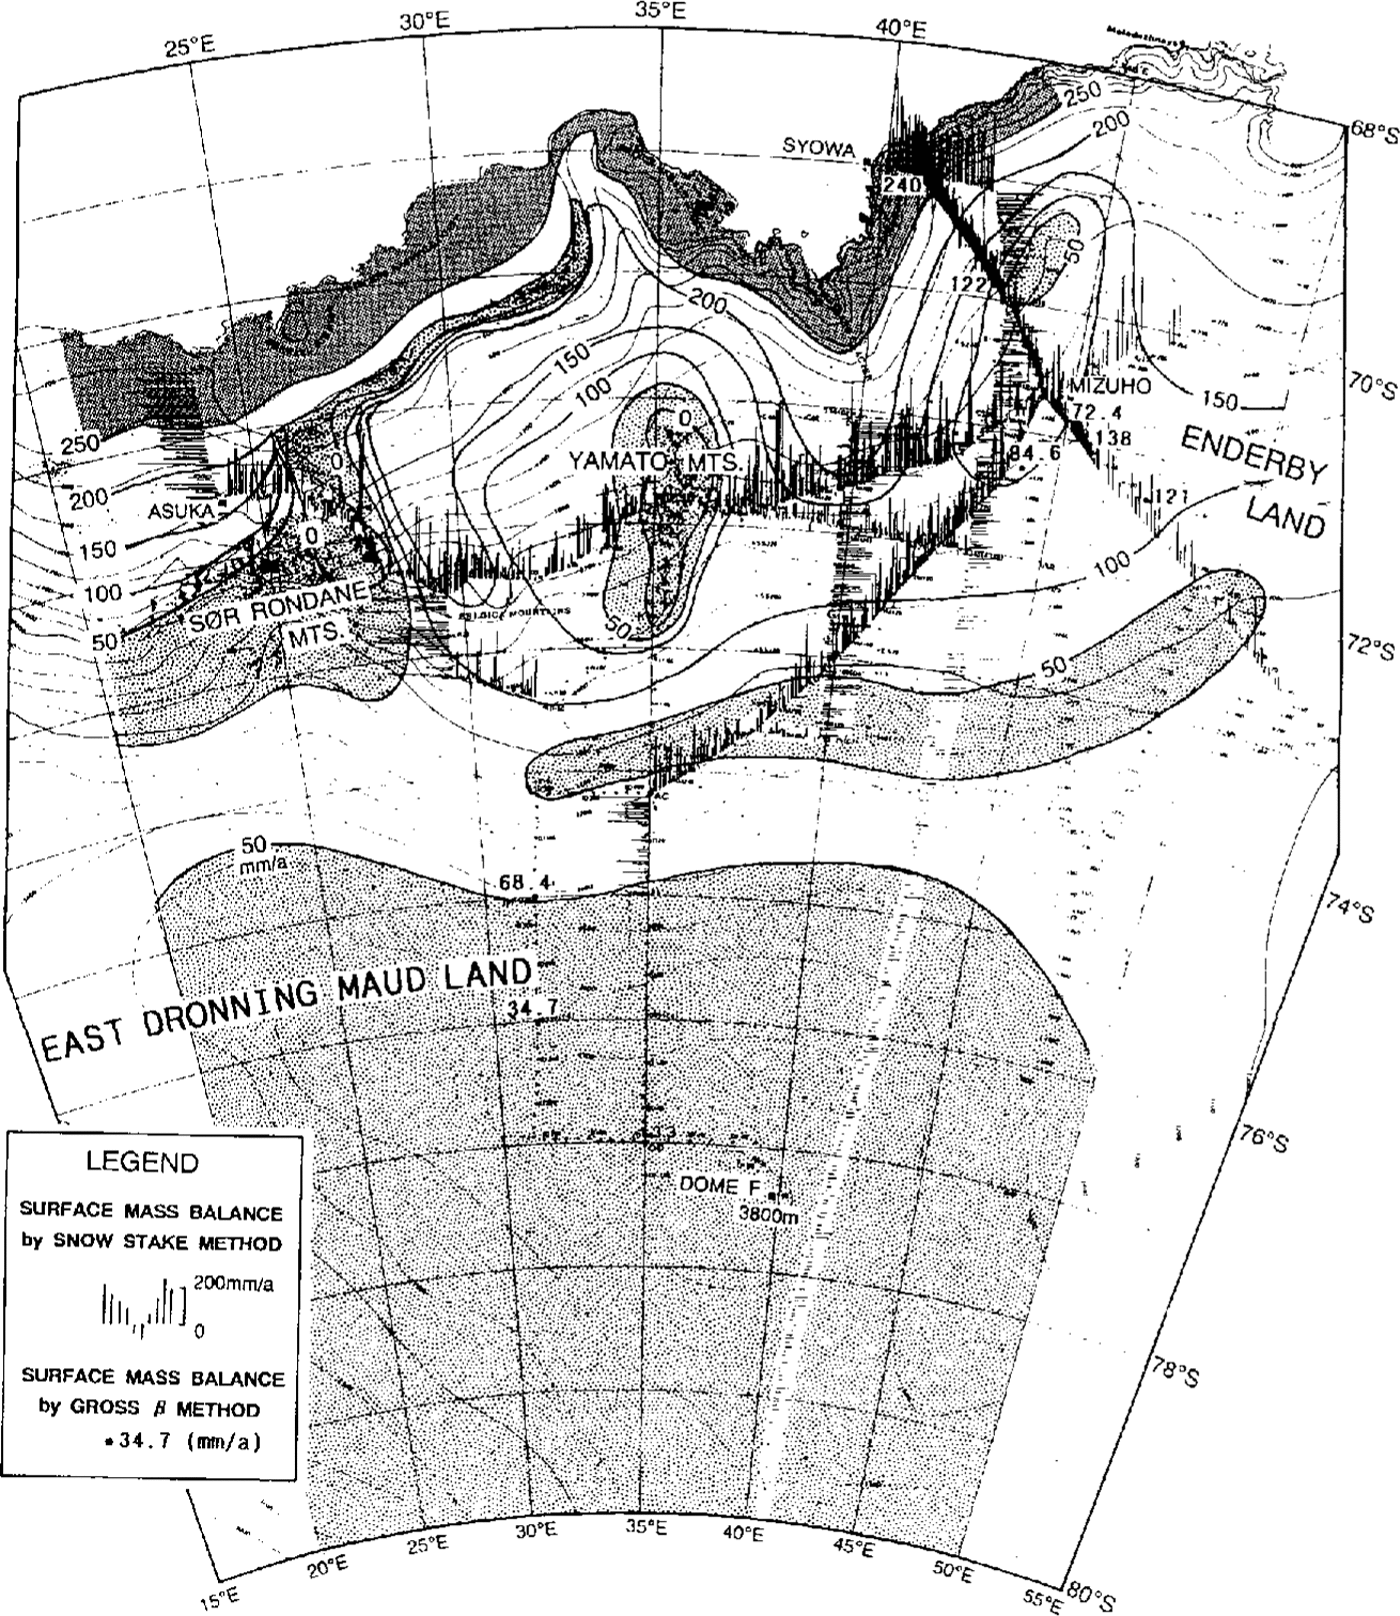
Fig. 7. Surface mass balance in east Dronning Maud Land. Solid lines are isolines of surface mass balance (mm a−1 in water equivalent). Bars show snow-surface mass balance measured by the snow-stake method at each stake. Values at solid circles are surface mass balance obtained from gross β activity and tritium profiles shown in Table 2.
Generally, the surface mass balance decreased with distance from the coast: from more than 250 mm a−1(w.e.) in the coastal region to less than 50 mm a−1in the inland region more than 600 km from the coast and higher than 3500 m altitude.
In the vicinity of mountainous areas, the surface mass balance was negative, i.e. a bare-icc surface is present. On the bare-ice surface, loss by sublimation prevails and the balance shows large negative values (Reference Takahashi, Naruse, Nakawo and MaeTakahashi and others, 1988).
In the inland area between 3000 and 3200 m altitude, the surface mass balance shows a local minimum, less than 50 mm a−1, although there are no mountains in the neighborhood. This low-balance area can be explained by redistribution of snow accumulation by drifting.
Reference Giovinetto and BullGiovinetto and Hull (1987) have compiled surface mass-balance data for the whole icc sheet of Antarctica. In their results, the balance around Yamato Mountains was taken into account but recent information on this area was not used, because the data had not been published at that time. The most recent results for the surface mass balance around east Dronning Maud Land arc shown in Figure 7.
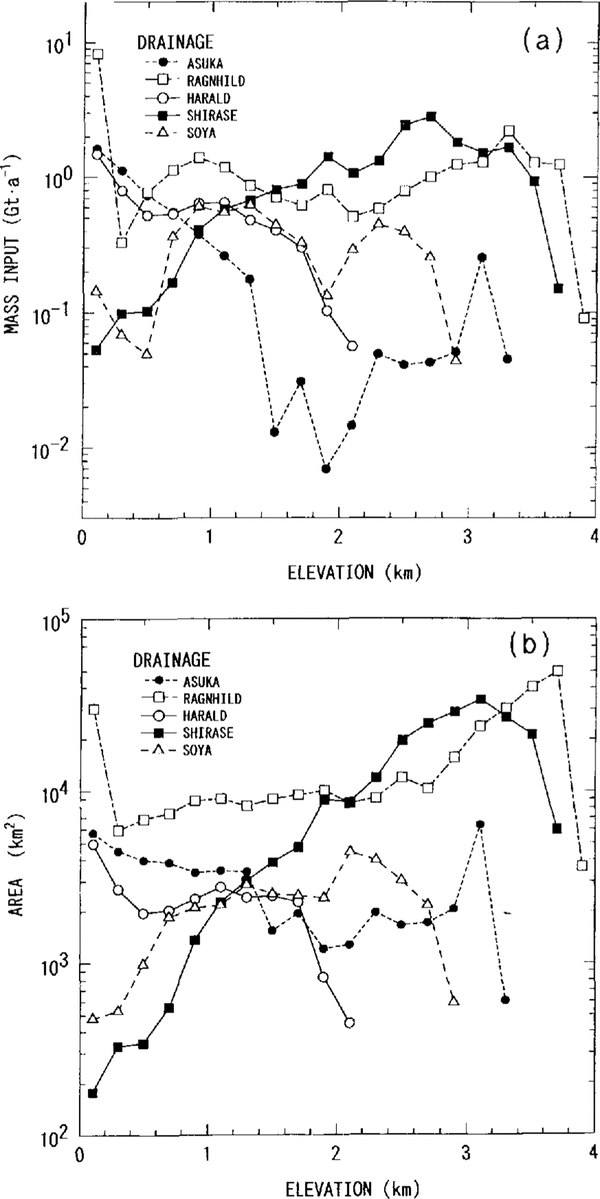
The observed area is divided into five drainage basins, Asuka, Ragnhild, Harald, Shirase and Soya drainage basins, based on the surface contours (Fig. 1). Mass input into these drainage basins was estimated from the results of rhe surface mass balance shown in Figure 7. In each drainage basin, area size and mass input were calculated for zones between every 200m contour line (Fig. 8) and integrated over the whole basin. The integrared results are listed in Table 3. For all the drainage basins, the mass input over an area of 620 × 103m−2 is 61.2Gton a−1 and the mean surface mass balance is 99 mm a−1. The variation of surface mass balance with elevation is shown in Figure 9.

Fig. 8. Mass input (a) and area (b) bounded every200 m contour line against elevation in the five drainage basins in east Dronning Maud Land.
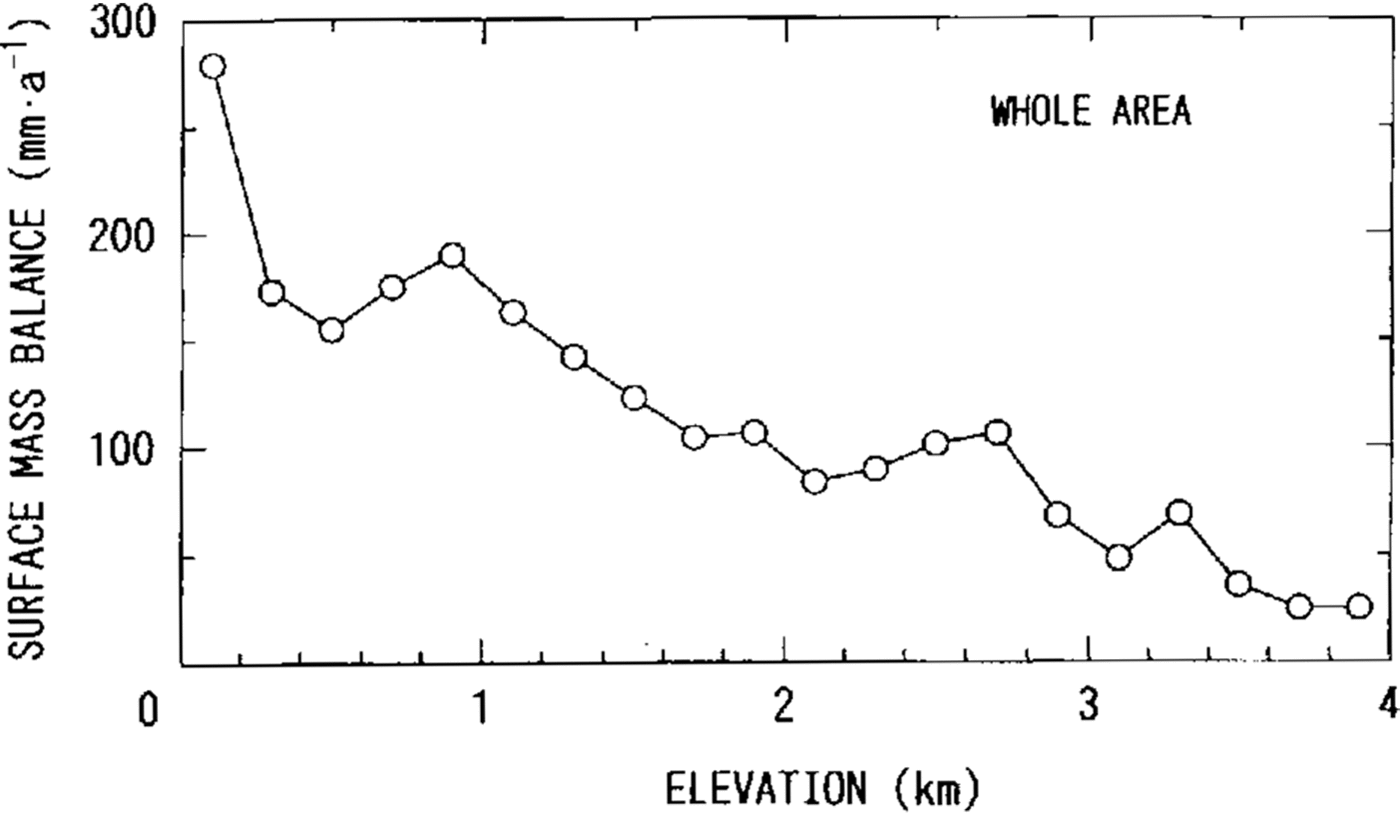
Fig. 9. Mean surface mass balance bounded by every 200 m contour line against elevation. The surface mass balance was calculated for the whole area of the five drainage basins.
Table 3. Area, mass input, surface mass balance in jive drainage basins in east Drorming Maud Land

In the Shirase drainage basin, the mass input is 18.9Gtona−1 over an area of 207 × l03km2. This input is larger than the icc-stream discharge from Shirase Glacier,12.0 13.2Gton a−1 (Reference Nakawo, Ageta and YoshimuraNakawo and others, 1978). These results conflict with the survey result that the ice sheet in this area is thinning at a rate of 70 cm a−1(Reference NaruseNaruse, 1979). The reasons for this difference are not clear.
Acknowledgements
The authors wish to express thanks to the members of the Japanese Antarctic Research Expeditions who have made much effort to measure the snow-accumulation data along various traverse routes for long time periods. They are indebted to Professor O. Orheim, of the NorskPolarinstitutt, Oslo, for his critical reading of themanuscript and to Dr K. Kamiyama of the National Institute of Polar Research, Tokyo, for providing the gross β radioactivity data. This study was carried out as part of the East Queen Maud Land Project.


