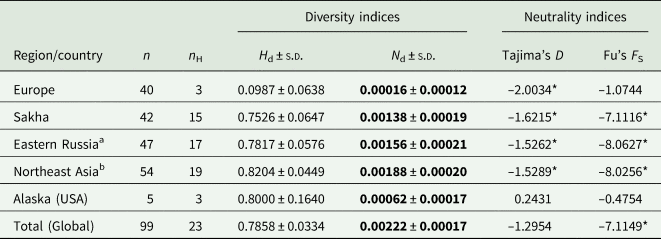
The authors apologise for errors that appeared in the published article. The values for nucleotide diversity given in Table 3 (page 7) were erroneously taken from the results of the software Arlequin v 3.5.2.2 and not from DnaSP 6.12 as stated. This resulted in incorrect information in the results section in Table 3, first section of the paragraph ‘Population diversity and neutrality indices’ (page 7), and in the last column of ‘Discussion’ (page 8). The corrected table and text can be found below. Corrections made are highlighted in bold.
Table 3. Diversity and neutrality indices of Echinococcus canadensis G10 based on complete cox1 gene (1608 bp)

n, number of isolates (sequences); n H, number of haplotypes; H d, haplotype diversity; N d, nucleotide diversity; s.d., standard deviation.
a including sequences from Sakha and additional from eastern Russia.
b including sequences from eastern Russia, Mongolia, and Tibet.
* Significant at p < 0.05.
Results
Population diversity and neutrality indices
Analyses of the haplotype (H d) and nucleotide diversity (N d) indices show low values in Europe, compared to the diversity found in Northeast Asia, which are 8.3 (H d) and 11.75 (N d) times higher, respectively (Table 3). The value of European diversity H d was 0.0987 and that of nucleotide diversity N d was 0.00016. The indices from Sakha determined in the present study are almost 1 order of magnitude higher compared to Europe (H d: 0.7526; N d: 0.00138) and increase further with the inclusion of the other sequences from eastern Russia, Mongolia and China (H d: 0.8204; N d: 0.00188). The Alaskan samples also show high haplotype diversity values (H d: 0.8000); the nucleotide diversity (N d: 0.00062) is lower than that in northeast Asia, but still higher compared to Europe.
Discussion
As for E. canadensis, the genetic haplotype diversity has only been investigated from the G6/7 genotypic cluster. Although some geographical structuring can be seen with the ‘G6’ variants originating mostly from camel-raising regions and G6/7 contains a large number of haplotypes, most of these cluster closely together suggesting close relationship and recent ancestry (Addy et al., 2017; Laurimäe et al., 2018b). In contrast, many haplotypes of G10 analyzed in this study are widely separated from each other as reflected by the far higher value of nucleotide diversity (N d = 0.00188) as compared to G6/7 (N d = <0.00173) (Addy et al., 2017).
The remarkably high genetic diversity of G10 in Northeast Asia, the occurrence of all E. canadensis genotypes in this region and the phylogenetically basal position of genotypes 8 and 10 may be circumstantial evidence that this parasite might have evolved in this region.


