INTRODUCTION
Management according to biological reference points is common practice for many fisheries worldwide (see for example Rice & Connolly Reference Rice and Connolly2007, and several papers in the Fisheries Management Strategies special issue of the ICES Journal of Marine Science, volume 64, part 4). The International Council for the Exploration of the Sea (ICES), giving advice for numerous fish stocks in the northeast Atlantic, applies a framework for fisheries advice involving harvest control rules based on various biomass reference points and fishing mortality reference points (ICES 2012a). The ICES approach to fisheries advice integrates a precautionary approach, maximum sustainable yield (MSY) and an ecosystem approach into one advisory framework. While the precautionary approach involves limit reference points for stock biomass and fishing mortality, the MSY approach involves target reference points for these parameters. Such reference point based management has been rare (but see Dorner et al. Reference Dorner, Peterman and Su2009) for freshwater recreational fish resources. However, due to increased focus on conservation and sustainable exploitation, management according to biological reference points is currently expanding. While there are lessons to be learnt from marine fisheries management, there are important differences in both the scientific and management challenges.
Atlantic salmon Salmo salar (hereafter salmon) is a highly valued anadromous fish species that has been exploited throughout its history of interaction with humans (Hindar et al. Reference Hindar, Hutchings, Diserud, Fiske, Aas, Einum, Klemetsen and Skurdal2011). Contemporary exploitation has been for both food and recreation, and the economic value of the fisheries has prompted high exploitation rates and over exploitation of many populations. Salmon has been actively managed for decades, however typically in the absence of quantitative information on harvestable surplus (Hindar et al. Reference Hindar, Hutchings, Diserud, Fiske, Aas, Einum, Klemetsen and Skurdal2011). Recently, the accumulated knowledge on the biology of this species (summarized in Verspoor et al. Reference Verspoor, Strandmeyer and Nielsen2007; Aas et al. Reference Aas, Einum, Klemetsen and Skurdal2011) has been used to develop reference points for fisheries management.
Salmon is a genetically structured species, with thousands (> 2000, exact numbers not known) of genetically distinct populations spawning in watercourses along the Atlantic coasts (Verspoor et al. Reference Verspoor, Strandmeyer and Nielsen2007). While there may be more than one population within some of the larger watercourses (Vähä et al. Reference Vähä, Erkinaro, Niemelä and Primmer2008) and some neighbouring populations may comprise a meta-population (Hindar et al. Reference Hindar, Tufto, Sættem and Balstad2004), salmon has for more than a century been managed on the river or watercourse level, assuming that each river holds a unique population.
Salmon has been in a long-term decline, both in terms of the number of populations and in terms of reduced productivity both in freshwater and the marine environment (Hindar et al. Reference Hindar, Hutchings, Diserud, Fiske, Aas, Einum, Klemetsen and Skurdal2011; Windsor et al. Reference Windsor, Hutchinson, Hansen and Reddin2012; ICES 2012b). A number of anthropogenic factors are responsible for the decline, such as loss of connectivity due to construction of dams, hydropower facilities, habitat alternations or destruction, pollution, overexploitation and the more recent effects of salmon farming (such as genetic introgression and increased parasite loads), introduced parasites and climate change. This general declining trend calls for management systems that ensure sustainable fisheries, and in 1998, the North Atlantic Salmon Conservation Organization (NASCO), established by an intergovernmental convention, agreed upon a precautionary approach to salmon fisheries management aimed at maintaining all populations above their conservation limit (NASCO 1998). Several countries have recently or are currently implementing such population specific conservation limits in their salmon fisheries management, and the conservation limit refers to the level of biomass of females below which recruitment starts to decline significantly (Crozier et al. Reference Crozier, Potter, Prévost and Schön2003; Ó Maoiléidigh et al. Reference Ó Maoiléidigh, McGinnity, Prévost, Potter, Gargan, Crozier, Mills and Roche2004; Chaput Reference Chaput2006; reviewed in Hindar et al. Reference Hindar, Hutchings, Diserud, Fiske, Aas, Einum, Klemetsen and Skurdal2011). From these limits management targets have been developed, which are the desired spawning stock level to obtain the management objectives. Such targets also incorporate natural variability and measurement errors (Hindar et al. Reference Hindar, Hutchings, Diserud, Fiske, Aas, Einum, Klemetsen and Skurdal2011).
The use of conservation limits as biological reference points for salmon populations is founded on the theoretical and empirical evidence for negative density dependent growth and survival of juveniles during the freshwater phase (Einum & Nislow Reference Einum, Nislow, Aas, Einum, Klemetsen and Skurdal2011; Hindar et al. Reference Hindar, Hutchings, Diserud, Fiske, Aas, Einum, Klemetsen and Skurdal2011), yielding dome-shaped or asymptotic stock recruitment relationships (Elson Reference Elson1957, Reference Elson1975; Jonsson et al. Reference Jonsson, Jonsson and Hansen1998). Such curves provide estimates or approximations to the population level carrying capacities and the conservation limit is the biomass of females or number of eggs necessary to attain the carrying capacity. During the marine phase, density independent factors appear to dominate without any population regulation (Jonsson et al. Reference Jonsson, Jonsson and Hansen1998).
Norway is a core country for salmon, with approximately 25% of the world's healthy populations (WWF [World Wildlife Fund] 2001; Hindar et al. Reference Hindar, Hutchings, Diserud, Fiske, Aas, Einum, Klemetsen and Skurdal2011). Under the assumption that each river system holds one population, there are 481 salmon populations, of which 54 populations are lost or in critical condition. There are regular fisheries in 240 river systems (mainly rod-fisheries), as well as marine fisheries using bag-nets and bend-nets along the coast and in the fjords. In 2011, a total of 696 metric tonnes of salmon was caught in Norway, 394 t in the river fisheries and 302 t in the marine fisheries. Management according to conservation limits and management targets was implemented in Norway during 2008, and is currently the basis for salmon fisheries management in populations representing >98% of the total catch. According to Norwegian legislation, the goal of the management is primarily to conserve the populations, with maximizing fisheries yield as the secondary goal.
The salmon fisheries are opened after directives from the Directorate for Nature Management (under the Ministry of the Environment) in cooperation with freshwater fish managers at each of 16 County Governor offices. Until recently, fisheries regulation was primarily based on assessment of population status by the management bodies. In 2009, the Directorate for Nature Management appointed 12 scientists as members of the Norwegian Scientific Advisory Committee for Atlantic Salmon Management (hereafter termed the Salmon Committee). One of the obligations of this independent committee is to provide scientific advice to management on fisheries regulation, based on assessment of attainment of conservation limits and management targets. There are no managers in the committee and only biological factors are considered. The exploitation advice from the committee is the primary biological foundation for the fisheries directives (in each of the river systems, as well as the marine fisheries). In the current management scheme there is thus a clear separation between management and science. The main regulatory mechanism is duration of the fishing season, but in the rivers alternative regulation based on quotas, gear types or protected zones may be used.
Here we briefly describe how the conservation limits were established, but focus on the methods used to estimate attainment of the limits and management targets, the process of providing scientific advice to management, and the consequences for attainment of targets and exploitation. Finally, we discuss how effective management according to such targets is at attaining the main goals of the management, namely conservation and sustainable exploitation.
METHODS
Conservation limits
Conservation limits were established during 2007–2009 for 439 Norwegian populations (all of the known self-reproducing populations). The limits were set by a group of scientists from research institutions in Norway, coordinated by the Norwegian Institute of Nature Research. Local county governor fisheries managers reviewed the suggested limits before final approval by the Directorate for Nature Management. Except for the county governor managers, there was no local involvement in the process.
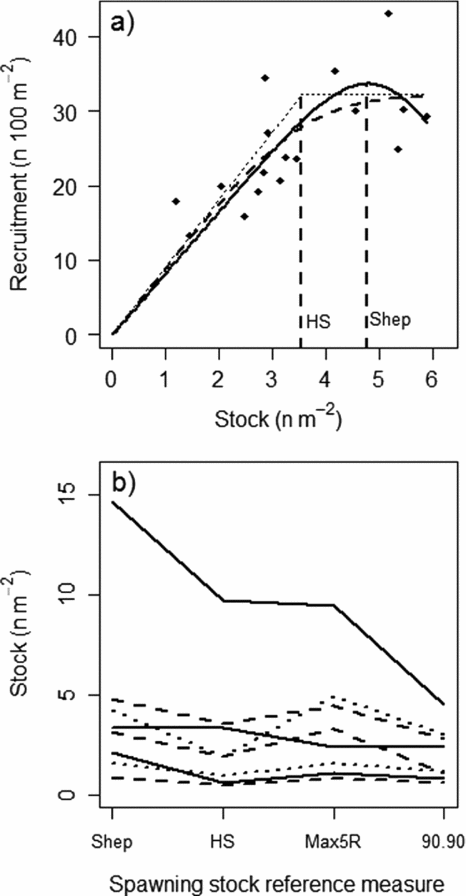
The conservation limits were based on stock-recruitment relationships from nine Norwegian rivers. Both Shepherd (Reference Shepherd1982) and Hockey-Stick (Barrowman & Myers Reference Barrowman and Myers2000) models were used (Fig. 1), and several parametric and non-parametric spawning stock reference levels were tested (see review in Potter Reference Potter, Prévost and Chaput2001, and box 12.2 in Hindar et al. Reference Hindar, Hutchings, Diserud, Fiske, Aas, Einum, Klemetsen and Skurdal2011). The estimated optimal egg densities (eggs m−2 wetted area) with respect to recruitment (the average maximum number of recruits at the peak or derived from the asymptote of the relationships) ranged (excluding outliers) from approximately 1 egg m−2 to more than 6 eggs m−2 (Fig. 1; Hindar et al. Reference Hindar, Diserud, Fiske, Forseth, Jensen, Ugedal, Jonsson, Sloreid, Saltveit, Sægrov and Sættem2007, Reference Hindar, Hutchings, Diserud, Fiske, Aas, Einum, Klemetsen and Skurdal2011). To transfer conservation limits from these nine data-rich rivers to the remaining 430 populations, the populations were placed according to their productivity in one of the following categories of conservation limits: 0.5–1.5, 1.5–3, 3–5 and 5–7 eggs m−2, with respective modal values at 1, 2, 4 and 6 eggs m−2. Assessment of productivity was based on catch per wetted area, smolt (the life stage at which the juveniles migrate to sea, typically 2–4 years after hatching) age distribution, sea-age distribution and other information about each population and watercourse (Hindar et al. Reference Hindar, Hutchings, Diserud, Fiske, Aas, Einum, Klemetsen and Skurdal2011). Once the egg density category was determined (eggs m−2), total necessary egg deposition was estimated from the wetted area (using standardized geographic information system [GIS] methods; Erikstad et al. Reference Erikstad, Sloreid and Hansen1999) and the conservation limits expressed as biomass of females were calculated assuming female fecundity of 1450 eggs kg−1, representative for many of the Norwegian populations (Hindar et al. Reference Hindar, Hutchings, Diserud, Fiske, Aas, Einum, Klemetsen and Skurdal2011). Mass specific fecundity shows relative low inter- and intra-population variation (Klemetsen et al. Reference Klemetsen, Amundsen, Dempson, Jonsson, Jonsson, O'Connell and Mortensen2003).

Figure 1 (a) An example of stock-recruitment relationships based on the Shepherd (Reference Shepherd1982) (solid line), the original hockey-stick (dotted line) and logistic hockey-stick (Barrowman & Myers Reference Barrowman and Myers2000) (dashed line) models fitted to stock (S, egg deposition, n eggs m−2) and recruitment (R, n 1+ juveniles 100 m−2) data from the River Alta, northern Norway, and (b) different parametric and non-parametric spawning stock reference measures (see Potter Reference Potter, Prévost and Chaput2001 for an overview) that could be derived from the stock-recruitment relationships for the River Alta and similar relationships from seven other Norwegian Rivers. Shep = the stock value at the peak of the Shepherd curve, or the maximum observed stock in cases when no peak were observed, HS = the break point of the hockey-stick model, Max5R = average stock for the five highest recruitments observed, and 90.90 = the intersection of the 90th percentile of the survival rate (R/S) and the 90th percentile of the recruitment. Data for the river Imsa (one of the nine rivers with stock-recruitment relationships in Norway) were obtained from Jonsson et al. (Reference Jonsson, Jonsson and Hansen1998) and are not shown because of the very high values for some of the stock reference measures (for example Shep = 66 eggs m−2). Note that the rankings among rivers were generally similar across the different spawning stock reference measures and that most fell within the 0–5 eggs m−2 range. Figure courtesy of Hindar et al. (Reference Hindar, Diserud, Fiske, Forseth, Jensen, Ugedal, Jonsson, Sloreid, Saltveit, Sægrov and Sættem2007).
Assessment of attainment of conservation limits
The procedures described below were developed by the Salmon Committee, of which the main authors are also members.
The only information available from all river systems were the catch statistics, which thus was the foundation for the assessment. Catch statistics are collected annually both from the marine fisheries and from each of the rivers. The catch is reported in three weight groups (<3 kg, 3–7 kg and >7 kg) that roughly represent three sea-age-classes at maturity (one-sea-winter 1SW, two-sea-winter 2SW and three-sea-winter 3SW; Otero et al. Reference Otero, Jensen, L'Abe´e-Lund, Stenseth, Storvik and Vøllestad2012). By combining the reported catch with estimates of exploitation rates the spawning population can be estimated. Nominal catches were used, whereas the relative small but growing practice of catch and release fishing in the rivers was accounted for by reducing the exploitation rates according to the reported level of catch and release in each river.
The proportion of females in each of the three size groups in the statistics and their average weights were used to estimate female spawning biomass. To account for uncertainties in the estimates of female spawning biomass, Monte Carlo simulations based on triangular distributions of all the involved parameters were used (see below). Because the conservation limits (biomass females) were also given as ranges (minimum, modal and maximum), reflecting the uncertainty of the limits, the simulations were run using triangular distributed conservation limits. Triangular distributions are commonly used in risk assessments (Williams Reference Williams1992, Johnson Reference Johnson1997), and are useful when a modal (most likely value) has been determined and the two extreme percentiles (typically 5 and 95%) can be set by expert judgements.
Estimates of spawning female biomass
The biomass of spawning females in each river system was estimated as: [(total weight nominal catch in river) ÷ (exploitation rate) – (total weight nominal catch in river)] × (proportion females). Since both the proportion of females and the exploitation rate varies among weight groups, this was done separately for each of three weight groups and the biomasses were then summed.
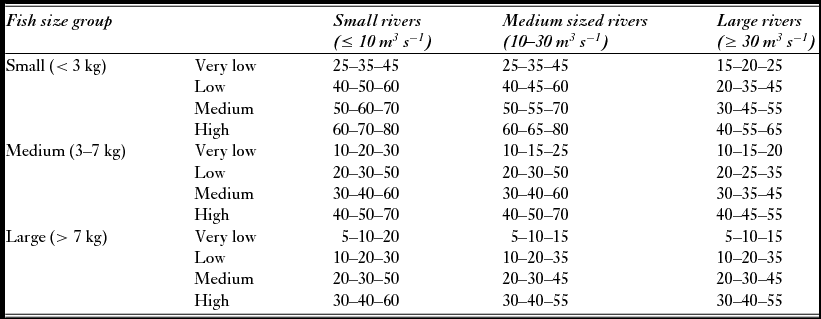
In 2011, 58 of the 135 exploitation rates used for simulations in the subsample analysed here were based on one of the following methods: (1) counts of upward migrating adult salmon in fish ladders or other counting facilities, (2) counts of the spawning population in the autumn after termination of the fishing season by drift snorkelling or observations from the shore, and (3) capture-mark-recapture studies. In most cases, exploitation was estimated for each of the size groups. To account for uncertainty in the estimated exploitation rates (Hansen Reference Hansen1990; Orell et al. Reference Orell, Erkinaro and Karppinen2011), they were given as a range (minimum, modal and maximum) with triangular distributions. For the remaining populations no local estimates of exploitation rates were available and exploitation was assigned to one of 12 categories of exploitation for each size group (Table 1), using general and seasonal local information on fishing pressure (such as number of anglers, organization of the fishery, quotas, length of the season, allowed gear, protected zones or catch and release) and fishing conditions (favourable/unfavourable discharge or temperature conditions). The categories were developed from analyses of 214 historical estimates of exploitation rates from 40 river systems that revealed a pattern of different exploitation rates among the three sea-age classes (Anon. 2009), and among rivers of different size (average annual discharge; grouped into small, medium and large). Within each of the resulting nine groups (three size classes × three river sizes), exploitation rates were categorized into four groups from very low to high, yielding a system with a total of 36 categories. To account for the uncertainty, the exploitation rates were given as relatively large ranges due to the uncertainty of the procedure. Local information for categorization of exploitation level (from very low to high) was obtained from a standardized questionnaire submitted annually to the county governor fisheries managers.
Table 1 Lower, modal and upper exploitation rates (%) for small, medium and large salmon in small, medium and large rivers used in the simulation of attainment of conservation limits when local estimates of exploitation were not available. Exploitation is categorized and ranked as very low to high.

The next component in the estimate of spawning biomass is the proportion of females in the different size/sea-age classes. 1SW salmon are typically dominated by males, whereas 2SW salmon are female dominated and 3SW salmon often have a 1:1 sex ratio. This general pattern, however, is not consistent among populations (see for example Fleming Reference Fleming1996; Niemelä et al. Reference Niemelä, Mäkinen, Moen, Hassinen, Erkinaro, Lansman and Julkunen2000), and rivers where most of the salmon return as 1SW fish often have a slight numerical dominance of females (Fleming Reference Fleming1996). For many rivers, anglers provide information about the gender of the fish as part of a scale-sampling programme. This information was combined with general knowledge about the sex distribution in the different size groups to provide estimates for each population. To account for uncertainty, the proportion of females was given as triangular distributions.
Finally, to ensure that the estimates of spawning biomass were based on wild salmon, escaped farmed salmon were removed from the reported catch. Spawning of farmed salmon in the wild is considered a major threat to the genetic integrity and productivity of the wild populations (Fleming et al. Reference Fleming, Hindar, Mjølnerød, Jonsson, Balstad and Lamberg2000; McGinnity et al. Reference McGinnity, Prodöhl, Ferguson, Hynes, Maoiléidigh, Baker, Cotter, O'Hea, Cooke, Rogan, Taggart and Cross2003; Glover et al. Reference Glover, Quintela, Wennevik, Besnier, Sørvik and Skaala2012), and Norwegian management aims at minimizing interbreeding of wild and farmed salmon. During recent years, farmed salmon has constituted, on average, 4–9% of the river catch (in terms of number of fish). For many rivers, there are annual estimates of the proportion of farmed salmon based on analyses of scale samples (Lund et al. Reference Lund, Økland and Hansen1991; Fiske et al. Reference Fiske, Lund and Hansen2006), whereas for other rivers, estimates are scarce or lacking. In the latter cases, proportion of farmed salmon from neighbouring rivers was used as a proxy. Proportion of farmed salmon within each weight group was drawn from triangular distributions.
Simulation procedure
One thousand simulations were conducted for each population and year, according to the following procedure:
For each of three weight groups (i):
 \begin{equation*}
\begin{array}{l}
Nw_i \,\, = N_i \times (1 - pf_i ) \\
Ww_i \, = Nw_i \times (W_i /N_i ) \\
WSf_i = [(Ww_i /e_i ) - Ww_i ] \times p_i , \\
\end{array}
\end{equation*}
\begin{equation*}
\begin{array}{l}
Nw_i \,\, = N_i \times (1 - pf_i ) \\
Ww_i \, = Nw_i \times (W_i /N_i ) \\
WSf_i = [(Ww_i /e_i ) - Ww_i ] \times p_i , \\
\end{array}
\end{equation*}and then:
where pfi = proportion of farmed salmon in weight group i, Ni = nominal catch (numbers) in weight group i, Nwi = nominal catch (numbers) of wild salmon in weight group i, Wi = nominal catch (weight) in weight group i, Wwi = nominal catch (weight) of wild salmon in weight group i, WSfi = weight of spawning females in weight group i, ei = exploitation rate in weight group i, pi = proportion females in weight group i, and WSftot = total weight of spawning females summed over all three weight groups.
Next, the conservation limits (CL) for the simulations were drawn from triangular distributions and compared to WSftot. If WSftot > CL, the conservation limit was considered as reached and attainment = 1. If WSftot < CL, the conservation limit was not reached, and attainment = 0.
Finally, the percentage attainment was computed as WSftot × 100/CL and if per cent attainment was > 100 then truncated per cent attainment was set as 100; otherwise truncated per cent attainment = per cent attainment.
After 1000 simulations, the following three estimates were computed: (1) average probability of attaining the conservation limit, (2) average truncated percentage attainment of the conservation limit and (3) average percentage attainment of the conservation limit (non-truncated). The average of these estimates over the last four years were then used to evaluate attainment of the management targets and as the foundation for management advice following pre-decided procedures (as described later).
In 22 small rivers, where the catches were highly variable and strongly influenced by discharge conditions, it was very difficult to assign reasonable estimates of exploitation rates and an alternative simulation approach was used. We will not describe this approach in detail here, but it was based on estimating adults return at maximum smolt production and regional estimates of sea survival. Adult returns minus the catch provided an estimate of the spawning population.
The management targets and advice
Based on the assessment procedures described above, standardized advice has been provided annually since 2009. In 2008, the Directorate for Nature Management defined the management targets for each population as attainment of the conservation limit in three out of four years. The Salmon Committee operationalized this target by defining a threshold at 75% average probability of attaining the conservation limit over four years. Deviation from the conservation limit may however be small or large, and per cent attainment was also used as criterion for the advice. Each population was given one of five standardized recommendations for exploitation, ranging from increased exploitation to substantially reduced exploitation. The thresholds were set by expert opinion from the committee and under the precautionary approach adopted for salmon management by Norwegian authorities, assuming that small deviations from the conservation limits have small effects on recruitment, but effects may escalate at larger deviations. The five recommendations and their criteria were:
(1) This population can probably be more heavily exploited given that marine survival remains at current levels. Average probability for attainment of conservation limits during the last four years >75%, and average attainment (non-truncated) during the same period >140%.
(2) The management target is attained for this population and no additional restrictions on exploitation are necessary. Average probability for attainment of conservation limits during the last four years ≥75%.
(3) The management target may not have been attained for this population and exploitation should be reduced moderately to ensure attainment of the conservation limit. Average probability for attainment of conservation limits during the last four years is between 40 and 74%, and average attainment during the same period >75%.
(4) The management target is likely not attained for this population and exploitation should be significantly reduced to ensure attainment of the conservation limit. Average probability for attainment of conservation limits during the last four years is between 20 and 39%, and average attainment during the same period >60%.
(5) The management target is not attained for this population and exploitation should be reduced substantially to ensure attainment of the conservation limit. Average probability for attainment of conservation limits during the last four years <20%.
The recommendations are hierarchically structured so that if one of the two criteria (where there are two criteria) was not met, a more restrictive recommendation was applied. While the catch advice was given on a river basis, the catch recommendations address all fishing on the population, in the river, the fjord or along the coast. A separate system, not described here, has been developed for aggregated advice for the mixed population fishery in the fjords and along the coast.
The recommendations were based on historical evaluation of attainment of conservation limits (over the last four years) and were thus given under the assumption that survival conditions at sea remain the same. This is not likely to be true, as survival at sea varies substantially among years (Friedland et al. Reference Friedland, Hansen, Dunkley and MacLean2000). Current forecast models only provide large scale predictions for salmon abundance in the North Atlantic (see ICES 2012b), and the ability of the models to predict shifts in survival conditions (for example from low to high) is likely limited. However, because survival conditions have been generally poor during recent years (Windsor et al. Reference Windsor, Hutchinson, Hansen and Reddin2012; ICES 2012b), assuming that conditions will not change is probably a conservative approach.
Assessment of effects
For the assessment of effects of the new management scheme, only populations where attainment of the limits were evaluated with the method described above throughout the period (2005–2011) were included (for a variety of reasons, some were excluded and others added during the period). The largest salmon river system in Norway, the River Tana (18% of the total conservation limit in Norway), was also excluded from the analyses because the fisheries management is regulated through a long-term agreement with Finland, and no major new restrictions have been implemented during recent years. All analyses were thus based on results from 135 rivers, representing 61% of the total conservation limits. However, we also present the recommendations provided for all assessed populations (154–176 populations).
The effect of management according to conservation limits and management targets was primarily assessed by comparing the estimated attainment of the limits before (2005–2008) and after (2009–2011) the new scheme was implemented. However, changes may be due to changes in the abundance of fish or changes in exploitation rates. We thus also compare estimates of exploitation rates both in marine and river fisheries in the two periods. The abundance of salmon each year was estimated from a revised ‘run-reconstruction’ pre-fishery abundance (PFA) model (Potter et al. Reference Potter, Crozier, Schon, Nicholson, Maxwell, Prevost, Erkinaro, Gudbergsson, Karlsson, Hansen, MacLean, Maoileidigh and Prusov2004). In contrast to the original model, where total catch was the starting point (Potter et al. Reference Potter, Crozier, Schon, Nicholson, Maxwell, Prevost, Erkinaro, Gudbergsson, Karlsson, Hansen, MacLean, Maoileidigh and Prusov2004), the Norwegian model uses the river catch statistics as the starting point. The number of salmon that ascend all rivers was estimated from the reported river fisheries catch and estimates of exploitation rates. Next, the reported catch in the marine fishery was added, and after removing farmed escapees (based on monitoring programmes) and adjustment for unreported catch (as proportion of the reported), the total PFA for Norway was estimated. The estimates were based on Monte Carlo simulations using uniform distributions reflecting uncertainty in model parameters (unreported catch, proportion farmed salmon). PFA in number of fish was transformed to total biomass and biomass of females, by using average size and proportion females in each of the three size groups. Because no independent estimates of exploitation rates in the marine fisheries for the relevant period were available in the literature, changes in marine exploitation after implementation of the new management scheme were assessed using estimates from the PFA-model. In addition, estimates of fishing effort (bag-net and bend-nets days) was used as index of marine exploitation.
Some more indirect effects were also described. Changes in the quality of the catch statistics were assessed based on categorization in the questionnaire to the county governor fisheries managers. Changes in the number of the rivers with local estimates of exploitation rates were also assessed.
RESULTS
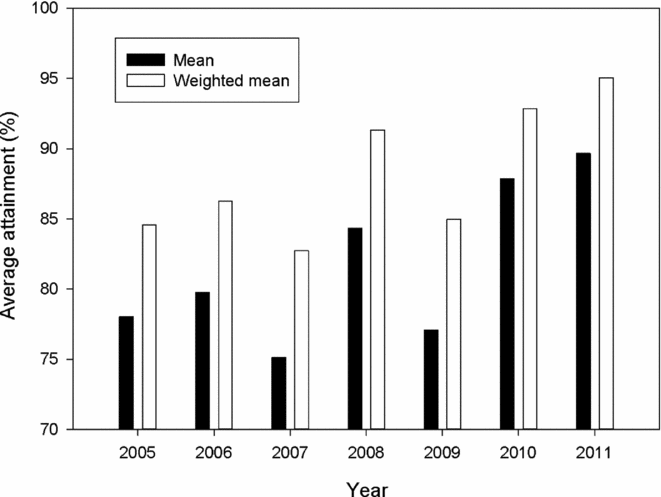
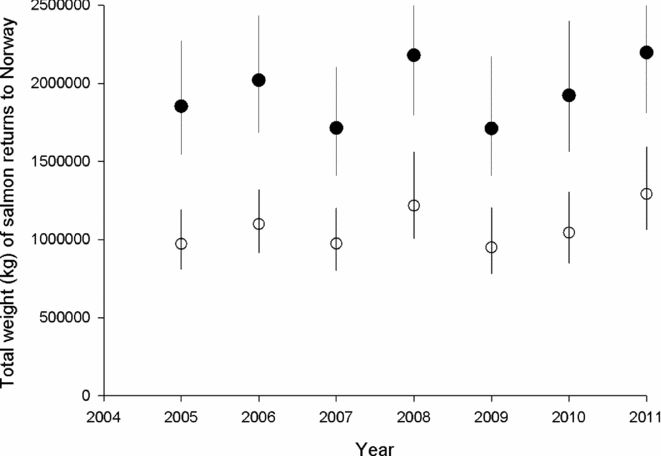
Attainment of conservation limits and thus management targets improved substantially from the first assessment in 2009 (based on the period 2005–2008) to the last assessment made in 2012 (based on the period 2009–2011) (Fig. 2). Average attainment in the period 2009–2011 was 84.9%, which was significantly higher (pairwise t-test, t = –4.2, n = 135, p < 0.001) than in the period 2005–2008 (79.3%). The percentage of populations that attained their management target increased from 36% for the period 2005–2008, to 42% for the period 2009–2011, and in 2011, the conservation limits were attained in 64% of the populations. There was a significant change in the distribution of advice (Χ2 = 60.0, df = 9, p < 0.001 for 114 populations assessed both periods), with a decrease in the percentage of populations given the more restrictive recommendations (4–5) and a corresponding increase in recommendations (1–3) for moderate reductions, no change or possibilities of increased exploitation (Table 2). These changes were not primarily due to increased salmon abundance (biomass PFA), which showed no distinct trend and similar averages for the periods (1942 t in the first period and 1944 t in the second; Fig. 3). The average estimated female biomass PFA was also similar for the two periods (1066 t versus 1095 t).
Table 2 Numerical distribution of management recommendations for the period 2005–2008 and 2009–2011 for 114 Norwegian salmon populations where recommendations were given for both periods and based on the standard assessment procedures (selected rivers) and percentage distribution for all assessed rivers (all rivers). Note that for all assessed rivers, the number of assessed populations is higher in the second (n = 176) than in the first period (n = 154). Recommendations 1 and 2 are pooled and open for increased exploitation or no change (management target attained), 3 recommends moderate reductions, 4 significant reductions and 5 recommends substantial reductions in exploitation.


Figure 2 Average estimated percentage attainment (ordinary average or weighted with the size of the conservation limit of each population) of the conservation limits over the period 2005 to 2011 in 135 Norwegian salmon populations.

Figure 3 Estimated (from the PFA-model) average (and range) total weight of salmon (filled symbols) and weight of females (open symbols) returning to Norway in the period 2005–2011.
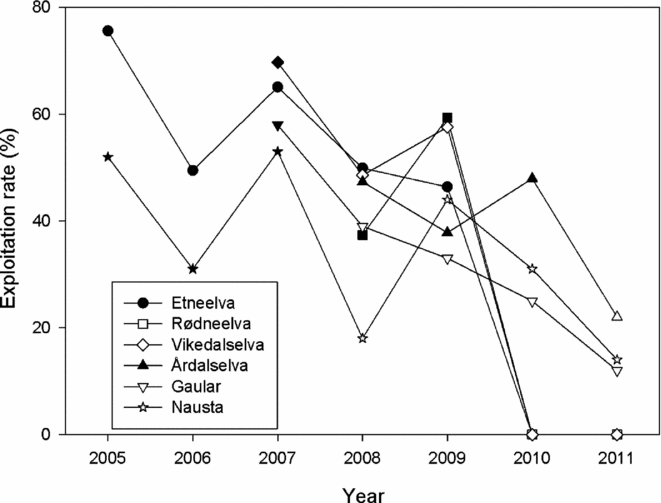
Major restrictions on the salmon fishery were implemented in 2008, before management according to conservation limits was established. More restrictions were implemented in 2010 based on the recommendations given, and some smaller adjustments were made for the 2011 season. Restrictions involved closing the coastal fisheries in large parts of Norway, reductions in the fishing season in the fjord fisheries and in quite a few rivers, as well as quotas and new protected zones in the river fisheries and closing of some river fisheries. Average exploitation rates in the river fisheries, as estimated or categorized based on the questionnaire (Table 3), declined significantly (pairwise t-tests, all t > 7.47, n = 135, all p < 0.001) for all size classes (Appendix l, Fig. S1, see supplementary material at Journals.cambridge.org/ENC). Overall (by assuming a fixed composition of 50% small, 30% medium and 20% large salmon in the populations), exploitation in the river fishery decreased from 40% for the period 2005–2008 to 34% in 2009–2011. This overall pattern of declining exploitation rates could also be found in independent time series of estimates of exploitation in six rivers (Fig. 4). Overall, there was a significant declining trend (regression on normalized exploitation rates for all rivers and years: R2 = 0.46, p < 0.001, n = 36; and after omission of years with zero exploitation due to closing of the fishery: R2 = 0.26, p < 0.01, n = 30).
Table 3 Mean of the modal exploitation rates (standard error, SE in brackets) for three size groups of Atlantic salmon from 135 rivers in the two periods (before and after management according to conservation limits). Differences between the periods were tested for by pairwise t-tests.


Figure 4 Exploitation rates (%) estimated for salmon for six Norwegian rivers. Filled symbols indicate that fishing regulations were not changed, whereas open symbols indicated that new restrictions were implemented. Estimates were based on counting of the spawning population by snorkelling or by counts in fish ladders (on the rivers Gaular and Nausta). For the rivers Etneelva, Rødneelva and Vikedalselva, the river fisheries were closed in 2010 and 2011.
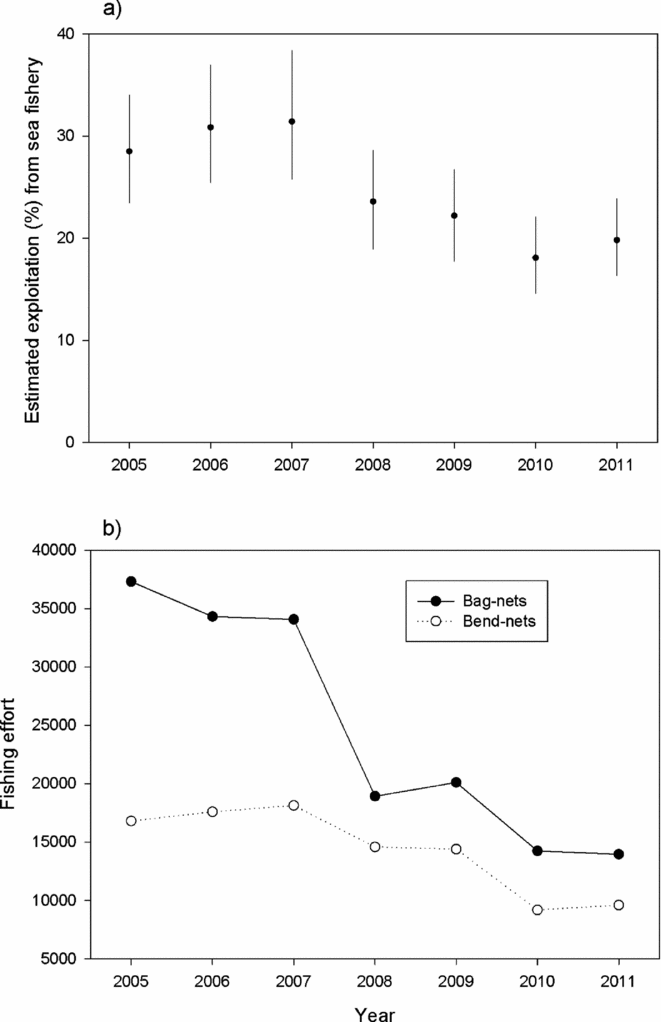
In the first period, on average 29% of the returning salmon to Norway (PFA) was estimated to have been caught in the sea fishery, whereas this figure was 20% for the second period (Fig. 5). The average total number of fishing days in the bag-net fishery (total number of net-days reported to Statistics Norway by the fishers) declined from 31 154 in the first period to 16 103 in the second, and corresponding numbers for the bend-net fishery were 16 777 and 11 059 (Fig. 5).

Figure 5 Temporal changes in the exploitation of salmon in the marine fishery illustrated by (a) the estimated percentage (average and range) of the number of returning salmon to Norwegian coast caught in the sea fisheries in Norway in the period 2005–2011 based on the PFA-model simulations of number of returns to the Norwegian coast, and (b) the fishing effort (number of gear days reported to Statistics Norway) in the marine fishery (bag-nets and bend-nets).
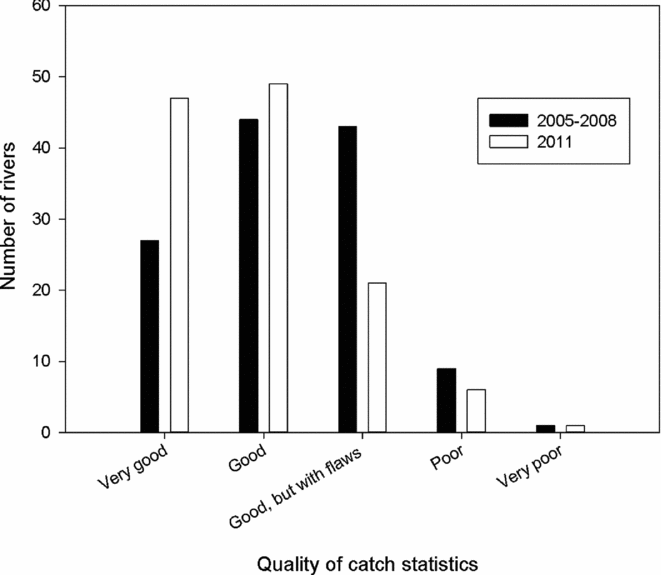
Another major change during the period was that the number of rivers without local estimates of exploitation rates declined from 118 rivers in 2005 to 77 rivers in 2011 (Table 4). The assessment of the catch report as categorized by the county governor fisheries managers in the questionnaire indicated the quality of the statistics improved (Fig. 6). The distribution of categories for the 2011 assessment was significantly different (X2 = 44.1, df = 16, p < 0.001) from the first assessment made for the period 2005–2008, mainly due to reduced number of rivers where the statistics were categorized as ‘good, but with some flaws’, and an increase in reports described as very good.
Table 4 The number of the 135 analysed salmon populations that had no local estimates of exploitation, estimates that could be used directly in the simulations and where local estimates of exploitation was used to set exploitation levels (system given in Table 1) during the period 2005–2011.
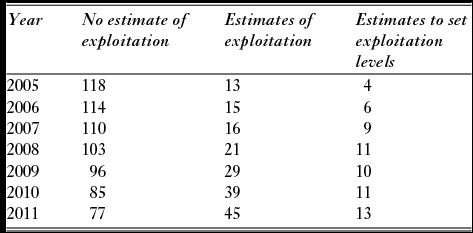

Figure 6 Frequency of categories of assessed quality of the Norwegian salmon catch statistics (based on questionnaires sent to the county governor fisheries managers) in 124 rivers with information available both for the period 2005–2008 and for 2011.
DISCUSSION
The success of conservation limits for management of salmon should be evaluated against the main goals of management. Two Acts, the Salmon and Inland Fisheries Act (1993, revised in 2009) that refers to the Nature Diversity Act (2009), form the basis for salmon management in Norway (see URL www.lovdata.no). They outline two goals; (1) to protect the diversity of the populations and their natural habitat through conservation and sustainable use, and (2) within this framework to develop the populations for increased yield to the benefit of stakeholders, leisure fishers and society.
The main reason for implementing management according to conservation limits was to ensure average maximum recruitment in all Norwegian salmon populations. Although large restrictions on the salmon fishery were introduced shortly before management measures imposed by the implementation of conservation limits, the effects of the new regime have been significant. The number of populations that attained their conservation limits increased substantially and, overall, the populations evaluated in 2011 were at 95% of their conservation limits, compared to 91% in 2008 and 85% in 2005. The effects of the regulations were probably underestimated, because our selection was biased towards large populations and excluded populations where the fishery was closed.
This improvement occurred in spite of poor survival at sea and thus the total number of returning adults to Norway remaining at historically low levels, and changes could mainly be attributed to reduced exploitation rates. Reductions in exploitation rates were detected both in the models and in independent time series of estimates of exploitation in river fisheries. In the marine fishery, both estimates from the PFA-model and the reduction in the number of fishing-days provide supporting evidence that a large reduction occurred.
According to theory and empirical evidence (see Jonsson et al. Reference Jonsson, Jonsson and Hansen1998; Einum & Nislow Reference Einum, Nislow, Aas, Einum, Klemetsen and Skurdal2011; Hindar et al. Reference Hindar, Hutchings, Diserud, Fiske, Aas, Einum, Klemetsen and Skurdal2011) improvements in attainment of conservation limits will increase the total number of salmon smolts that migrate to sea from Norwegian rivers. As there appears to be no density dependent regulation at sea (Jonsson et al. Reference Jonsson, Jonsson and Hansen1998) such an increase will in turn cause an increase in the number of returning adults, all else being equal. However, since survival at sea varies substantially, yielding five- to six-fold variations in sea survival (Jonsson et al. Reference Jonsson, Jonsson and Hansen1998; Friedland et al. Reference Friedland, Hansen, Dunkley and MacLean2000), and the expected increase in smolt numbers is probably less than double, increasing numbers of returning adults may be difficult to detect in short-term catch statistics. There is also a lag between increased spawning and increased smolt numbers because the juveniles typically stay in the river for two to five years before migrating out to sea. However, since the management options in the marine system are often few or absent (Windsor et al. Reference Windsor, Hutchinson, Hansen and Reddin2012), ensuring maximum smolt production through fisheries regulation is important.
In the long run, keeping all salmon populations at their maximum reproductive capacity is expected to increase the number of returning adults. More important, because many Norwegian salmon populations are small, with effective populations size (Ne) close to or even below the 50–500 guidelines for long-term viability and conservation of genetic variation (Franklin Reference Franklin, Soulé and Wilcox1980; Frankel & Soulé Reference Frankel and Soulé1981), retaining all salmon populations at their maximum reproductive capacity is important for conservation of populations. In a recent summary on genetics, conservation and management of Atlantic salmon (Verspoor et al. Reference Verspoor, Strandmeyer and Nielsen2007) one of the important recommendations for management was to ‘Maintain salmon populations at their largest possible size in order to retain genetic variation and adaptive potential, especially in the case of small populations inhabiting extreme, marginal habitats’ (García de Leániz et al. Reference Garcia de Leaniz, Fleming, Einum, Verspoor, Consuegra, Jordan, Aubin-Horth, Lajus, Villanueva, Ferguson, Youngson, Quinn, Verspoor, Strandmeyer and Nielsen2007). In addition, there are indications (Glover et al. Reference Glover, Quintela, Wennevik, Besnier, Sørvik and Skaala2012) that large spawning populations may protect the wild populations from genetic introgression and ecological effects of escaped farmed salmon (Fleming et al. Reference Fleming, Hindar, Mjølnerød, Jonsson, Balstad and Lamberg2000; McGinnity et al. Reference McGinnity, Prodöhl, Ferguson, Hynes, Maoiléidigh, Baker, Cotter, O'Hea, Cooke, Rogan, Taggart and Cross2003; Glover et al. Reference Glover, Quintela, Wennevik, Besnier, Sørvik and Skaala2012).
Because management according to conservation limits has caused several new restrictions for the fisheries, it may be regarded as a failure in attaining the secondary target of salmon management to increase fisheries yield. Indeed, the total catch of salmon was reduced from 848 t during 2005–2008 to 644 t for the period 2009–2011, largely due to the effects of the restrictions on the fishery. However, this adjustment in harvest rates to match declining salmon returns is expected to provide higher yield if, or when survival conditions at sea improve, thus increasing the long-term sustainable yield. As judged from historical estimates of pre-fishery abundance and exploitation rates, it is likely that many populations have been overexploited and remained well below their maximum reproductive potential during decades of the 19th century. The problem of overexploitation appears to move towards a solution in the current management scheme.
Management according to conservation limits also had other positive effects. First it has boosted stakeholder involvement in the form of local data acquisition, as local or regional managers in an increasing number of rivers have funded and implemented local estimates of spawning population size and/or exploitation rates. Second, the quality of the river fisheries statistics has improved. In the current procedures for providing advice, underreporting of catch inevitably causes more restrictive recommendations that, in turn, may induce further restrictions or even the closure of the fishery. Obviously, improvements in the catch statistics are vital for knowledge-based management.
CONCLUSIONS
We conclude that implementation of management according to conservation limits and management targets has proved a success in meeting the main management goal of protecting the Norwegian salmon populations, by ensuring that an increasing number of the populations are at their maximum reproductive capacity. This conclusion is true only if the conservation limits are sufficiently high, which remains to be tested. However, as the total spawning biomass in Norwegian salmon populations have increased despite adult returns remaining at low levels, the populations have likely profited. In terms of increasing fisheries yield for the benefit of stakeholders, leisure fishers and society, positive effects of the new management scheme are expected, but remain to be shown.
Are there any downsides to management driven by conservation limits? While not explored in the present study, we have observed that the new management scheme has fuelled public debate between marine and river fisheries interests. Inevitably, reductions in the marine fishery increase the number of salmon entering the rivers, both in populations that were far from their conservation limits (and the reason for implemented restrictions on the marine fishery) and those that were already at or close to their limits. Some rivers fisheries have thus benefited from the restrictions and have reported high catches, despite strict regulations. Continued low adult returns due to poor survival conditions at sea may escalate this debate, whereas improved recruitment combined with better conditions may in the longer run reduce conflicts.
Reference point based management of salmon exemplifies management within the intersection of fisheries management and conservation biology, borrowing principles from both sides. The reference point based management of international marine fisheries has been adapted and implemented for salmon, albeit only partly (for high sea fisheries; ICES 2012b), through international bodies such as ICES and its framework for fisheries advice (ICES 2012a). Separation between scientific advice and active management has also been established. However, current exploitation of salmon occurs primarily in national waters, the economic value is far less than for many marine fisheries and stakeholders are to a lesser degree professionals. Moreover, the species is strongly structured into a high number of populations, many of them small, and principles from conservation biology (such as minimum viable population size and protection of genetic variability and adaptive potential) are important for management (Verspoor et al. Reference Verspoor, Strandmeyer and Nielsen2007). As a consequence, management is less institutionalized, and national or local rather than international, with a stronger focus on conservation than on exploitation. Salmon in Norway are managed by the Ministry of the Environment, whereas marine fishes are managed by the Ministry of Fisheries and Coastal Affairs, illustrating the difference in focus.

