Introduction
Humans use airspace for various purposes, such as construction, transportation, communication, and energy generation (Lambertucci et al. Reference Lambertucci, Shepard and Wilson2015). At the same time, flying wildlife also uses airspace as a core habitat that provides food resources, cover from predators, and migration passways (Diehl Reference Diehl2013). As humans’ use of airspace has rapidly increased over the past century, the airspace as a habitat for volant wildlife has faced spatial conflicts with human use and wildlife, similar to other habitats on earth (Lambertucci et al. Reference Lambertucci, Shepard and Wilson2015). Bird collisions resulting from man-made structures are noticeably representative of this issue. Birds in flight are prone to collisions with various artificial structures in the airspace through which they fly (Bevanger Reference Bevanger1994a, Choi and Xiao Reference Choi and Xiao2016, Tan et al. Reference Tan, Yong, Low, Owyong and Chia2017, Mitrus and Zbyryt Reference Mitrus and Zbyryt2018). Bird collisions with artificial structures are considered to have occurred since humans began building skyward structures (Avery Reference Avery1979), but they had not been well studied as an independent research topic until the mid-twentieth century. Utility structures, such as communication towers (Avery Reference Avery1979), lighthouses (Ogden Reference Ogden1996), and power lines (Bevanger Reference Bevanger1994a,Reference Bevangerb), made up the majority of subjects in early studies. Turbines of wind-power facilities have also become one of the significant causes of collision mortality among birds and bats, as sustainable energy production has emerged over time (Osborn et al. Reference Osborn, Higgins, Usgaard, Dieter and Neiger2000, Smallwood Reference Smallwood2007, Choi et al. Reference Choi, Wittig and Kluever2020, Largey et al. Reference Largey, Cook, Thaxter, McCluskie, Stokke, Wilson and Masden2021, Santos et al. Reference Santos, Ramesh, Ferraz, Franco and Wikelski2022).
In addition, transparent or reflective structures that cause collisions by confusing the visual perception of birds have been studied recently. Birds in flight have difficulty distinguishing transparent or reflective surfaces from the background scenery, while humans can recognise these surfaces by empirical knowledge. The best known representatives of transparent or reflective surfaces have been revealed to pose fatal risk factors (Erickson et al. Reference Erickson, Johnson and Young2005, Loss et al. Reference Loss, Will and Marra2015b) and are estimated to kill up to a billion birds in the USA (Loss et al. Reference Loss, Will, Loss and Marra2014) and 25 million in Canada (Machtans et al. Reference Machtans, Wedeles and Bayne2013), annually. Even though there is not much information about bird collisions in other regions, evidence of bird mortality has been steadily reported in case studies and reports (Yanagawa and Shibuya Reference Yanagawa and Shibuya1998, Nishi Reference Nishi2010, Bing et al. Reference Bing, Choi, Nam, Park, Hong, Sung, Chae and Choi2012, Low et al. Reference Low, Yong, Tan, Owyong and Chia2017). Overall, structures with transparent or reflective panels are considered the most hazardous to birds globally, in enormous and emerging quantities (Banks Reference Banks1976).
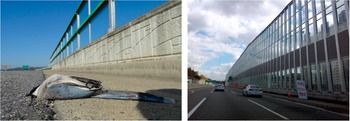
While window collisions are widely recognised as a critical conservation issue, the impact of collisions caused by other transparent structures has often been neglected from a conservation viewpoint. Shelters for public transport stations, advertisement hoardings on passages, enclosures for pedestrians, and roadside noise barriers made of glass or plastic are examples (Zyśk-Gorczyńska et al. Reference Zyśk-Gorczyńska, Skórka and Żmihorski2020). These structures are similar to windows in that their surfaces can reflect landscapes and vegetation by the directions of light. However, such structures can cause collisions on all sides by having no distinct volumetric structure except for their transparent panels and supporting frames (Figure 1). These transparent structures, relatively smaller than buildings or other collision-inducing structures in most cases are considered to be rapidly increasing with urbanisation and could cause a significant number of bird collisions (Johnson and Hudson Reference Johnson and Hudson1976, Barton et al. Reference Barton, Riding and Loss2017, Zyśk-Gorczyńska et al. Reference Zyśk-Gorczyńska, Skórka and Żmihorski2020). Although there are a few studies about mortality observations and mitigation factors for transparent bus stations (Barton et al. Reference Barton, Riding and Loss2017, Zyśk-Gorczyńska et al. Reference Zyśk-Gorczyńska, Skórka and Żmihorski2020) or noise barriers (Campedelli et al. Reference Campedelli, Londi, Cutini, Donati and Florenzano2014, Zbyryt et al. Reference Zbyryt, Suchowolec and Siuchno2016, Mitrus and Zbyryt Reference Mitrus and Zbyryt2018), little is known about bird-collision mortality at various spatial and temporal scales.
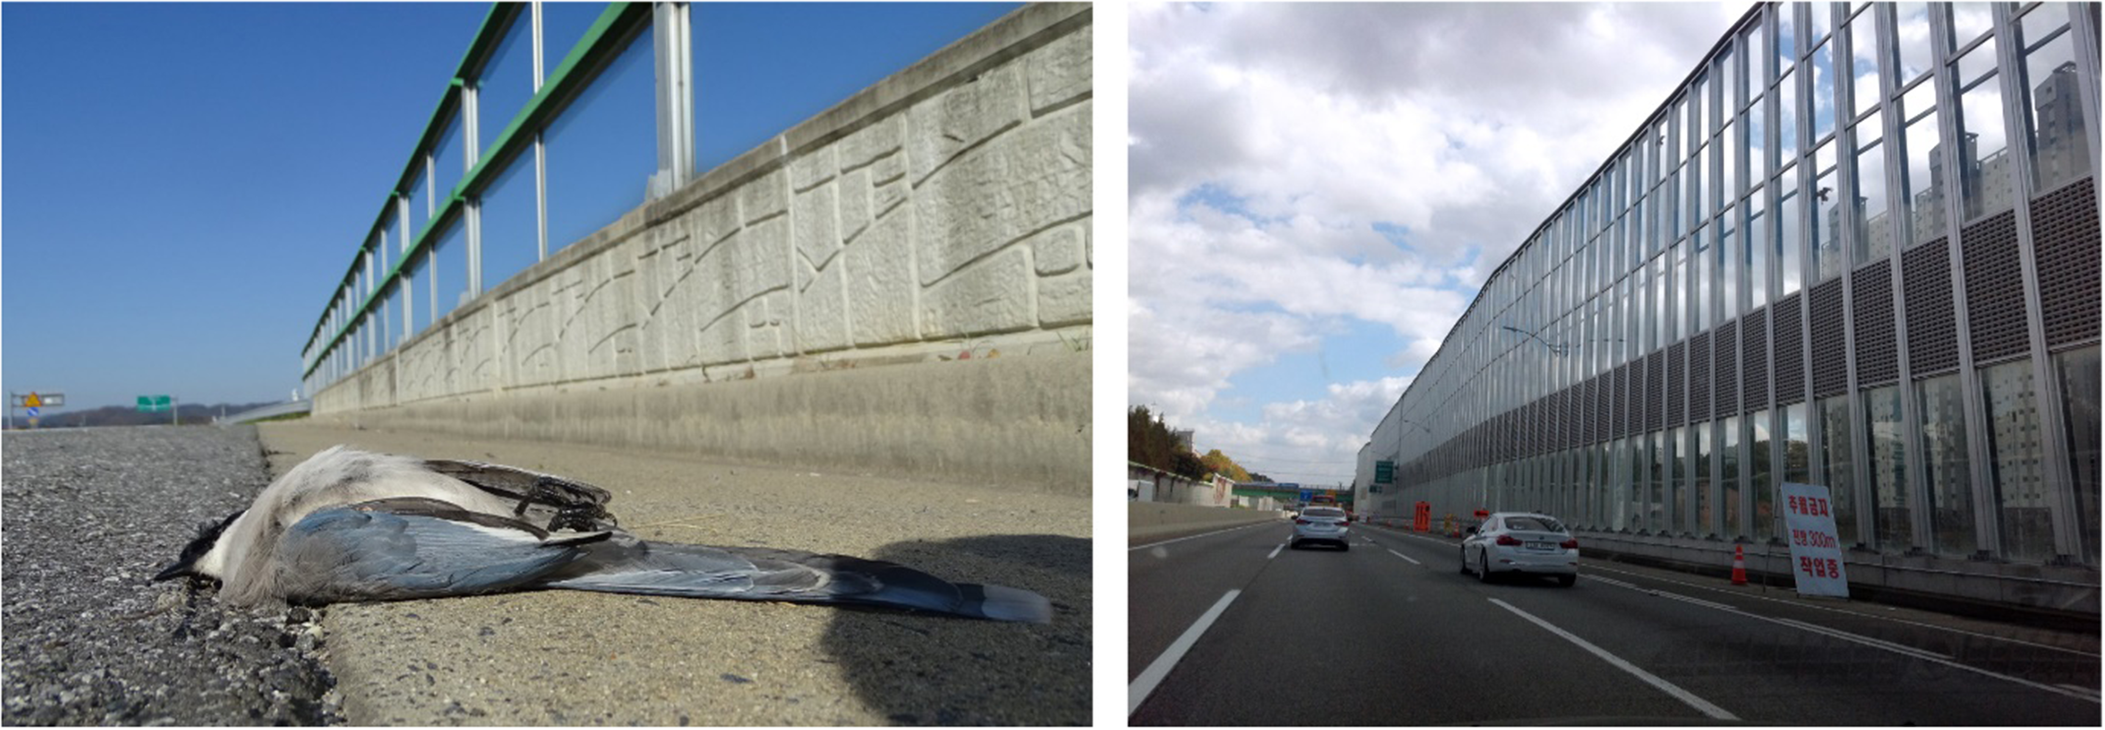
Figure 1. Examples of roadside noise barriers in the Republic of Korea. Left: an example of a transparent noise barrier with a collided Azure-winged Magpie Cyanopica cyanus; right: a partially transparent noise barrier that is >2 km in length.
After rapid urbanisation during the late twentieth century, the Republic of Korea has high population densities (Seoul: 16,034 people/km2; nationwide: 514 people/km2), and rapidly emerging road areas (increased 307.5% in length, from 1960 to 2018) (Statistics Korea 2019). These factors have resulted in very close spatial and three-dimensional configurations between roads and residential or business areas (Choi et al. Reference Choi, Kim and Yang2010, Ahn et al. Reference Ahn, Kim, Park, Lee and Kim2012). Therefore, many noise barriers have been installed nationwide over the past two decades, and they are still being liberally added as new roads and homes are built (Choi et al. Reference Choi, Kim and Yang2010, Ahn et al. Reference Ahn, Kim, Park, Lee and Kim2012, Ministry of Environment 2018, Statistics Korea 2019). Noise barriers surrounding private buildings, such as large residential areas and apartment complexes, are erected and managed solely by private owners and corporations, whereas those along roads are constructed and managed by local governmental authorities according to the required regulations. Recently, transparent noise barriers (TNBs), among several types of noise barriers, have been preferred because they allow wider fields of view and better natural lighting for drivers. They also offer aesthetic benefits (Rocchi and Pedersen Reference Rocchi and Pedersen1990) and prevent roads from freezing in winter by ensuring sunlight for both the road surface and the adjacent landowners and local residents (Ahn et al. Reference Ahn, Kim, Park, Lee and Kim2012). Bird collision risk due to TNBs is expected to increase as TNBs rapidly increase in number and area, but information on the current status of TNBs as well as the bird mortality due to TNBs is still lacking.
In this study, we aimed to collect information about the total length of roadside TNBs that may cause bird collisions on a national scale and to estimate the total annual mortality caused by TNB collisions along roadsides in Korea. Thus, we provide the first study of a nationwide-scale estimation of bird mortality due to collision with roadside TNBs to emphasise a globally emerging threat to birds.
Methods
Data collection: total length of roadside TNBs
We collected data from TNBs in which all panels of the barriers were made of transparent materials. Partially transparent noise barriers (PNBs) in which some parts of the barriers are made of transparent materials were also considered TNB in this study, but only the transparent parts of the PNB (tPNB) were included. As the height of the noise barriers was difficult to specify due to a shortage of data and the variable shapes of the barriers, we defined the unit of quantity as length (km) in this study. We collected data about the status of noise barriers from August to October 2018.
There are no official nationwide statistics on noise barriers in Korea so far because of the active instalment in private sectors. However, unlike private noise barriers around buildings, many noise barriers on roadsides are constructed and managed by local governments and traffic authorities. Therefore, the total length of roadside TNBs and tPNBs could be estimated with available data (e.g. location, date of instalment, type of TNB, length of TNB, etc.) collected from different governmental and public road management agencies. We categorised the roads into two types by road characteristics and their management jurisdiction: expressways (public and private) and local roads. Then, we collected available data about: 1) the total length of the roads; 2) the length of the TNBs and PNBs on each road; 3) the proportion of tPNBs. In cases where direct data on barriers were not available, we estimated the total length of the TNBs and tPNBs by the proportions of the 1), 2), and 3) available cases.
TNBs in 23 public and 21 private expressways are managed by a few selected traffic authorities, such as the Korea Expressway Corporation (KEC), and basic information on roadside TNBs is collectively reported to the Ministry of Land, Infrastructure and Transport (MOLIT), providing national-level data on expressways. We received data on the number and length of roadside TNBs in expressways from the KEC and MOLIT (unpublished data, as of October 2018). However, local roads in Korea are controlled and managed by the five Regional Construction and Management Administrations (RCMA) in MOLIT, and information on roadside TNBs has not been systematically collected across the RCMAs. We received available TNB data from the RCMAs (unpublished data, as of October 2018) and identified 12 cities and counties in three RCMAs that had the most complete and up-to-date information on the number and length of roadside TNBs: Nonsan, Chungju, and Boeun in Daejeon RCMA; Gwangju, Jeonju, Namwon, and Suncheon in Iksan RCMA; Daegu, Jinju, Pohang, Yeongju, and Jinyeong in Busan RCMA (Figure 2). To understand the changes in the length of the TNBs over time, we also compiled and analysed the data of 493 TNBs with known construction years between 1992 and 2018 from the RCMA dataset.
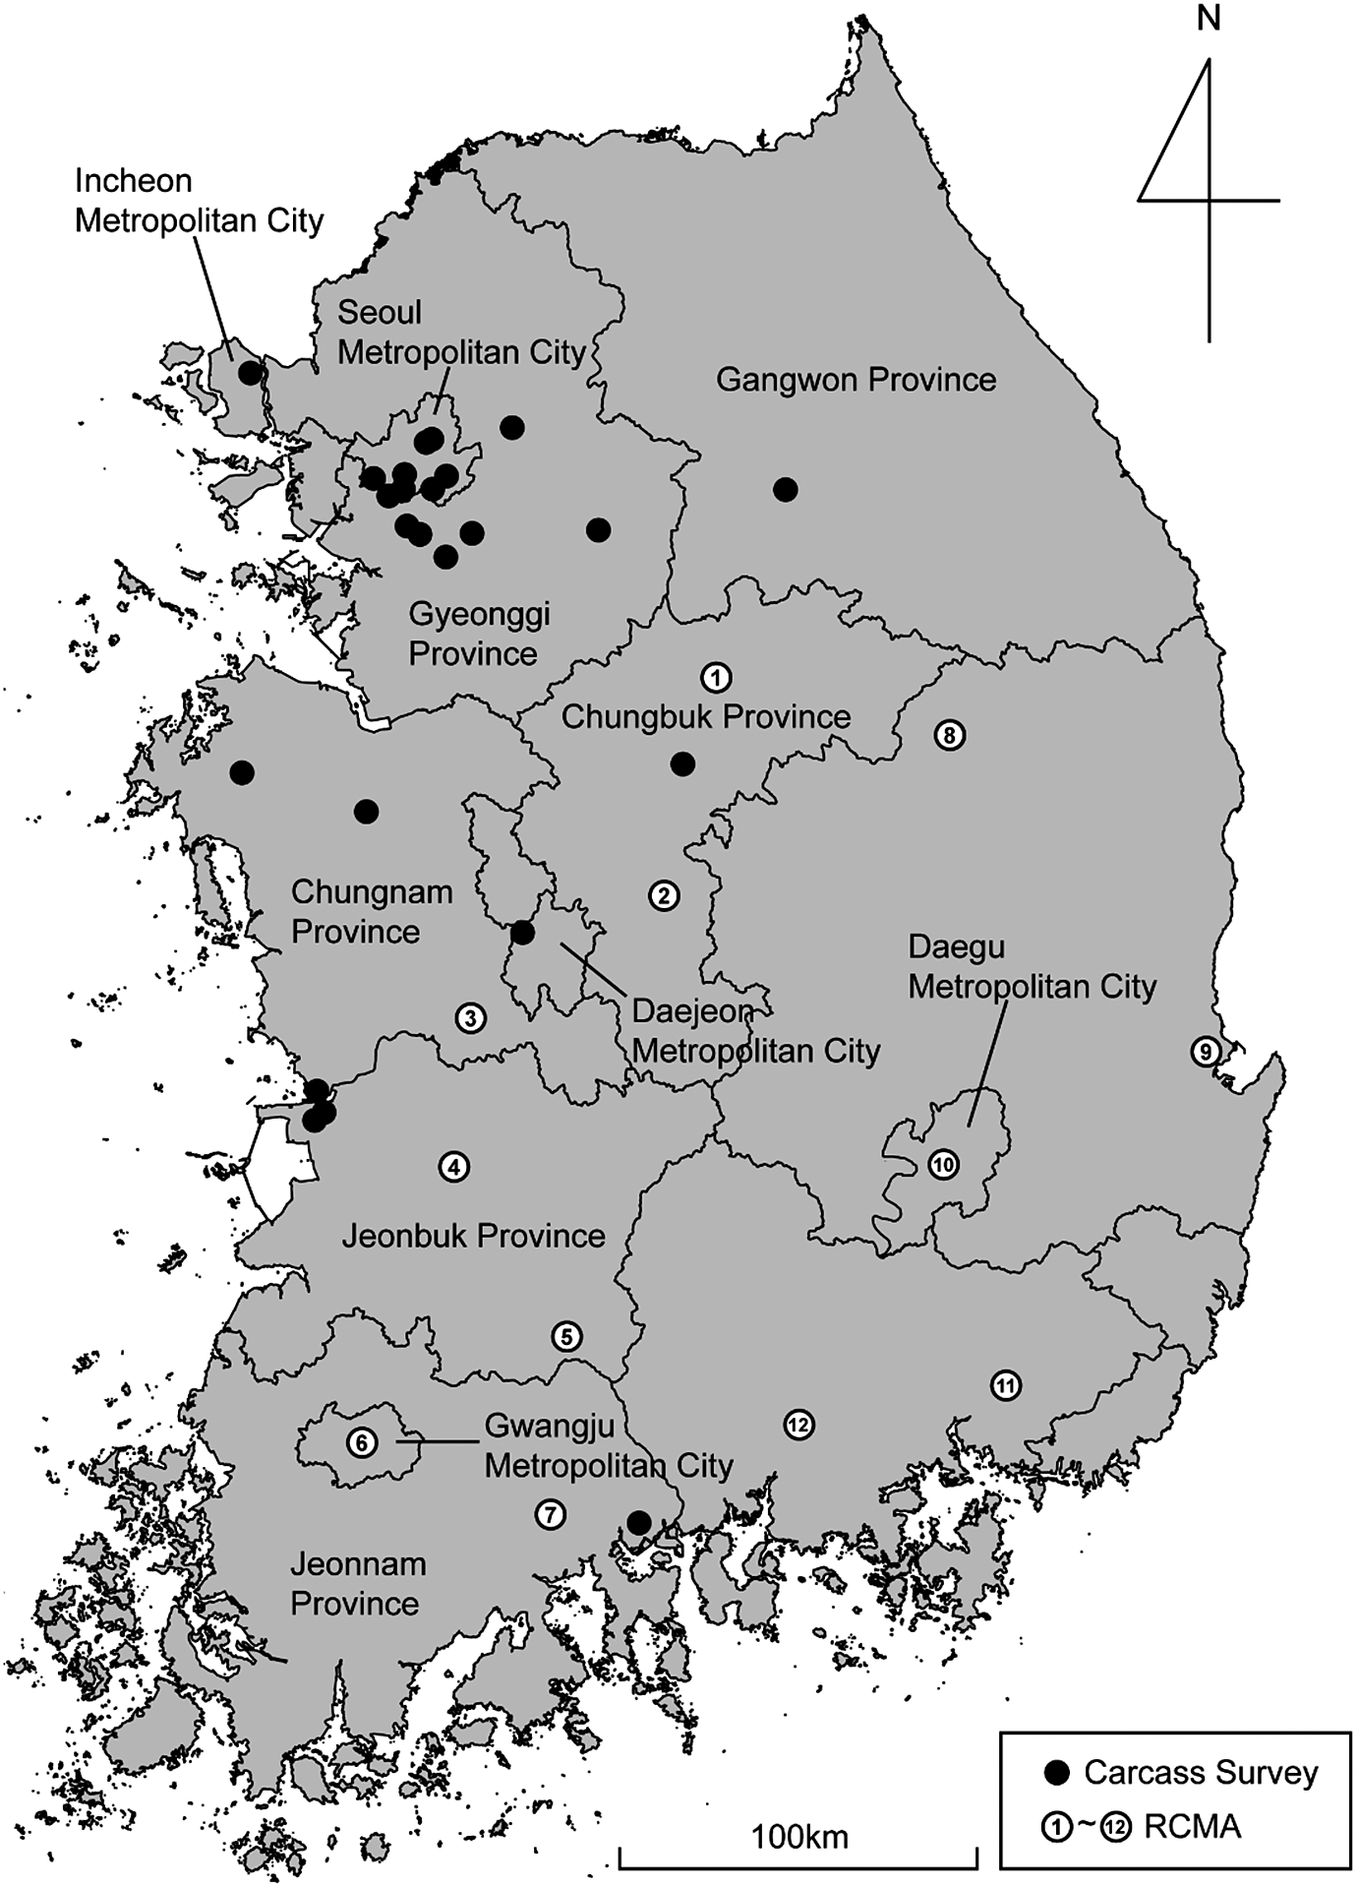
Figure 2. Locations of the barriers monitored by the carcass survey (filled circles) and Regional Construction and Management Administrations. 1: Chungju; 2: Boeun; 3: Nonsan; 4: Jeonju; 5: Namwon; 6: Gwangju; 7: Suncheon; 8: Yeongju; 9: Pohang; 10: Daegu; 11: Jinyeong; 12: Jinju.
Data collection: carcass survey
Carcass surveys are a common method for animal population analysis and are widely used in bird-collision studies (Ford and Zafonte Reference Ford and Zafonte2009, Stevens and Dennis Reference Stevens and Dennis2013, Hager and Cosentino Reference Hager and Cosentino2014, Santos et al. Reference Santos, Santos, Santos-Reis, De Figueiredo, Bager, Ludmilla and Ascensão2016). We undertook field carcass surveys to collect information about collided birds and TNBs from November 2017 to October 2018. Generally, following a protocol for quantitative carcass surveys (Hager and Cosentino Reference Hager and Cosentino2014), we monitored 25 TNBs of expressways and local roads selected based on accessibility and safety issues in three metropolitan cities and six provinces. We measured the length of the selected TNBs and checked for carcasses of collided birds monthly around the barriers. Unlike the windows of buildings, transparent panels of TNBs can lead to collisions on both sides; we also recorded on which side of a barrier a carcass was found.
Carcasses may not be found during surveys because of various factors, leading to an underestimation of mortality. There are two factors widely accepted in bird-collision studies: persistence rate (PR) and detection rate (DR) (Byrd et al. Reference Byrd, Reynolds and Flint2009, Machtans et al. Reference Machtans, Wedeles and Bayne2013, Loss et al. Reference Loss, Will, Loss and Marra2014). As carcasses of collided birds are often removed by scavengers or maintenance workers before observation, the number of persistent carcasses that researchers can observe is only a fraction of the total number of collided birds. To prevent underestimation of mortality, the PR of carcasses should be applied to an estimator. To assess the daily carcass PR, our monthly survey was carried out for a minimum of two consecutive days at a time. About 24 hours after the observation on the previous day, we visited the site again to check whether the observed carcass was lost. The observed carcasses were removed from the site to prevent duplicate observations in the next search. DR is the proportion of observed carcasses to the total number of collided birds. Existing carcasses in a survey area may not be found due to searchers’ detection efficiencies. We undertook detection experiments of several searchers by placing prepared carcasses during routine field surveys without prior notice.
Since transparent panels can lead birds to collisions on both sides of the barrier, mortality estimation will be biased if the collision mortality of both sides is different. We defined this bias as the difference in unit mortality between both sides and analysed the observed data of the nine most intensively monitored barriers.
Data analysis: mortality estimation
Statistical analysis for total annual mortality estimates is based on a random number simulation that refers mainly to the calculations of a prior study (Loss et al. Reference Loss, Will, Loss and Marra2014). Using a specific probability distribution of the observed mortality and correction factors, we estimated mortality at the nationwide scale through 10,000 random iterations based on the Monte Carlo method (Loss et al. Reference Loss, Will, Loss and Marra2014). The mortality estimation model we used is as follows:
where M is the nationwide total annual mortality, M int is the total annual mortality of collisions on the interior side of the TNB, M ext is the total annual mortality of collisions on the exterior side of the TNB, m int is the observed daily unit mortality of collisions on the interior side of the TNB, m ext is the observed daily unit mortality of collisions on the exterior side of the TNB, and B is the nationwide total length of the TNBs (km).
The observed mortality was converted to daily mortality per unit length (km) of the barrier and described as a histogram. We selected five non-negative probability distributions similar to the histogram by visual inspection and then chose the most suitable one by the small-sample corrected Akaike information criterion (AICc): exponential, gamma, inverse Gaussian, lognormal, and Weibull distributions. All variables of the model were processed by this procedure except for two fixed values: the total length of TNBs and 365 days. Then, a set of random numbers was generated following the distribution and parameters of each factor and variable. Each random number was assigned as a variable of the model and calculated for one sample of total annual mortality. As a result of the iteration, we obtained a new, combined probability distribution representing the total annual mortality estimates. We used software R version 4.0.3 (R Core Team 2020) with Rstudio version 1.3.1 (Rstudio Team 2020) and Microsoft Excel 2016 (Microsoft Corporation 2016) in all procedures of analysis and figure generation. The R packages “asbio” (Aho Reference Aho2020) and “readxl” (Wickham and Bryan Reference Wickham and Bryan2019) were used to calculate daily unit mortality and to conduct random number simulations. To estimate the probability distribution and parameters, the packages “gamlss” (Rigby and Stasinopoulos Reference Rigby and Stasinopoulos2005), “gamlss.dist” (Stasinopoulos and Rigby Reference Stasinopoulos and Rigby2020a), “gamlss.inf” (Enea et al. Reference Enea, Stasinopoulos, Rigby and Hossain2019), and “gamlss.tr” (Stasinopoulos and Rigby Reference Stasinopoulos and Rigby2020b) were used. The package “MuMIn” (Bartoń Reference Bartoń2020) for AICc model evaluation and “dgof” (Arnold and Emerson Reference Arnold and Emerson2011) for the statistical tests were also used. Adobe Illustrator CS6 (Adobe Inc. 2012) was also used to edit the figures. Cross calculations by the sequence of random number placement within each random number set were not performed.
Results
Total length of roadside TNBs
According to the data from all 23 public expressways extending over 4,000.64 km, the total lengths of TNBs and PNBs were 74.89 km and 327.91 km, respectively. Although the length of the tPNB was not directly measured, the average proportion of tPNB was provided in the statistics for each expressway. Based on the proportion ranging from 11.30% to 48.10%, we estimated the total length of tPNBs and summed up to estimate 90.65 km of tPNBs, which occupies 27.65% on average. Consequently, the total length of TNBs and tPNBs was estimated to be 165.54 km for public expressways, covering 4.14% of the total length of the roads (Table 1).
Table 1. The estimated length of the transparent parts (km) of transparent noise barriers (TNBs) and partially transparent noise barriers (tPNBs) in the Republic of Korea (as of 2018). The parentheses in the PNB column indicate the total length of the PNB.


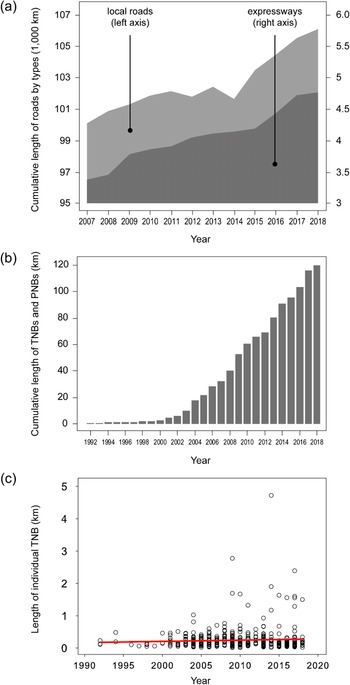
Figure 3. Temporal changes in the status of roads and transparent noise barriers (TNBs) in the Republic of Korea. (a) The cumulative length of roads (light grey: local roads; dark grey: expressways); (b) the cumulative lengths of TNBs and transparent parts of partially transparent noise barriers (tPNBs) in local roads; (c) the length of an individual TNB and PNB with a red linear regression line. The TNB and tPNB data for (b) and (c) were collected from 493 barriers established on local roads in 12 cities and counties.
For 21 private expressways of 766.70 km, the total lengths of TNBs and PNBs were 43.31 km and 18.40 km, respectively. As the proportion of tPNB is unknown for private expressways, we applied the proportion of public expressways (27.65%) to estimate the length of tPNBs. Therefore, the total length of TNBs and tPNBs (5.09 km) was estimated to be 48.40 km for private expressways (Table 1).
Out of 7,277.00 km monitored by 12 cities and counties in three RCMAs, the total length of noise barriers (TNBs and PNBs) was 85.05 km, providing proportions of 1.17% on average (0.85–1.46%). By applying this proportion to the total length of all national local roads (105,947.00 km), the estimated length of noise barriers was 1,238.27 km. Among them, detailed data by type were only available in seven cities and counties, TNB length (53.58 km, 94.87%) and PNB length (2.90 km, 5.13%), which included transparent parts of 1.23 km (2.17%). Therefore, the nationwide length of transparent parts was estimated to be 1,201.68 km, which is 97.04% of all noise barrier lengths alongside local roads (Table 1).
As a result, the total length of roadside TNBs with tPNBs was estimated to be 1,415.61 km: 165.54 km public expressways, 48.39 km private expressways, and 1,201.68 km local roads (Table 1). The total length of roads has gradually increased (Figure 3a), but that of roadside TNBs has exponentially increased from 0.46 km to 116.09 km over 20 years (Figure 3b). In addition, although the mean length of a single TNB was unchanged (mean ± standard deviation: 243 ± 354 m; r2 = 0.0033, P = 0.201), longer barriers over 1 km in length were recently being installed; the single largest TNB along a local road found in this study was 4.7 km in length constructed in 2014 (Figure 3c).
Carcass survey and mortality estimate
We found a total of 302 carcasses of 41 species killed by collision. The most common victims were abundant and widespread residents, such as Oriental Turtle Doves (Streptopelia orientalis; 71 birds, 23.5%), followed by Brown-eared Bulbuls (Hypsipetes amaurotis; 39 birds, 12.9%), and Eurasian Tree Sparrows (Passer montanus; 38 birds, 12.6%). However, the globally threatened Japanese Paradise Flycatcher (Terpsiphone atrocaudata) as well as nationally protected species, such as the Eurasian Kestrel (Falco tinnunculus), Oriental Scops Owl (Otus sunia), and Northern Boobook (Ninox japonica), were also found (see Table S1 in the online Supplementary Materials for details).
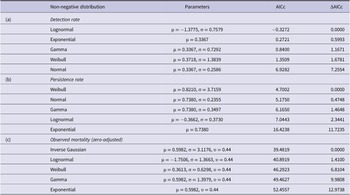
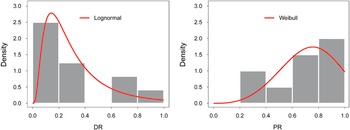
Correction factors were represented as 0.10–0.87 for DR (n = 12) and 0.00–1.00 for PR (n = 10). Based on AICc scores, the distribution that the DR followed best was a lognormal distribution (μ = -1.3775, σ = 0.7579) (Table 2). The statistical test results showed no difference between the results of 10,000 simulated samples and the selected distribution (Kolmogorov–Smirnov test; D = 0.18, P = 0.83; Figure 4 left) showed that the DR follows a lognormal distribution. PR was found to follow a Weibull distribution (μ = 0.8210, σ = 3.7159) (Table 2) (Kolmogorov–Smirnov test; D = 0.30, P = 0.33; Figure 4 right) by the same procedures.
Table 2. The results of the small-sample corrected Akaike information criterion (AICc) of five non-negative distributions fitted to the detection rate, persistence rate, and observed mortality.

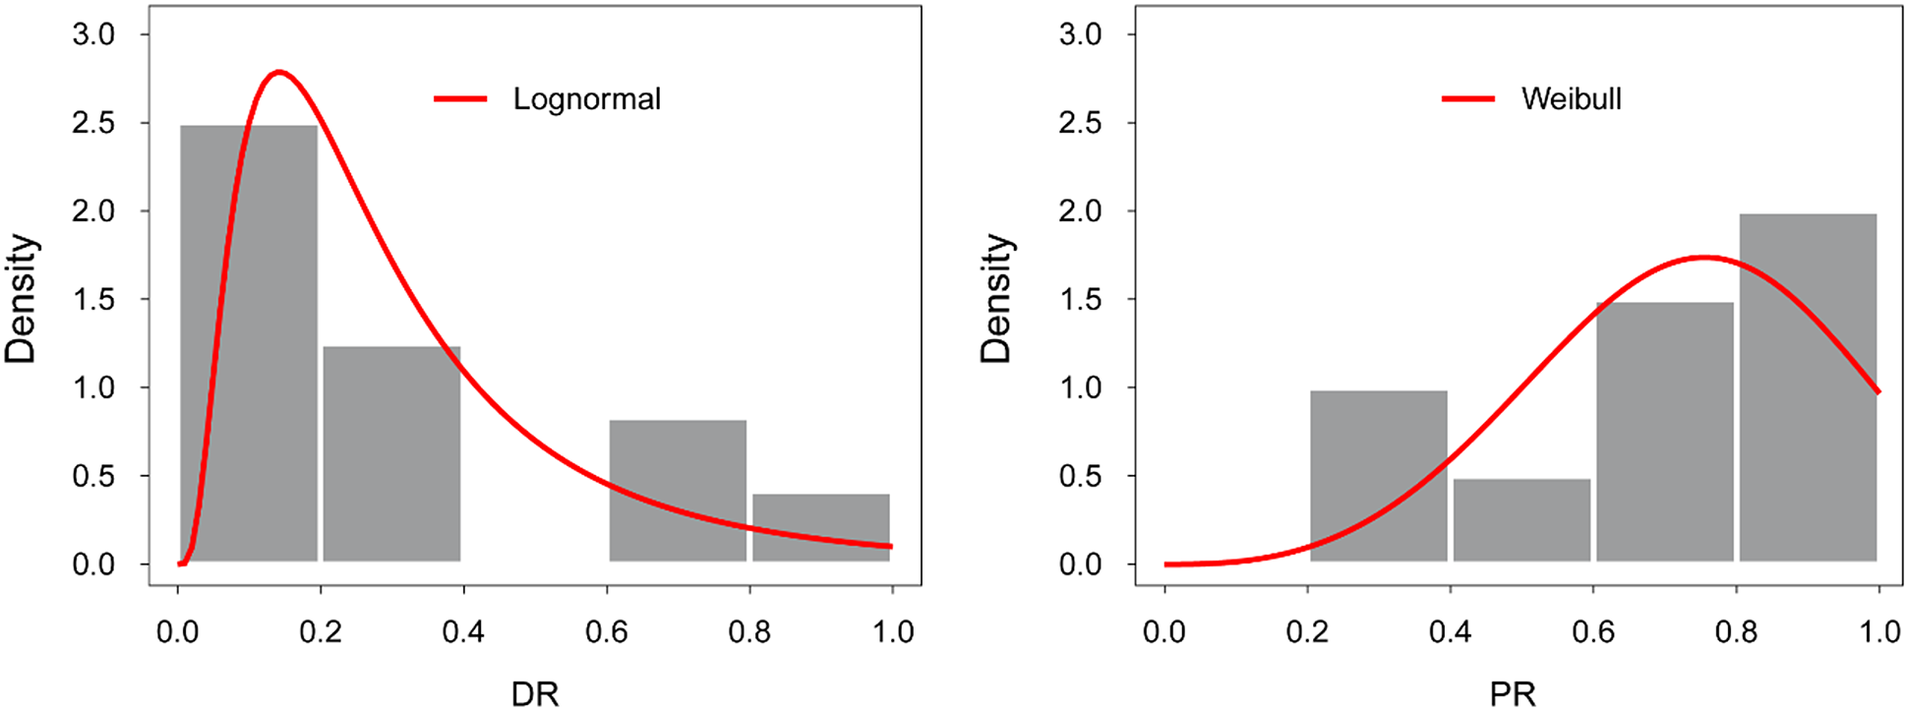
Figure 4. Histograms and fitted probability distribution functions of the correction factors. Left: the detection rate (DR); right: the persistence rate (PR).
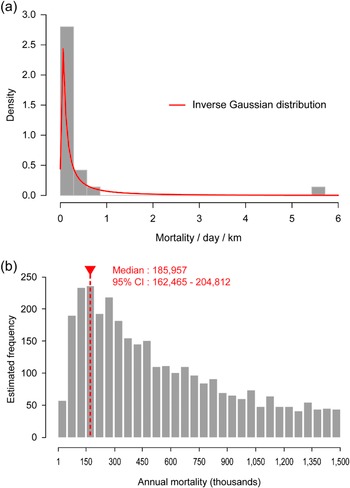
There was no difference in the observed mortality between local roads (0.24 ± 0.61 birds/km; n = 19) and expressways (0.16 ± 0.27 birds/km; n = 6) (Mann–Whitney U test; U = 47.000, P = 0.528) (Figure 5 left). Unit mortality between both sides of the analysed barriers did not show statistical evidence of a difference (Wilcoxon signed-rank test; W = 13, P = 0.272; n = 9), indicating that the mortality at both sides of a TNB were similar (Figure 5 right). Therefore, the total mortality per unit length was simply doubled by the estimator (mint = mext). Daily unit mortality by the observed barriers was 0.3350 ± 1.1322 birds/km on average (see Table S2 in the online Supplementary Materials for details), which was considered to follow an inverse Gaussian distribution (μ = 0.5982, σ = 3.1176, ʋ = 0.44) (Table 2). As the results of the statistical test showed no difference between the results of 10,000 simulated samples and the selected inverse Gaussian distribution (Kolmogorov–Smirnov test; D = 0.09, P = 0.99) (Figure 6a), we concluded that the observed daily unit mortality follows an inverse Gaussian distribution. Through 10,000 iterations, the median total annual mortality estimate of TNB collisions was 185,957 (95% confidence interval: 162,465–204,812) (Figure 6b).

Figure 5. Box plots comparing the daily mortality rate per unit length (1 km) observed in this study. Left: a comparison by road types (local roads vs. expressways); right: a comparison by sides of a transparent noise barrier (interior vs. exterior side of a road).

Figure 6. Results of the carcass survey and annual mortality estimation. (a) A histogram for observed daily mortality rates per unit length of transparent noise barriers (TNBs) in this study and fitted probability distribution function (red line); (b) the estimated frequency histogram of the total annual bird mortality caused by collisions with TNBs (limit of x-axis; 1–1,500,000) with a median mortality estimate (vertical dashed line).
Discussion
Total length of TNBs
Our results provide the first quantitative estimates of the nationwide length and increasing trend of roadside TNBs in the Republic of Korea. The proportion of TNBs to the total road length is higher on expressways (both public and private) than on local roads. This may be because more noise is made by the higher driving speed of expressways, while the total estimated length of TNBs was lower in expressways due to the incomparably higher total length of local roads. As observed, bird mortality showed no significant difference by road type, so the overall mortality toll is expected to be higher on local roads than on expressways. The expressways and their utility structures are managed and controlled by two main administration subjects, the KEIC and MOLIT. Local roads, in contrast, are managed by locally segmented agencies (RCMAs), and their data were provided with uneven formats, contents, and quality (Ministry of Environment 2018). Although we carried out the quantitative estimation with the given information, the estimation could have been more reliable if uniformly qualified TNB data were provided. Previous studies revealed that transparent or reflective structures in rural areas cause more mortality than those in urban areas (Hager et al. Reference Hager, Cosentino, McKay, Monson, Zuurdeeg and Blevins2013, Loss et al. Reference Loss, Will, Loss and Marra2014, Zyśk-Gorczyńska et al. Reference Zyśk-Gorczyńska, Skórka and Żmihorski2020). Based on this, bird mortality from TNB collisions must have been affected by the expanding urbanisation of the environment as well as the increasing number of other transparent structures (Bayne et al. Reference Bayne, Scobie and Rawson-Clark2012, Zyśk-Gorczyńska et al. Reference Zyśk-Gorczyńska, Skórka and Żmihorski2020). Thus, for subsequent studies, the classification of TNB by the urbanisation level of the surrounding areas may promote meaningful discussions in the estimation of collision mortality.
Considering all types of roads, the total length of roadside TNBs was estimated at over 1,400 km as of 2018, and the cumulative length (and possibly quantity) is increasing exponentially. Given the trends in the individual sizes of the TNBs, the great majority are small barriers (200–250 m in length), and there was no significant increase in the mean length of an individual TNB by year. However, as TNBs with extensive lengths are constructed over time, the maximum length of individual TNBs will gradually increase, and a single barrier over 4 km in length appeared recently. This finding suggests that the number of birds colliding with roadside TNBs is projected to increase as the length, number, and possibly maximum size of roadside TNBs sharply increase over time. As we focused only on roadside barriers that have accessible management agents and installation data, the total collision mortality, including privately installed noise barriers, is expected to be higher than in our estimates. Other countries, especially those with increasing quantities of traffic areas and noise barriers under rapid urbanisation, possibly have emerging bird-collision mortality based on this study. Since no organised data for TNBs and TNB collisions are available internationally so far, standardised data collection from local to national scales is required in terms of bird conservation.
Carcass survey and mortality estimation
Although some locally protected species were found, the majority of the victims observed in our carcass survey were common resident birds with no clear or urgent conservation priority at present (Gill et al. Reference Gill, Donsker and Rasmussen2020, IUCN 2021). However, these results may not reflect relative collision vulnerability among species because total carcass counts are confounded by each species’ population size (Schaub et al. Reference Schaub, Kéry, Korner and Korner-Nievergelt2011, Klem Jr. et al. Reference Klem, De Groot, Krebs, Fort, Elbin and Prince2012, Loss et al. Reference Loss, Will, Loss and Marra2014, Wittig et al. Reference Wittig, Cagle, Ocampo-Peñuela, Winton, Zambello and Lichtneger2017). To assess the actual species-specific vulnerability of TNB collisions, long-term information on population trends and other mortality causes is needed as well as collision mortality (Schaub et al. Reference Schaub, Kéry, Korner and Korner-Nievergelt2011). As there is little organised information about the bird population trends in this region (Kim et al. Reference Kim, Mo, Choi, McComb and Betts2021), it is still beyond our knowledge whether TNB collision affects birds at a species-specific or population-specific scale at this stage. In the current situation, in which there is no regulation of TNB construction to mitigate bird collisions, it is important to investigate the vulnerability of high-risk species (Loss et al. Reference Loss, Will, Loss and Marra2014, Wittig et al. Reference Wittig, Cagle, Ocampo-Peñuela, Winton, Zambello and Lichtneger2017, IUCN 2021) and locally protected species (see Table S1 in the online Supplementary Materials for details) to support future actions and national legislation.
We considered the PR, DR, and side bias as correction factors. In this study, side bias was determined, as there was no difference between the interior and exterior of a single barrier. Noise barriers are established at the border of the noise source and the residential area. Noise sources such as traffic or industrial areas have less vegetation than residential areas in most cases. Vegetation coverage around collision structures is positively related to bird-collision mortality (Gelb and Delacretaz Reference Gelb and Delacretaz2009, Klem Jr. et al. Reference Klem, Farmer, Delacretaz, Gelb and Saenger2009, Hager et al. Reference Hager, Cosentino, McKay, Monson, Zuurdeeg and Blevins2013, Loss et al. Reference Loss, Lao, Eckles, Anderson, Blair and Turner2019), and the exterior side of a TNB that has more surrounding vegetation is likely to cause more mortality than the interior side along a road, unlike our results. This finding suggests that birds that successfully crossed the road may encounter a similar collision risk by a TNB installed on the other side of the road. This result also represents a difference between transparent structures such as TNBs and building windows. Window-related collisions are caused by reflections of landscape and vegetation, or exposure of indoor environments (Banks Reference Banks1976, Klem Jr. Reference Klem1989, Gelb and Delacretaz Reference Gelb and Delacretaz2006, Seewagen Reference Seewagen2014), resulting in mortality mainly occurring only on a single, outdoor side. In the case of TNBs, on the other hand, the scenery beyond their transparent panels causes collisions on both sides. In addition, TNBs are simply composed of transparent panels and supporting frames, unlike buildings with relatively large, complex, and volumetric structures. These characteristics of roadside TNBs are driving a higher collision risk potential – vulnerability on both sides and less obvious structures – that is shared with various modern and urban structures with more transparent panels, e.g. bus stops, overhead bridges, phone booths, and garden fences (see Figure S1 in the online Supplementary Materials for details). Therefore, factors different from those of windows should be considered to investigate the impact of transparent structures. As additional factors of mortality and side bias, environment type, topography, and vegetation coverage of the landscape on each side that shows through can be considered.
PRs and DRs can be influenced by a variety of factors, according to previous studies on other structures. The removal of carcasses by scavenging or roadside cleaning affects the persistence period (Ponce et al. Reference Ponce, Alonso, Argandoña, García Fernández and Carrasco2010, Hager et al. Reference Hager, Cosentino and Mckay2012, Borner et al. Reference Borner, Duriez, Besnard, Robert, Carrere and Jiguet2017), while the growth of plants affects carcass detectability (Hager et al. Reference Hager, Cosentino and Mckay2012, Borner et al. Reference Borner, Duriez, Besnard, Robert, Carrere and Jiguet2017) and searcher efficiency (Barrientos et al. Reference Barrientos, Martins, Ascensão, D’Amico, Moreira and Borda-de-Água2018). Since the density of birds in specific spatial and temporal conditions also influences the mortality (Bracey Reference Bracey2011), three-dimensional configurations of the surrounding landscape by time should be considered as factors of the species composition and abundance of the birds (Hager and Craig Reference Hager and Craig2014, Sabo et al. Reference Sabo, Hagemeyer, Lahey and Walters2016). Additionally, clarity or discoloration of panels over time may alter the collision risk and mortality (Zyśk-Gorczyńska et al. Reference Zyśk-Gorczyńska, Skórka and Żmihorski2020). Such factors would vary depending on the spatiotemporal features of each TNB. Moreover, the mortality rate was only estimated per unit length (km) in this study. Previous studies have investigated whether collision mortality is positively related to the area of the colliding surfaces (Klem Jr. et al. Reference Klem, Farmer, Delacretaz, Gelb and Saenger2009, Hager et al. Reference Hager, Cosentino, McKay, Monson, Zuurdeeg and Blevins2013, Loss et al. Reference Loss, Lao, Eckles, Anderson, Blair and Turner2019), therefore, the height, shape, and angle of the TNB are important factors to be considered. In future studies, careful assessment of various environmental factors and morphological characteristics of the noise barriers are needed to improve the accuracy of the estimation.
Our estimate was that approximately 186,000 birds are killed every year from collisions with existing roadside TNBs in the Republic of Korea. We determined the mean and confidence interval to follow the median instead of the average to reduce the influence of extreme values, as the estimate resulted in a heavy-tailed shape caused by extreme values of observed daily mortality. Although it is common for observed mortality to have huge variance because bird collisions are accidental events that occur in vast areas, more samples could make the mortality estimates more precise. As a pioneering case for a TNB collision study, this study has limitations in sample size, and long-term data collection from diverse regions is needed to improve the precision of the estimates.
Conclusions
Transparent structures are known to be the most serious source of avian collision mortality (Erickson et al. Reference Erickson, Johnson and Young2005, Klem Jr. Reference Klem2008, Loss et al. Reference Loss, Will and Marra2015b), but little is still known about mortality from structures other than building windows (Barton et al. Reference Barton, Riding and Loss2017, Zyśk-Gorczyńska et al. Reference Zyśk-Gorczyńska, Skórka and Żmihorski2020). Our study brought TNB collision to light as an emerging conservation threat to birds and highlighted the need for a mitigation scheme and policy that had been reviewed by the Korean government. As a result, the Wildlife Protection and Management Act was amended in May 2022 to make owners of public facilities and structures (such as government-owned TNBs and buildings) take obligatory measures to reduce bird collision mortality. There are a few earlier studies reporting mortality records and species composition due to TNB collision (Campedelli et al. Reference Campedelli, Londi, Cutini, Donati and Florenzano2014, Zbyryt et al. Reference Zbyryt, Suchowolec and Siuchno2016), yet this study is significant as it is the first to quantify TNB collision mortality on a national scale. In addition to this quantitative evidence of bird mortality, the exponentially increasing roadside TNB length demonstrates that bird collisions with TNBs can be an emerging hazard to birds. Even apart from the number of birds killed by such a rapidly increasing hazard, it is still a notable conservation issue as collisions with transparent structures cause non-selective mortality regardless of individual characteristics such as age, sex, or fitness (Klem Jr. Reference Klem1989, Reference Klem1990). As bird collision occurs wherever a collision object exists (Avery Reference Avery1979, Klem Jr. Reference Klem1989, Reference Klem1990), TNB collision could possibly become an emerging threat to avian conservation, especially in developing and urbanising regions around the world. A systematic survey of the installation, status, and bird mortality of TNBs is urgently needed to formulate management and mitigation policies. In addition, although the new legislation was recently amended in Korea, legal regulations that restrict the construction of transparent structures and mandate mitigation of the impact to bird populations are still strongly needed. Private noise barriers, especially, may be difficult to regulate or monitor at a national level. A citizen science-based method and education programmes to increase public awareness and participation can lead to a breakthrough in collecting diverse spatiotemporal data with limited resources and generate powerful matrix management efforts resulting in positive, cumulative, and measurable impacts on biodiversity on residential land (Cooper et al. Reference Cooper, Dickinson, Phillips and Bonney2007, Loss et al. Reference Loss, Loss, Will and Marra2015a, Kummer et al. Reference Kummer, Bayne and Machtans2016, Nichols et al. Reference Nichols, Homayoun, Eckles and Blair2018).
Supplementary Materials
To view supplementary material for this article, please visit http://doi.org/10.1017/S0959270922000454.
Acknowledgements
We deeply appreciate the volunteers and participants who supported the fieldwork and collected bird carcasses. We also thank the anonymous reviewers for constructive advice.
This work was supported by the National Institute of Ecology and the Korean Ministry of Environment (grant number 20171000711–00). The staff of the Ministry of Environment and the National Institute of Ecology assisted with the resources and administration of participant recruitment for the field survey. All participants consented to provide the collected data for analysis.


