Phytosterols are the phytochemicals that are found to have a structure comparable to cholesterol(Reference Dutta1). They are found in plant foods where they function as part of the plant cell membrane(Reference Ryan, Galvin and O’Connor2). There are various types of phytosterol widely grouped into plant sterols and plant stanols. The most abundant phytosterols are β-sitosterol, stigmasterol and campesterol(Reference Lagarda, Garcia-Llatas and Farre3). The main sources of plant sterols are vegetable oils, nuts and seeds(Reference Racette, Lin and Ma4). Plant stanols are a subgroup of phytosterols that are saturated(Reference Lagarda, Garcia-Llatas and Farre3). Plant stanols are found in mixtures of extracted sterols, which is the mixture of free sterols and stanols and their esters. Enriched extracted sterols are found mostly in commercial products such as margarine, fermented milk drinks, salad dressing, spreads, milk, soya, yogurt, cheesy products, soya and fruit drinks, sausages and breads, ready-to-eat meals, snack bars and candies(Reference Bacchetti, Masciangelo and Bicchiega5).
Dietary intake of plant sterols varies greatly in Western countries. The median phytosterol intake in the European Perspective Investigation into Cancer and Nutrition Spanish cohort is approximately 315 mg/d(Reference Escurriol, Cofán and Moreno-Iribas6). The average intake of phytosterols in the UK is 163 mg/d(Reference Morton, Lee and Buss7). Phytosterol intake in the usual Spanish diet is approximately 276 mg/d(Reference Jimenez-Escrig, Santos-Hidalgo and Saura-Calixto8).
The cholesterol-lowering property of phytosterols is one of the well-established health benefits of plant sterols and plant stanols. For example, it has been shown that an intake of 2 g/d of stanols or plant sterols lowers plasma LDL-cholesterol levels by approximately 10 %(Reference AbuMweis, Barake and Jones9). Plant sterols and stanols also have anticancer properties(Reference Tapiero, Townsend and Tew10).
Phytosterol intake is difficult to assess due to the lack of comprehensive updated plant sterol and stanol composition data, particularly related to plant stanols in fortified foods. Of the published reports on phytosterol intake to date, the most comprehensive and referenced article dates back to 1978(Reference Weihrauch and Gardner11). To our knowledge, only one validation study on phytosterol consumption was conducted in 2013 by Northern Sweden group whom found the moderate to high association between FFQ and 24-h dietary recall (24HDR)(Reference Klingberg, Winkvist and Hallmans12).
We estimated phytosterol intake in the Adventist Health Study-2 (AHS-2) population, which is a prospective cohort of adult Adventists in North America, with a wide range of plant foods intake(Reference Butler, Fraser and Beeson13). AHS-2 participants are 48·2 % non-vegetarian, 5·5 % semi-vegetarian, 9·8 % pesco-vegetarian, 28·9 % lacto-ovo vegetarian and 7·6 % vegan(Reference Orlich, Singh and Sabaté14). The primary dietary assessment method in the AHS-2 is the FFQ, a widely used approach to assess habitual dietary intake of large study populations(Reference Willett15). In order to further associate dietary intake (based on FFQ) with disease outcomes, it is crucial to first examine the performance of the FFQ in measuring true intake. In the AHS-2, a calibration sub-study was conducted for the purpose of validating food frequency data and to correct biases related to measurement errors(Reference Butler, Fraser and Beeson13).
The objective of this paper is to compare plant sterol and plant stanol intake assessed by the FFQ intake with multiple 24HDR as the reference, using data from the calibration sub-study of the AHS-2.
Methods
Study design
The AHS-2 is a prospective cohort of 95 873 adults. Baseline data collection was from 2002 to 2007. Participants of this cohort had to be 30 years or older and sufficiently fluent in English in order to complete a comprehensive lifestyle questionnaire which included the FFQ(Reference Butler, Fraser and Beeson13). In order to validate the dietary information of the comprehensive lifestyle questionnaire, the investigators of AHS-2 conducted a calibration sub-study of 1011 subjects from the AHS-2 cohort. Calibration sub-study subjects were randomly selected by church location, and then subjects within each church were selected by sex and age. Black participants were purposefully oversampled to ensure more similar proportions of black and white participants. Throughout the 9- to 12-month period of the calibration study, the data collection included the FFQ, six 24HDR and collection of biological specimens (i.e. plasma, serum, urine, etc.).
We excluded subjects who did not complete the requisite number of recalls (n 96), or subjects with an incomplete FFQ (n 34), total energy intake greater than 4500 kcal (18 830 kJ) or less than 500 kcal (2090 kJ) and/or a BMI greater than 50 or less than 15 kg/m2 (n 102). After these exclusions, the number of participants available for statistical analysis was 779. The analytic subjects and those who were excluded from the analysis were found to be similar in baseline characteristics.
This study was conducted according to the guidelines laid down in the Declaration of Helsinki, and all procedures involving human subjects were approved by the institutional review board of Loma Linda University (institutional review board no. 48134). Written informed consent was obtained from all subjects.
Dietary assessments
FFQ
The AHS-2 FFQ is the largest portion of the comprehensive enrolment questionnaire which consists of 204 foods with fifty-four questions pertaining to food preparation and forty-six open-ended questions (Reference Jaceldo-Siegl, Knutsen and Sabaté16) . Frequencies are categorised into never or rarely, 1–3 times per month, 1 time per week, 2–4 times per week, 5–6 times per week, 1 time per d, 2–3 times per d, 4+ times per d and 6+ times per d, which were weighted 0, 0·067, 0·143, 0·429, 0·786, 1, 2·5, 4·5 and 6·5 in terms of times per d, respectively. The amount of food consumption was categorised into one standard serving size, half or less and one-and-a-half or more of a standard serving size, and weighted 1, 0·5 and 1·5, respectively(Reference Jaceldo-Siegl, Knutsen and Sabaté16).
24-h dietary recall
We used multiple 24HDR as the reference method which were obtained over the telephone and without prior announcement(Reference Jaceldo-Siegl, Knutsen and Sabaté16). Participants were sent a two-dimensional food portion visual to help estimate portion size. Each 24HDR was conducted by a trained research dietitian who asked specific details about food preparation and recipes. These 24HDR were digitally recorded and entered into the Nutrition Data System for Research (NDS-R) version 4.06 or 5.0 (The Nutrition Coordinating Center), and nutrient composition was calculated based on the NDS-R 2008 database. Quality control of the recalls was performed by a senior research dietitian who listened to randomly selected recorded interviews, verified and compared the audio data with the actual entries on the NDS-R database(Reference Jaceldo-Siegl, Knutsen and Sabaté16).
Two sets of 24HDR were obtained approximately 6 months apart; each set included one Saturday, one Sunday and one weekday, with a total of six 24HDR per participant. Using one set of the 24HDR, a synthetic week was created using the following formula: (Saturday intake + Sunday intake + 5 × weekday intake) divided by 7 d. Thus the two sets of 24HDR provided two synthetic weeks of intake data. To estimate the average food intake of each participant in each of the 24HDR, we averaged their phytosterol intake over these two approximated weeks(Reference Jaceldo-Siegl, Knutsen and Sabaté16).
Phytosterol database
The US Department of Agriculture (USDA) National Nutrient Database for Standard Reference (USDA SR) is produced by the USDA, which is the primary database source of food composition data in the USA(Reference Racette, Lin and Ma4). For the present study, we used the USDA SR 27 (August 2014) as the primary source of standard phytosterol contents of over 500 food items.
Throughout this paper, ‘plant sterols’ refers to β-sitosterol, campesterol and stigmasterol; ‘other phytosterols’ refers to Δ5 + Δ7 avenasterols, avenasterol, brassicasterol, stanols, stigmastanol, sitostanol, campestanol and other unknown sterols. ‘Total phytosterols’ refers to plant sterols and other phytosterols combined.
For unavailable foods and ingredients (n 189) in the USDA SR 27, we used the phytosterol content which were quantified by the GC method(Reference Bacchetti, Masciangelo and Bicchiega5,Reference Jimenez-Escrig, Santos-Hidalgo and Saura-Calixto8,Reference Weihrauch and Gardner11,Reference Klingberg, Winkvist and Hallmans12,Reference Phillips, Ruggio and Ashraf-Khorassani17–Reference Phillips, Ruggio and Toivo25) or GC-MS(Reference Chandra Dutta and Appelqvist26). This particular method was used to quantify phytosterol content in the USDA SR 27(27).
Our compiled phytosterol database was comprised of plant sterols, other phytosterols and total phytosterols. Phytosterol content was quantified as mg/100 g from each food item. Once we were able to identify phytosterol content in foods, we quantified phytosterol content based on the FFQ and 24HDR by matching the food ID in the compiled phytosterol database with the food ID and food description in the FFQ and 24HDR of the calibration sub-study.
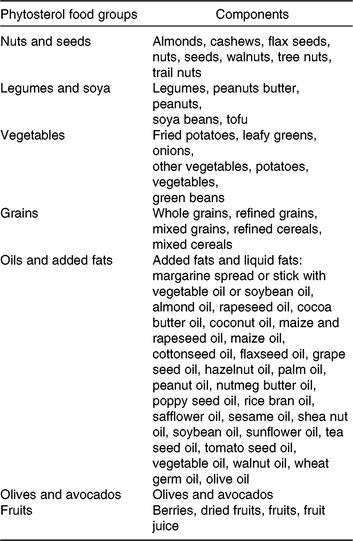
We also grouped plant foods as sources of phytosterols as follows: nuts and seeds, legumes and soya, vegetables, grains, oils and added fats, olives and avocados and fruits (Table 1).
Table 1. Phytosterol food groups and their components

Phytosterol intake
We determined the 24HDR plant sterol and other phytosterol intake of individual subjects by using the following formula: ∑ Cn × Kn where C = the reported grams of food n consumed and K = mg of phytosterol content per 100 g of food n .
Phytosterol intake estimates (mg) from the FFQ were obtained by ∑ Fn × Sn × Gn × Kn , where F = the weighted frequency of food intake n , S = weighted serving size of food consumed n , G = the standard serving size of food n and K = mg of phytosterol content per 100 g of food n .
Laboratory methods
Blood was collected from participants during clinic visits between first and second 24HDR. Blood processing followed a standard protocol(Reference Chan, Knutsen and Sabate28). Plasma was derived from blood collected in heparin tubes. Collected blood was separated into layers by centrifuge, and then aliquots of plasma were separated into straws. These sealed plasma straws were put into containers and kept in liquid N2 tanks at the temperature of –182○C(Reference Butler, Fraser and Beeson13).
One of these plasma straws from each participant was used for the determination of plant sterol and cholesterol concentration. The concentrations of β-sitosterol, campesterol and cholesterol were measured using the GLC flame ionisation detection method(Reference Lütjohann, Björkhem and Beil29). Plasma samples were sent to the Institute of Clinical Chemistry and Clinical Pharmacology, University Clinics of Bonn, Bonn, Germany for quantifying plasma sterol and cholesterol concentration.
Statistical analysis
Prior to analysis, we applied log(x + 1) to variables with zero phytosterol intake (n 8 which represent less than 1 % of the analytic sample). After transformation, the distribution of these phytosterols and other transformed variables was greatly improved and the four usual statistical assumptions (normality, homogeneity of variance, linearity and independence) were met.
All phytosterol intake levels from the FFQ and 24HDR were energy-adjusted using the residual method(Reference Willett15), in order to obtain phytosterol intake without the undue influence of total energy intake. Due to the fact that some individuals had phytosterol intake and few did not, we applied a partitioning method(Reference Jaceldo-Siegl, Fan and Sabaté30). This method allowed us to retain zero intakes and only energy adjusted the non-zero intakes. We then combined energy-adjusted non-zero intake levels with the zero intakes, thus keeping all values on the same scale.
Previous reports on the calibration sub-study showed differences in nutrient and food intake by race and no distinct patterns by sex. Therefore, we stratified by race in the analysis of this paper.
Comparison of baseline characteristics by race was done using the independent t test for continuous and chi square for categorical variables. Untransformed phytosterol intake determined from the FFQ, 24HDR and plasma were presented as arithmetic means and standard deviations.
Unadjusted Pearson correlations of the transformed energy-adjusted plant sterols, other phytosterols and total phytosterol intake between FFQ and 24HDR were first determined. De-attenuation correlation coefficient determination was then conducted to correct for within-person variation of the 24HDR prior to correlation with the FFQ.
Contingency tables (cross classification) between the FFQ and 24HDR data, stratified by race, were also produced to determine the agreement between the FFQ and 24HDR reporting methods. These provided the quantitative differences of the phytosterol intake of the two dietary measurements in a categorical manner(Reference Willett15).
Additionally, we calculated the contribution percentage of each food group to total phytosterol intake levels assessing by FFQ of the calibration sub-study participants. All analyses were done using SAS, version 9.4 (SAS Institute, Inc.)
Results
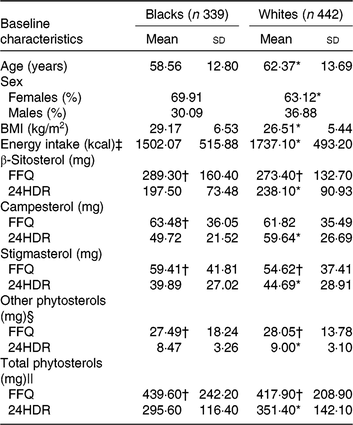
Selected characteristics of the calibration sub-study participants by race are shown in Table 2. Age, sex, BMI and energy intakes were statistically significantly different between blacks and whites. Therefore, we further conducted analysis stratified by race. In general, intake of individual plant sterols and total phytosterols was higher when assessed by FFQ than 24HDR in both races. The mean estimated intake of energy-adjusted total phytosterols was 295·6 mg/d in blacks and 351·4 mg/d in whites from six 24HDR. Using the FFQ, energy-adjusted total phytosterols was estimated to be 439·6 mg/d in blacks and 417·9 mg/d in whites.
Table 2. Subjects characteristics by race in the Adventist Health Study-2 calibration sub-study (n 781)
(Mean values and standard deviations; percentages)

24HDR, 24-h dietary recall.
* Value was significantly different from that for blacks (P < 0·05).
† Mean value was significantly different from that for 24HDR (P < 0·05).
‡ To convert energy in kcal to kJ, multiply by 4·184.
§ Sum of Δ5 + Δ7 avenasterol, avenasterol, brassicasterol, stanols, stigmastanol, sitostanol, campestanol and unknown.
|| Sum of β-sitosterol, campesterol, stigmasterol and other phytosterols.
Mean plasma concentrations of β-sitosterol and campesterol in blacks were higher than whites (Table 3). However, statistically significant differences by race were seen only for β-sitosterol and campesterol. The correlations between plasma sterols v. FFQ and 24HDR were 0·02–0·09 and not statistically significant (results not shown).
Table 3. Average concentration of plasma sterols by race
(Mean values and standard deviations)

* Mean value was significantly different from that for blacks (P < 0·05).
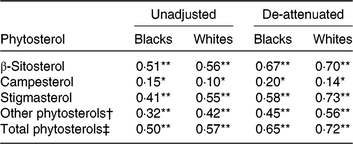
Unadjusted Pearson correlations between energy-adjusted phytosterol intake in FFQ and 24HDR (Table 4) showed poor to moderate associations (r 0·15–0·51 in blacks and 0·10–0·57 in whites). Overall, de-attenuation improved the correlations of all plant sterol groups in both blacks and whites; however, de-attenuated correlations remained poor for campesterol. All correlations between energy-adjusted phytosterol intake in the FFQ and 24HDR were statistically significant (P < 0·05). Correlations between plant sterols in plasma and plant sterol intake in FFQ or 24HDR were generally poor (below 0·07).
Table 4. Pearson correlations between energy-adjusted phytosterol intake in FFQ and 24-h dietary recall (24HDR) of the Adventist Health Study-2 calibration sub-study by race

Significant correlation between FFQ and 24HDR: * P < 0·05, ** P < 0·0001.
† Sum of Δ5 + Δ7 avenasterol, avenasterol, brassicasterol, stanols, stigmastanol, sitostanol, campestanol and unknown.
‡ Sum of β-sitosterol, campesterol, stigmasterol and other phytosterols.
Compared with blacks, whites had higher percentages of exact agreements in all types of named plant sterols but slightly lower in other phytosterols (Table 5). The proportion of exact agreements ranged 27·4–38·6 % in blacks and 30·8–42·3 % in whites. Gross misclassification in blacks was higher than whites, which ranged 4·2–9·7 % in blacks and 1·6–11·3 % in whites. Overall, total phytosterols had the highest percentage of exact agreement and the lowest gross misclassification in both blacks and whites.
Table 5. Agreement (%) between the categorisation of energy-adjusted phytosterol intake estimated from FFQ and 24-h dietary recall by race in the Adventist Health Study-2 calibration sub-study participants

GM, gross misclassification.
* Disagreement by three quartiles.
† Sum of Δ5 + Δ7 avenasterol, avenasterol, brassicasterol, stanols, stigmastanol, sitostanol, campestanol and unknown.
‡ Sum of β-sitosterol, campesterol, stigmasterol and other phytosterols.
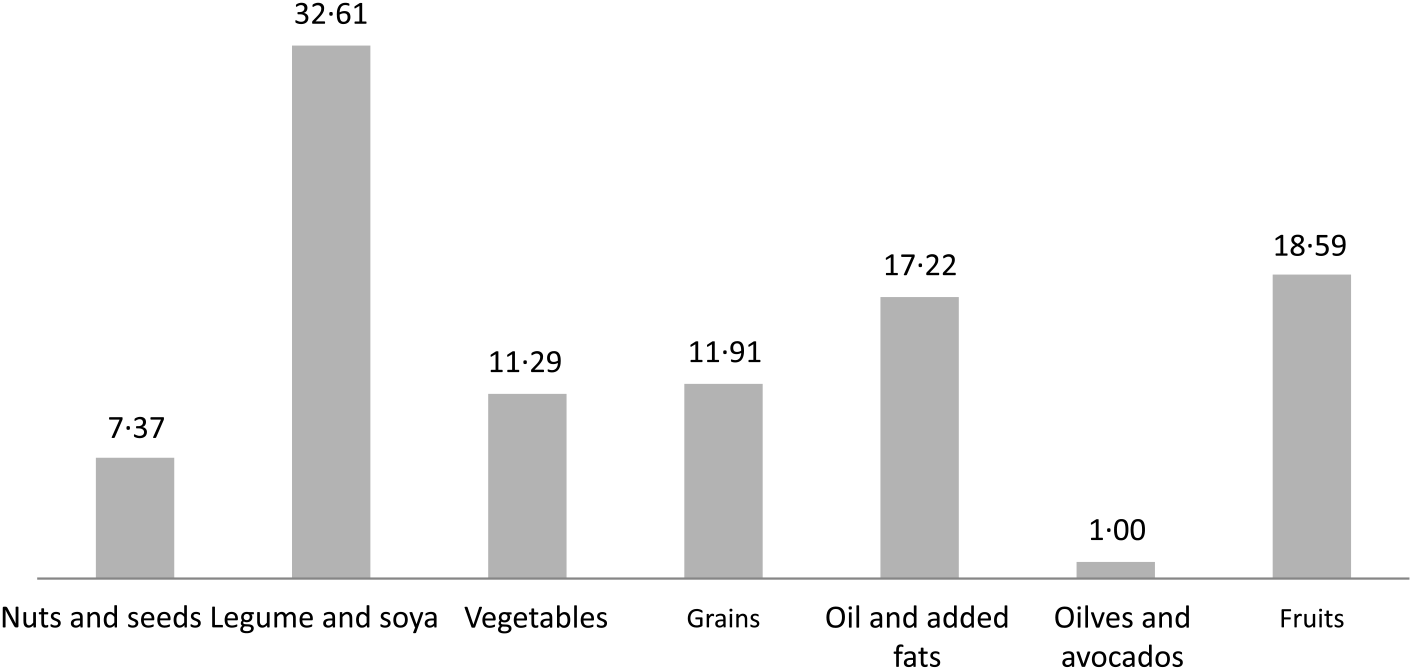
The contribution to total phytosterols by food groups is shown in Fig. 1. On assessment by FFQ, the legumes and soya food group also contributed the greatest proportion (32·61 %), followed by fruits (18·59 %) and fat (17·22 %), and the olives and avocados food group also contributed the least (1·00 %) to total phytosterols.

Fig. 1. Percentage contribution to total phytosterol intake by food group from FFQ in the Adventist Health Study-2 calibration sub-study.
Discussion
Our assessment of the performance of the FFQ in estimating plant sterol intake showed moderate to high correlations when compared with 24HDR for β-sitosterol, stigmasterol, other phytosterols and total phytosterols. The correlations that we found on phytosterol consumption are consistent with the previous validation study for a range of nutrients in our and other cohorts(Reference Jaceldo-Siegl, Knutsen and Sabaté16,Reference Midthune, Schatzkin and Subar31) .
The average mean intake of phytosterols from the FFQ was higher than in the 24HDR. It is possible that the FFQ overestimated intake because our FFQ asked about the consumption of over 200 food items which facilitated our study to capture more phytosterol-containing foods than actual intake by the 24HDR. In general, correlations and agreement between the FFQ and 24HDR were higher among whites than blacks.
To our knowledge, only one other group, from Northern Sweden, validated plant sterol intake from an FFQ (with eighty-four food items) with 24HDR (ten recalls) as a reference(Reference Klingberg, Winkvist and Hallmans12). In the Northern Sweden study, both crude and de-attenuated correlations were somewhat lower than what we found in AHS-2. In both the Northern Sweden and AHS-2 cohorts, correlations improved after de-attenuation. These findings suggest that both within-person error and energy-adjustment are important components to consider when estimating phytosterol intake.
We note that the definition of ‘total phytosterols’ by Klingberg et al. (Reference Klingberg, Winkvist and Hallmans12) is different from our study. For Klingberg et al. (Reference Klingberg, Winkvist and Hallmans12), the total phytosterol category was comprised of five different types of phytosterols, whereas in the AHS-2 calibration sub-study the total included eleven types of phytosterols. The updated comprehensive phytosterol database we compiled in the AHS-2 partly explains the higher estimates observed in our study compared with the Northern Sweden cohort. The relatively higher intake of phytosterols in the AHS-2 also may be driven by the fact that 52 % of the AHS-2 cohort are vegetarian (28·9 % lacto-ovo vegetarian, 9·8 % pesco vegetarian, 7·6 % vegan and 5·5 % semi vegetarian)(Reference Orlich, Singh and Sabaté32). Moreover, the wide range of phytosterol intake is a possible reason for the moderately higher correlations in our validation study, which will be beneficial for future disease-related hypothesis testing.
We have previously demonstrated the AHS-2 FFQ’s ability to discriminate intake of food among individual, particularly foods that contribute to total phytosterol consumption. These food groups included nuts and seeds, legumes and soya, vegetables, grains, oils and added fats, olives and avocado and fruits. Because of this, we examined if the phytosterol concentration in plasma would reflect the wide range of phytosterol intake in our population. We found as others have that correlations of plasma sterol levels with phytosterol intake from either the FFQ or the 24HDR were poor and not significant. These results confirmed that plasma sterol is not an ideal biomarker of phytosterol intake(Reference Plat and Mensink33). Phytosterol absorption is less than 2 %, whereas cholesterol absorption is up to 60 %(Reference Rozner and Garti34). The poor absorption of phytosterols is due to its poor substrate for acetyl-CoA acetyltransferase 2 which prevents plant sterols to be packaged into chylomicrons for further circulation throughout the body(Reference Jakulj, Mohammed and van Dijk35). Phytosterols are returned from the intestinal cells back to gut lumen via the ATP-binding cassette transporters(Reference Trautwein and Demonty36). In a study that examine the metabolism of β-sitosterol and cholesterol in men, Salen et al. further report that cholesterol absorption is inversely correlated with faecal β-sitosterol(Reference Salen, Ahrens and Grundy37). Therefore, phytosterol levels in faecal samples could be explored as a possible biomarker of phytosterol intake.
The main contributing food group to total phytosterol intake in both the British diet (46·96 %)(Reference Morton, Lee and Buss7) and the Spanish diet (39·3 %)(Reference Jimenez-Escrig, Santos-Hidalgo and Saura-Calixto8) was the oils food group, whereas in the AHS-2 it was the legumes and soya food group (32·61 %). The proportion of the population following a British diet who consumed plant sterols from added fats (18·32 %) was slightly higher when compared with those in the AHS-2 cohort sub-study (17·22 %).
Phytosterol intake from the fruit food group in the present study, particularly as measured by the FFQ (18·59 %), was greater than in the British diet (12·7 %)(Reference Morton, Lee and Buss7). The AHS-2 cohort also had a greater proportion of phytosterol intake from the nuts and seeds food group (7·37 %) when compared with the British diet (1·35 %)(Reference Morton, Lee and Buss7) and the Spanish diet (2·4 %)(Reference Jimenez-Escrig, Santos-Hidalgo and Saura-Calixto8).
We recognise that our present study has limitations. Lower estimates of the plant sterol intake are greatly influenced by the quality of the database of plant sterol content in foods. We have minimised this effect by compiling the phytosterol content in foods from several sources. The first is the USDA SR 27, for phytosterol content in approximately 115 food items, and from other references(Reference Bacchetti, Masciangelo and Bicchiega5,Reference Jimenez-Escrig, Santos-Hidalgo and Saura-Calixto8,Reference Weihrauch and Gardner11,Reference Klingberg, Winkvist and Hallmans12,Reference Phillips, Ruggio and Ashraf-Khorassani17–Reference Chandra Dutta and Appelqvist26) , for phytosterol content in approximately 189 food items. In addition to deriving phytosterol content from multiple sources, we calculated de-attenuated correlation coefficients which removed the ‘noise’ of within-person error from 24HDR, and also minimised the influence of total energy intake by using energy-adjusted intake.
Conclusion
The AHS-2 FFQ is a suitable measurement tool for estimating phytosterol intake in the AHS-2 cohort and may be used to relate intake levels to disease outcomes. Regression calibration will be a necessary step for future studies relating phytosterol intake with an outcome to minimise measurement error in the exposure.
Acknowledgements
Cohort maintenance was supported by National Institutes of Health/National Cancer Institute grant no. U01CA152939. The phytosterol project was funded by Unilever Research & Development, Vlaardingen, The Netherlands. The funding agency had no role in the design, analysis or writing of this article.
K. J.-S. designed the research; G. E. F. was the principal investigator of the AHS-2; R. S., A. M. and E. H. generated the phytosterol database; R. S. and A. M. performed statistical analysis; R. S., K. J.-S., G. E. F., C. H. and Y. T.-B. interpreted the results; R. S. wrote the initial draft of the paper; K. J.-S., G. E. F., Y. T.-B. and C. H. critically reviewed and edited the manuscript; R. S. had the primary responsibility for the final content. All authors read and approved the final manuscript. K. J. S. obtained funding from Unilever Research & Development for this project.
None of the authors has conflicts of interest.


