INTRODUCTION
The morbidity and mortality from electrical injury for the pediatric population in Canada were last reported for the years 1991-1996 by Nguyen and colleagues.Reference Nguyen, MacKay, Bailey and Klassen 1 Although death and injury due to electrical injuries are rarely reported in this population, most injuries took place in the homeReference Arasli Yilmaz, Köksal and Özdemir 2 - Reference Garcia, Smith, Cohen and Fernandez 4 and were precipitated by oral contact with electrical cords and contact with wall sockets and faulty electrical equipment.Reference Garcia, Smith, Cohen and Fernandez 4 , Reference Baker and Chiaviello 5 Low-voltage injuries were most common in the 0-9 year age group, and high-voltage injuries were more commonly seen in adolescents.Reference Garcia, Smith, Cohen and Fernandez 4 , Reference Çelik, Ergün and Özok 6 Many of these patients were admitted for observation,Reference Garcia, Smith, Cohen and Fernandez 4 and those who required prolonged admission were more likely to have high-voltage injuries, requiring excision, grafting, and amputation.Reference Çelik, Ergün and Özok 6 Glatstein et al. reported data from a large pediatric tertiary care centre in Canada and found a higher admission rate for patients with burns resulting from an electrical injury, as compared with the admission rate for burns in general (13% v. 3%-9%, respectively), suggesting a higher rate of vigilance is necessitated for electrical injuries because of concerns about complications.Reference Glatstein, Ayalon, Miller and Scolnik 7
The purpose of this study was to describe electrical injury trends using data from the Canadian Hospitals Injury Reporting and Prevention Program (CHIRPP) from 1997 to 2010.
METHODS
Data on all emergency department (ED) visits for children aged 0-19 years related to an electrical injury for the years 1997-2015 were requested from CHIRPP. Because of incomplete or missing data after 2010, the dataset was truncated to ensure appropriate comparisons from year to year. CHIRPP is an injury and poisoning surveillance system that collects and analyzes injuries to people who are seen in the EDs of 11 pediatric hospitals and six general hospitals in Canada. Patients’ accounts of pre-event injury circumstances are collected using a questionnaire that is completed during their visit to the ED.Reference Crain, McFaull and Thompson 8 An attending physician or other staff adds clinical data to the form, and data coders abstract data from the patients’ narratives.Reference Crain, McFaull and Thompson 8 The data were de-identified and collected anonymously.
Electrical injury cases were extracted by the data and research manager of the Injury Section, Health Surveillance and Epidemiology Division, Centre for Chronic Disease Prevention and Control in Ottawa. Any records in which any of the three “Nature of Injury Variables” were coded as “electrical injury” were extracted. Additional records with the following keywords, but not containing the “Nature of Injury” variable “electrical injury,” were also extracted: plug, socket, outlet, shock, electric (and its variations), current, volt, and spark. Variables extracted for comparison included age, sex, year of injury, setting, injury circumstance, and disposition. Admission to the hospital was used as a surrogate measure of injury severity based on a previous study using this approach.Reference Nguyen, MacKay, Bailey and Klassen 1 The total number of encounters per year for all injuries, by age group, was also extracted from the CHIRPP database to provide denominators for estimating electrical injury rates.
The patient narratives for each case in the dataset were hand searched by a separate duplicate reviewer to find any cases that did not appear to have an electrical injury (i.e., cases erroneously included). We also searched for the source of current, voltage (low voltage ≤1000 volts v. high voltage ≥1000 volts), indications of death before or after arrival to the hospital, and details surrounding the circumstances and intentions of the injuries.
Simple summaries of the database variables are shown as frequencies for categorical variables and means with standard deviations for continuous variables. Variables were tested against admission rates using Fisher’s exact test, and changes in rates over time were tested using simple linear regression for annual changes and chi-square tests for seasonal effects. Statistics calculated for fewer than five cases are not reported. All analyses were performed using R version 3.2.2.
RESULTS
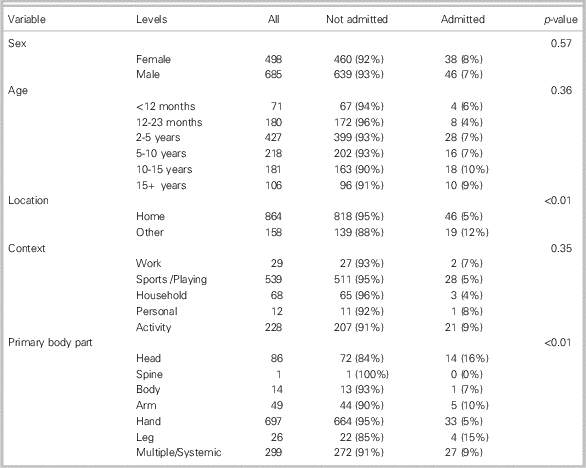
Based on a hand-search of the patient narrative, we excluded two non-electrical injury cases from the dataset that were erroneously included. Table 1 summarizes the data and compares patient variables with admission rates. Overall, there were 1183 electrical injuries over 13 years of data, with 84 resulting in admission to hospital (7%, 95% CI 6%-9%). Males (n=685) experienced slightly more electrical injuries than females (n=498), and events were most likely to take place in the home (n=864), though events that occurred outside the home were more likely to result in admission (p<0.01). The majority of events affected the hands, and systemic injuries were also common. Head injuries, leg injuries, and systemic injuries were more likely to lead to hospital admission than other injuries (p<0.01).
Table 1 Age, context of electrical injury, and affected body area by admission status
Injuries due to lightning strikes were rare (n=19) and mostly because of indirect contact with lightning (n=15), e.g., lightning hitting the house while touching a doorframe.
Excluding indirect lightning strikes, a total of 14 high-voltage injuries (≥1000 volts) were identified. All but one event took place outside the home. Males (n=11) experienced the majority of high-voltage injuries, and most patients were admitted to the hospital (n=9). The high-voltage patients had an average age of 10.2 years (SD 4.8), compared to 6.1 years (SD 5.1) for non-high voltage patients, a statistically significant difference (p<0.01).
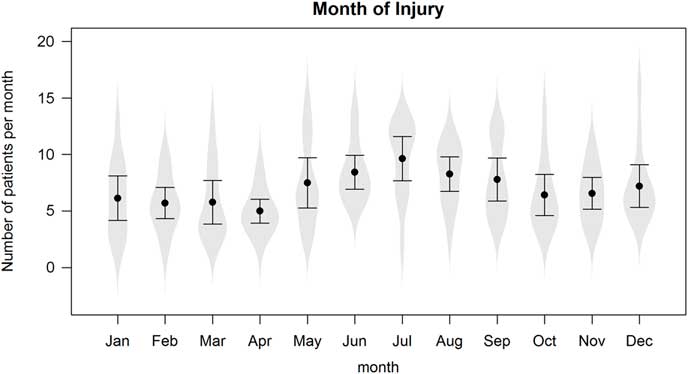
Figures 1a and 1b present the electrical injury rates over time, both annually and seasonally, respectively. There has been a decrease in the number of electrical injuries per year (p<0.01), both in terms of raw counts and relative to the number of injuries reported in the CHIRPP database. There was also a surge in electrical injuries during the summer months, as analyzed using a linear regression model that controlled for annual effects (p<0.01).
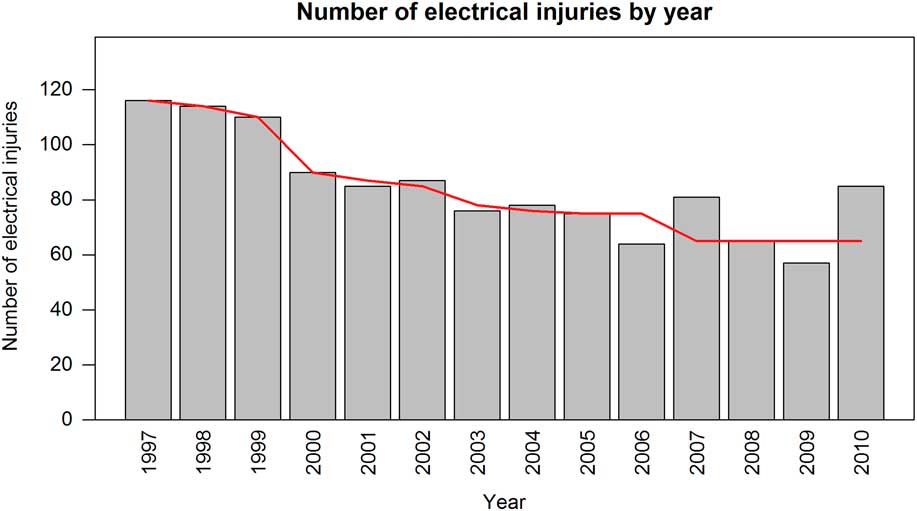
Figure 1a Annual number of electrical injuries per 100,000 ER visits, 1997-2010.
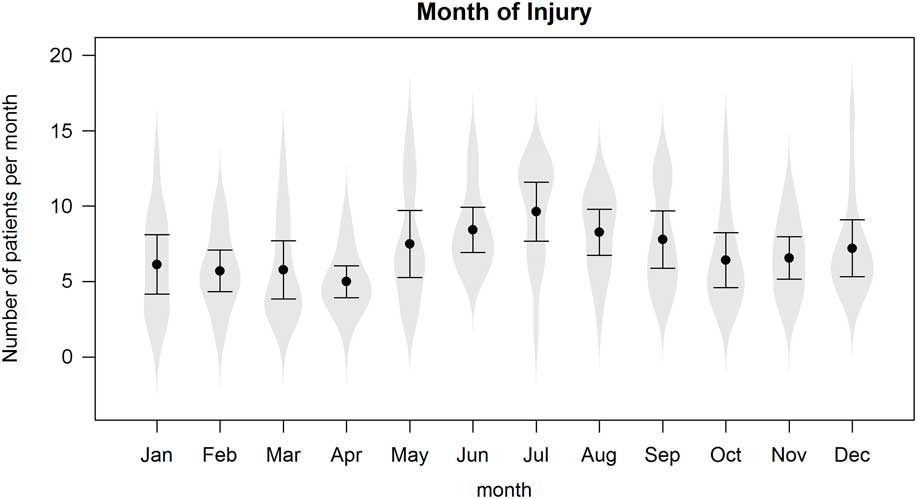
Figure 1b Total number of electrical injuries per month, 1997-2010.
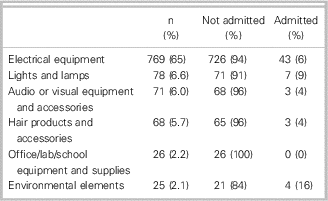
Table 2 presents a summary of the recorded causes of injury, including overall cases and by admission status. The cause of injury is characterized as a category. A patient can have multiple causes of injury (for example, both “Electrical equipment” and “Lights and Lamps” can be a cause of injury if a child plugged in a lamp and received a shock). Table 2 lists whether a cause was indicated in a record, so the entries in the table are not mutually exclusive. Forty-six percent of injuries involved electrical outlets, but 65% of injuries involved some sort of electrical equipment. There was no pattern of admission associated with cause, and the sample sizes were too small to test any effect reliably.
Table 2 Causes of injury by category for n≥25
The most common objects inserted into electrical outlets and receptacles included keys (n=167), hair clips and hairpins (n=56), fingers (n=44), and paperclips (n=20).
Only two of the 1183 cases were because of intentional self-harm (suicide attempt); one electrical injury was a result of mistreatment by a parent/caregiver, and another resulted from interaction with law enforcement (tasered by police). No prehospital or ED deaths were recorded in the database; for one case, the disposition was recorded as a cardiac arrest resulting from electrical injury with direct admission to the intensive care unit (ICU).
DISCUSSION
We have updated the incidence, causes, and outcomes of electrical and lightning-related injuries in children and youth who presented to Canadian EDs that participate in CHIRPP.
As previously reported by Nguyen and colleagues, the majority of injuries in our study occurred in the patient’s home (73% compared with 77% found by Nguyen et al.) and most commonly involved electrical outlets or receptacles (46% v. 42%, respectively).Reference Nguyen, MacKay, Bailey and Klassen 1 Lightning strike injuries were rare and mostly because of an indirect electrical injury. The predominance of low-voltage injury occurring in the home is consistent with the results of other studies.Reference Arasli Yilmaz, Köksal and Özdemir 2 , Reference Garcia, Smith, Cohen and Fernandez 4 , Reference Çelik, Ergün and Özok 6 , Reference Glatstein, Ayalon, Miller and Scolnik 7 Our findings are in contrast to American and Turkish studies that reported higher rates of injury from contact with live electrical cords.Reference Arasli Yilmaz, Köksal and Özdemir 2 , Reference Baker and Chiaviello 5 , Reference Çelik, Ergün and Özok 6 , Reference Rabban, Blair, Rosen, Adler and Sheridan 9 Cord biting appears to be more common in the United States; however, these studies were performed more than 20 years ago, thus limiting a direct comparison.Reference Baker and Chiaviello 5 , Reference Rabban, Blair, Rosen, Adler and Sheridan 9 The types of foreign objects placed in wall sockets are similar to our findings, including keys, pins, fingers, and paperclips.Reference Baker and Chiaviello 5
The male to female ratio for overall electrical injuries was much higher in previous studies with males accounting for up to 83% of electrical injuries.Reference Nguyen, MacKay, Bailey and Klassen 1 , Reference Arasli Yilmaz, Köksal and Özdemir 2 , Reference Çelik, Ergün and Özok 6 , Reference Glatstein, Ayalon, Miller and Scolnik 7 However, the high-voltage injuries identified in this study indicate male-dominated injury patterns as described previously.Reference Arasli Yilmaz, Köksal and Özdemir 2 , Reference Çelik, Ergün and Özok 6 , Reference Rabban, Blair, Rosen, Adler and Sheridan 9 Similar to the findings in this study, Rabban et al. found an equal sex distribution in low-voltage injuries but a higher percentage of males sustained high-voltage injuries.Reference Rabban, Blair, Rosen, Adler and Sheridan 9 The severity of injuries in our study appears to be low based on hospital admission (7%), which was less than that reported by Nguyen et al. (13%) and other reported admission rates.Reference Nguyen, MacKay, Bailey and Klassen 1 , Reference Garcia, Smith, Cohen and Fernandez 4 , Reference Glatstein, Ayalon, Miller and Scolnik 7 Surges in electrical injuries during the summer months have also been previously reported.Reference Nguyen, MacKay, Bailey and Klassen 1 , Reference Dokov 10
A recent Cochrane review found that safety interventions delivered at home by health or social care professionals were effective in increasing the proportion of families with socket covers on unused outlets.Reference Kendrick, Young and Mason-Jones 18 Interventions providing free, low cost, or discounted safety equipment such as socket covers appeared to be more effective in improving safety practices.Reference Kendrick, Young and Mason-Jones 18 There is evidence that multifaceted parenting interventions provided to families at risk in the home during the first 2 years of a child’s life are effective in reducing self-reported or medically attended injury among young children, along with improving home safety.Reference Kendrick, Mulvaney and Ye 19 We were not able to stratify our data by socioeconomic status, but this may be an important factor to consider in injury prevention. Previous risk factors identified for childhood injury and death include the socioeconomic status of the parents and younger parental age.Reference Hong, Lee, Ha and Park 20 Home safety hazards are strongly correlated with low income, a lower education level, and unemployment.Reference Turner, Spallek and Najman 21
Overall, the annual number of electrical injuries in children and youth presenting to Canadian EDs participating in CHIRPP has decreased. With most electrical injuries still occurring at home, often involving the insertion of objects into electrical outlets, future injury prevention strategies should target these areas.
LIMITATIONS
Our study has several limitations worth noting. The first is its use of retrospectively coded data with the unavailability of complete data after 2010. Data extraction was performed by a single data extractor and reviewed by a separate reviewer to ensure that included cases were appropriate. We were unable to review whether cases not included in the dataset were erroneously excluded. Therefore, it is possible that some cases were missed. CHIRPP has been validated in terms of its data quality and is thought to be useful for developing injury prevention programs; however, its representation of general youth injury patterns in Canada is controversial.Reference Pickett, Brison and Mackenzie 11 - Reference Macarthur and Pless 15 As the majority of CHIRPP data comes from hospitals in cities, injuries involving some populations are underrepresented, namely older teenagers, First Nation and Inuit people, and other people who live in rural and remote areas. Fatal injuries are also underrepresented because EDs do not capture data on people who died before they could be taken to the hospital. 16 No deaths were captured in our dataset; therefore, we are unable to comment on the epidemiology of electrical deaths, including lightning, in children presenting to Canadian EDs that participate in CHIRPP. The database does not code for high- or low-voltage injuries, so we had to extract this information from patient narratives. Injuries were also missed if patients refused to complete the data collection forms.Reference Mackenzie and Pless 13 Others have indicated that patients with injuries who presented overnight were more likely to be missed.Reference Macarthur and Pless 15 The degree to which CHIRPP captures severely injured children is controversial.Reference Macarthur and Pless 15 , Reference Macarthur and Pless 17
CONCLUSION
While injuries caused by electricity are relatively rare in the pediatric population, their consequences may be severe. Research and educational measures should continue to focus on primary prevention.
Acknowledgements
Data used in this publication are from the Canadian Hospitals Injury Reporting and Prevention Program (CHIRPP) and are used with the permission of the Public Health Agency of Canada (PHAC). Thanks to Jennifer Crain of PHAC for creating the dataset. The analyses and interpretations presented in this work do not necessarily reflect the opinions of the federal government. This research did not receive grant funding from any funding agency, commercial entity, or not-for-profit organization.
Competing interests: None to declare.

