1. INTRODUCTION
The analysis of the long-term evolution of human stature has been widely used in economic history literature in order to measure changes in biological welfare in different countriesFootnote 1. Human height has become an important indicator for studying human well-being given that stature reflects levels of nutrition and health in childhood and adolescence, and the environment and socio-economic conditions of the region of upbringingFootnote 2. Thus, adult height is a reliable measure of well-being because of reflecting genetic factors and it also sheds light on individuals' living conditions.
Anthropometric research has recently taken an interest in analysing height trends and the long-term relationship between human adult stature and socio-economic and demographic factorsFootnote 3. Identifying the determinants of adult stature is important in order to comprehend achievements made in welfare, health, living standards and, in general, the quality of life of the population of a country or a region.
Understanding these relationships is essential, especially for Latin American countries, which have experienced important improvements in their levels of well-being during the 20th century but are still lagging behind other countries in terms of economic growth and living standards, as concluded by Salvatore et al. (Reference Salvatore, Coatsworth and Challú2010) in a collective work that analyses the living standards of eight countries in the regionFootnote 4.
In the case of Colombia, well-being also improved significantly during the 20th century with progress being made in income per capita, education and health (Jaramillo-Echeverri et al., Reference Jaramillo-Echeverri, Meisel-Roca and Ramírez-Giraldo2018). Important advances were also observed in the population's biological welfare as the anthropometric literature in Colombia has shown (Meisel and Vega Reference Meisel and Vega2007a,Reference Meisel and Vegab). Anthropometric studies in Colombia have benefited from the development of a well-organised citizen identification system since the early 20th century: the national identification card, which contains information on adult height, as did passports and judicial certificates. Thus, the country stands out for its abundant availability of good quality anthropometric information since the beginning of the 20th century.
The first study of the evolution of the stature of Colombians dates from 1992. Ordoñez and Polania (Reference Ordoñez and Polania1992), based on height information of 14,103 individuals obtained from the national identification card, found that between 1920 and 1970 the average height of women increased by 8.7 centimetres (cm) and that of men by 7.0 cm. Meisel and Vega (Reference Meisel and Vega2007b) examine the stature of Colombians using a large number of observations from national identification cards and passport records. From the identification cards, the authors obtained height information for more than 9 million individuals born between 1905 and 1985. They found a sustained increase of around 9 cm for both men and women born during these years. However, individuals from the upper classes (about 16,000 observations), who had passports, were much taller than average but their stature remained stable for cohorts born between 1870 and 1919. Meisel and Vega (Reference Meisel and Vega2007a) extend the previous analyses by examining the geographical variation of height during the 1910–1985 period. They found that Colombia experienced significant regional convergence in average height; meaning that those departments which were the tallest in 1910 grew more slowly during the 1910–1985 period than those that were the shortest. Acosta and Meisel (Reference Acosta and Meisel2013) show that the average height of ethnic groups, other than Afro-Colombians and the indigenous population, had the highest growth rateFootnote 5. This may be due to the fact that these groups inhabited regions that benefited more from governmental institutional developments.
The present paper aims to deal with potential differences in adult height associated with certain socio-economic and demographic characteristics of Colombians during the 20th century. Colombia is an interesting case study given that the first half of the 20th century was a period of rapid economic growth, which led to substantial gains in living standards, especially in education and life expectancy, achieving rapid convergence with international standards.
Specifically, we contribute to the Colombian anthropometric literature by econometrically estimating the determinants of the height of women and men, using a database rich in socio-economic and demographic information, which includes 225,805 individuals born between 1920 and 1990, covering all the country's regions. Previous research about Colombia does not include a comprehensive analysis of the determinants of height for such a long period. In particular, we focus on the effect of education, age, gender, occupation, size of the municipality of the individual's birthplace, the diseases environment (gastrointestinal diseases, respiratory diseases and puerperal diseases) and access to public services on height. Additionally, we explore inequality and spatial dispersion of stature between the country's regions.
Our hypothesis is that the advances made during the 20th century in health, education and the expansion of public goods provision, especially sanitary conditions, increased well-being in Colombia, which should be reflected in anthropometric measures. Previous studies have found evidence of regional convergence in social variables in Colombia (Meisel and Vega Reference Meisel and Vega2007b; Royuela and Garcia Reference Royuela and García2015); we therefore expect to find a reduction in the dispersion of height at the departmental level.
The source of our database is the judicial background certificate, which was issued by the former Administrative Security Department of Colombia (DAS) during the 20th centuryFootnote 6. This data source has not as yet been used for academic purposes. Our database is an important contribution to anthropometric literature due to its degree of demographic representativeness, the lack of self-reported height measures, its non-truncated nature and its comprehensive information on the socio-economic aspects of the individualsFootnote 7.
The econometric results show that, in Colombia, height is determined by socio-economic and demographic variables. In particular, we find important differences in stature according to gender, level of education, occupation, health conditions, access to public services and place and date of birth. That is, improvements in socio-economic and demographic variables led to an increase in the well-being of the population, which is reflected in a steady increase in the stature of both men and women. Moreover, the results indicate that inequality in stature across departments decreased considerably throughout the century. We find an inverse relationship between departmental height growth rate and initial average height, indicating that departmental disparities in biological well-being were reduced throughout the 20th century.
The rest of the paper is organised as follows: in the next section, we present a historiographical review of the socio-economic determinants of height. Section 3 describes the data source and methodology. Section 4 presents the secular trends and biological inequalities and discusses the econometric results. Finally, our conclusions are presented in the last section.
2. SOCIO-ECONOMIC DETERMINANTS OF HEIGHT: A HISTORIOGRAPHICAL REVIEW
Anthropometric literature has been interested in analysing the effects of socio-economic variables on biological well-being indicators such as heightFootnote 8. Research carried out in several countries has found causal effects of socio-economic variables on adult height. The sources and the size of the anthropometric samples found in the literature vary greatly.
In a pioneering work for Great Britain, Floud et al. (Reference Floud, Watcher and Gregory1990) examine the variations in stature of lower-class boys recruited by the Marine Society of London between 1770 and 1870, and that of men recruited between 1740 and 1914 by the Royal Marines and the British Army. They also compare the stature of the lower-class boys from the Marine Society with the height of the upper-class recruits from the Royal Military Academy at Sandhurst from 1806 onward. They find that the upper-class recruits were 6 inches taller than the 14-year-old lower-class boys. This result reflects the high degree of inequality and significant socio-economic differences that existed in Britain at the beginning of the 19th century. The authors also find remarkable differences in stature by region of residence. Men who resided in the north of England and Scotland were almost 1.5 cm taller than men who lived in London and the southwest of England, and men from urban areas were shorter than men from rural areas, reflecting the urban penalty.
More recently, Huang et al. (Reference Huang, Van Poppel and Lumey2015) explored the differences in height by socio-economic status among 371,105 Dutch military conscripts born between 1944 and 1947. The results indicate large differences in individuals' statures by education level and their parents' occupations. Similarly, Schoch et al. (Reference Schoch, Staub and Pfister2012) analyse the height of Swiss conscripts recruited during the years 1875–1950 and its relationship with social inequality. The authors find that social-class affiliation was the most important determinant of differences in the biological standard of living. For the case of Hungary, Gyenis, and Joubert (Reference Gyenis and Joubert2004) investigate the relationship between socio-economic factors and height, weight and body mass index of Hungarian first-year university students and military conscripts enrolled from 1933 to 1998. These authors find important differences in height according to parental occupation, educational level, family composition and place of birth and residence.
Ayuda and Puche-Gil (Reference Ayuda and Puche-Gil2014) study the determinants of stature in Mediterranean Spain's male population born between 1859 and 1967. The authors use height information for 82,039 conscripts in the Valencian region, finding that literate conscripts were almost 1 cm taller than illiterate ones and agricultural workers were shorter than highly qualified non-manual workers. For another Spanish region, the Andalusian city of Antequera, Martinez-Carrion and Camara (Reference Martínez-Carrión and Camara2015) analyse the social differentials in height among young males born between 1859 and 1879 from data collected from military enlistments. The authors find that peasants presented the lowest average height compared with other groups and, among the peasants, those that lived in the industrial periphery were shorter. Martinez-Carrion and María-Dolores (Reference Martínez-Carrión and Maria-Dolores2017) study the changes in male height and its regional convergence in Spain and Italy using information for male army recruits born between 1850 and 1980. The results indicate that in both countries, male stature presented a significant increase in the long run. Particularly in Italy, growth was more evident from the beginning of the 20th century, whereas in Spain it started in the 1950s. In both countries, a process of regional convergence was observed during the second half of the 20th century, but the authors find that Spain presents lower inequality in male height than Italy.
For the industrialisation period of the 19th century in the United States, Cuff (Reference Cuff.2005) uses height records for more than 22,000 American Civil War soldiers recruited in Pennsylvania to examine whether there were differences in soldiers' height between the different regions of the state, and relates their stature with the degree of trade existing in the soldiers' region of birth. The author finds that soldiers from more sparsely populated regions further away from economically developing areas were taller than men from populated and more economically integrated regions. This result can be explained, in part, by the rise in the price of food during the industrialisation period which made the cost of living higher in citiesFootnote 9.
To analyse the evolution of the stature of the American population in the 20th century Komlos and Baur (Reference Komlos and Baur2004) use information on 14,615 adults born in the United States from the National Health and Nutrition Examination Survey III, which was collected between 1988 and 1994. They find that the stature of male Americans had been stagnating and the height of the youngest female birth cohort (those born in the 1960s) had decreased. In addition, the height of Americans was lagging behind that of Europeans. According to the authors, this may be explained by the greater socio-economic inequality, inferior health care system and fewer social safety nets in the United States as compared with European countries, despite the fact that the United States has a higher per capita income than most Western European and Scandinavian countries.
In the case of Asia, Bassino (Reference Bassino2006) examines the effects of per capita income, health and regional inequality on the stature of Japanese at the prefecture-level between 1892 and 1941. The source is army conscript reports, which include information on the number of individuals who fell into different height intervals in the physical examination at age 20. The results suggest that there is a relationship between income, health and height across the forty-seven Japanese prefectures. Bassino et al. (Reference Bassino, Dovis and Komlos2018) analyse the relationship between year and province of birth, occupation and education, and the stature of 23,000 Filipino soldiers enlisted by the U.S. military between 1901 and 1913. Contrary to previous studies, they find that few socio-economic characteristics of the region of birth had a significant influence on individual stature. According to these authors, there was a decline in the nutrition level of the population because the new resources from the expansion of cash crop exports at the end of the 19th century were used to purchase inedible products. For India, Guntupalli and Baten (Reference Guntupalli and Baten2006) use data from the All India Anthropometric Survey to examine the evolution and inequality of heights in north, west and east India during 1915–1944. Their database has 26,154 observations of male stature. The authors find that the stature of men of India increased at an extremely slow rate during the interwar period and the Second World War due to some improvements in health conditions and the increase of rice imports that compensated the adverse nutritional effects of the reduction of food production in India as well as the declining per capita GDP. Also, during these years the authors did not find evidence of a reduction of height inequality as a result of a decline in income inequality.
For Africa, Cameron (Reference Cameron2003) investigates the consequence of post-apartheid economic and social transition on the growth and development of children in South Africa. The author uses a 10-year longitudinal study that gathers anthropometric information for 4,000 urban children. The study shows that in the post-apartheid period, the growth rate for white children continued to be higher than that of non-white children. The author concludes that child development and growth were not affected by the social and economic policies implemented in the 1990s and aimed at improving the living conditions of non-white South Africans. Kimhi (Reference Kimhi2003) analyses the socio-economic determinants of the health and physical fitness of rural families in the southern region of Ethiopia using data from 583 households surveyed in 1995. The author finds that height and wealth per capita were positively and significantly correlated with health at the village level.
For Latin America, López-Alonso (Reference López-Alonso2007) analyses the trend in adult height from different sectors of Mexican society during the 1850–1950 periodFootnote 10. To this end, the authors used data from recruitment records of the Mexican rural and federal militia to obtain information on the height trends of laboring classes, and data from passport applications to provide height information for the upper classes. This work portrays the great socio-economic inequalities in Mexico. On one hand, the average height of the lower classes stagnated during the Porfiriato regime (1876–1910), and that of soldiers born in the 1910s and 1920s declined significantly with respect to previous years, mainly because of food shortages during the years of the rebellion (1911–1917) and the urban penalty caused by the early stages of industrialisation. On the other hand, the stature of the upper classes increased, indicating that these classes benefited from industrialisation. López-Alonso and Velez-Grajales (Reference López-Alonso and Velez-Grajales2015) used a similar data source to examine the evolution of Mexican adult heights and their relation to the economic cycles, inequality, wars and institutions in the 1850–1986 period. Data for the additional years (1950–1986) was taken from the 2000 Mexican National Health Survey and the 2006 Mexican National Survey on Health and Nutrition. Results are consistent with López-Alonso (Reference López-Alonso2007) in terms of the unequal living standard patterns present among the Mexican population. In particular, people from the north and center-north regions were 7 cm taller than those from the centre and southern states. Rural men were shorter than urban men by around half a centimeter and people with no education were 2 cm shorter than those with primary education, and almost 7 cm shorter when compared with those with graduate studiesFootnote 11. Carson (Reference Carson2005) examined the height of Mexican prisoners in American penitentiaries during the late 19th century and compared their stature with U.S. born prisoners, finding similar results. His data confirms that Mexican male height tended towards stagnation at the end of the 19th century, during the early stages of industrialisation.
Salvatore (Reference Salvatore2004a) investigates height trends in northwestern Argentina during the first half of the 20th century, using Argentine army enrollment information for 18-year-old conscripts born between 1916 and 1951. The author finds that the studied region presented significant improvements in its health and nutrition as well as in stature, which converged within the region, as differences in heights became smaller over time. However, in relation to Buenos Aires, the stature of the population of the northwest did not converge, due to differences in skills, education and socio-economic status that increased over time. Salvatore (Reference Salvatore2004b) also analyses the well-being of Argentines during the first three decades of the 20th century using height information for 22,594 recruits born between 1901 and 1934 in Buenos Aires. The author finds that during the Argentine Golden Age period, years in which there was a significant increase in exports (1900–1913), net nutrition deteriorated. This author asserts that this period of fast economic growth generated health and nutrition stress for the children of the Argentine working classes, partly due to rising prices of foodstuff and the negative impact of mass immigration on real wages. Also, the authorities failed to control contagious diseases contributing to the stagnation of average height. In contrast, during the inter-war period (1918–1939), years of economic delay, nutrition and health showed steady improvement, and during World War I and the Great Depression, there were no significant changes in biological well-being. According to the author, the re-allocation of consumer expenditure and the substitution for cheaper foodstuffs may constitute two reasons that explain these results.
For Chile, Núñez and Perez (Reference Nuñez and Perez2015) perform a meta-analysis of thirty-eight studies published since 1898 that report height by age. They examine trends in stature by age of boys from 5 to 18 years old across socio-economic groups. The authors find that the average decennial increase in Chilean boys' height was 0.9 cm for boys of upper socio-economic status and 1.2–1.3 cm for boys in lower economic classes. The results are associated with the expansion, since the 1940s, of social policies aimed at improving health, nutrition and living conditions of the Chilean population. Such policies included preventive medicine programs, workers' social protection programs and the creation of the National Health Service, among other social programs.
Baten et al. (Reference Baten, Pelger and Twrdek2009) use anthropometric indicators to compare the standard of living trends in Argentina, Brazil and Peru during the 19th and early 20th centuries. In particular, for Argentina, they use height information from military archives in Buenos Aires, considering the height of nearly 7,000 men born between 1875 and 1910. For Brazil, they employ information for almost 7,000 male convicts from Rio de Janeiro city jail who were measured between 1861 and 1903. The authors also use prisoners' data for Peru, specifically of 1,139 convicts from Lima and a modest number of migrants measured between 1866 and 1909. The results show that the height of Argentines did not increase which confirms previous findings by Salvatore (Reference Salvatore2004a, Reference Salvatore2004b). In the case of Peru, heights remained at low levels. In Brazil, the average height did not increase significantly between 1810 and the 1860s. Following this period, however, it increased considerably in urban areas, when Brazil presented substantial progress in nutritional levels.
Lastly, Baltzer and Baten (Reference Baltzer and Baten2008) examine the long-run relationship between inequality, measured by the coefficient of height variation, and the degree of economic opening/closing of seven Latin American countries (Bolivia, Brazil, Dominican Republic, Colombia, Guatemala, Peru, Nicaragua). For all these countries, information on female height was taken from the Demographic and Health Surveys for birth cohorts from 1950 to 1979. They find that inequality in general tended to motivate protectionism. According to the authors, discontent with inequality may have led these countries to change their policies in favour of closing the economy.
Most of the previous articles were based on information about male recruits or prisoners, they considered very few occupations of individuals, and were limited to examining specific regions of the country under study, or a restricted period of time. The present paper contributes to the literature by using a database of 225,805 individuals that covers the entirety of the Colombian territory for almost a century. It contains anthropometric information on both women and men and includes several occupations. Our database is not biased (due to the lack of self-reported height measures) or truncated.
This is the first study of socio-economic and demographic determinants of height in Colombian literature that includes variables other than wealth. In particular, we have information on occupation, education, age, gender, disease environment, access to public services and the size of the municipality of birth. This information allows us to examine potential differences in adult height and to explore inequality and the spatial convergence of stature between regions.
3. DATA AND METHODOLOGY
3.1 Data Description
Our main data sources are the judicial background certificates issued by the former DAS. The certificates are now kept in the General National Archive, which contains more than ten million judicial certificates issued during the 20th century throughout the Colombian territory. The certificates are stored in 25,223 boxes, and all the certificates in a box are from the same departmentFootnote 12. The digitalised packages were chosen by stratified random sampling, where the strata were the departmentsFootnote 13. Stratified random sampling allows for a very high degree of social representativeness. Height measures in the certificates are not self-reported and non-truncatedFootnote 14. The height reported on the judicial background certificates corresponds to the height registered on the national identity cardFootnote 15.
The final sample consists of 225,805 individuals, of whom 42.5 per cent are women (95,884) and 57.5 per cent are men (129,921) with a national identification card born between 1921 and 1990 throughout the country (Table 1)Footnote 16. The region with the highest number of certificates was the Andean region, followed by the Caribbean and Pacific regions (Figure 1). The Andean region was the most economically developed region in the country through the 20th century. Despite the fact that in the late 19th century the Caribbean region was a main economic driver because of its privileged location, banana exports and cattle-producing lands (Meisel, Reference Meisel2011), the Andean region benefitted greatly from the coffee export boom of the 20th century. The Andean region is characterised by the high natural fertility of its soils and by the favourable ecological conditions for coffee cultivation. Between 1905 and 1950, coffee accounted for more than 50 per cent of Colombian exports, reaching peaks of 80 per cent in 1923 and 1950. Colombia's industrial development has also been concentrated in the Andean region since the 1930s The weaving, brewing, cigarette, textile, clothing and food industries developed mainly in this region (Jiménez and Sideri Reference JimÉnez and Sideri1985). In the Pacific region, mining, fishing, sugar cane and other extractivist economic activities thrived (Restrepo Reference Restrepo2011). The country's main trading port was in this region. The Amazon and Orinoquía regions were populated mainly by dispersed rural communities. The Amazon region, on one side, is a mainly dense tropical forest, whereas the Orinoquía is a sparsely populated plain area. Even nowadays, these two regions are isolated due to the lack of roads and limited access to public services.
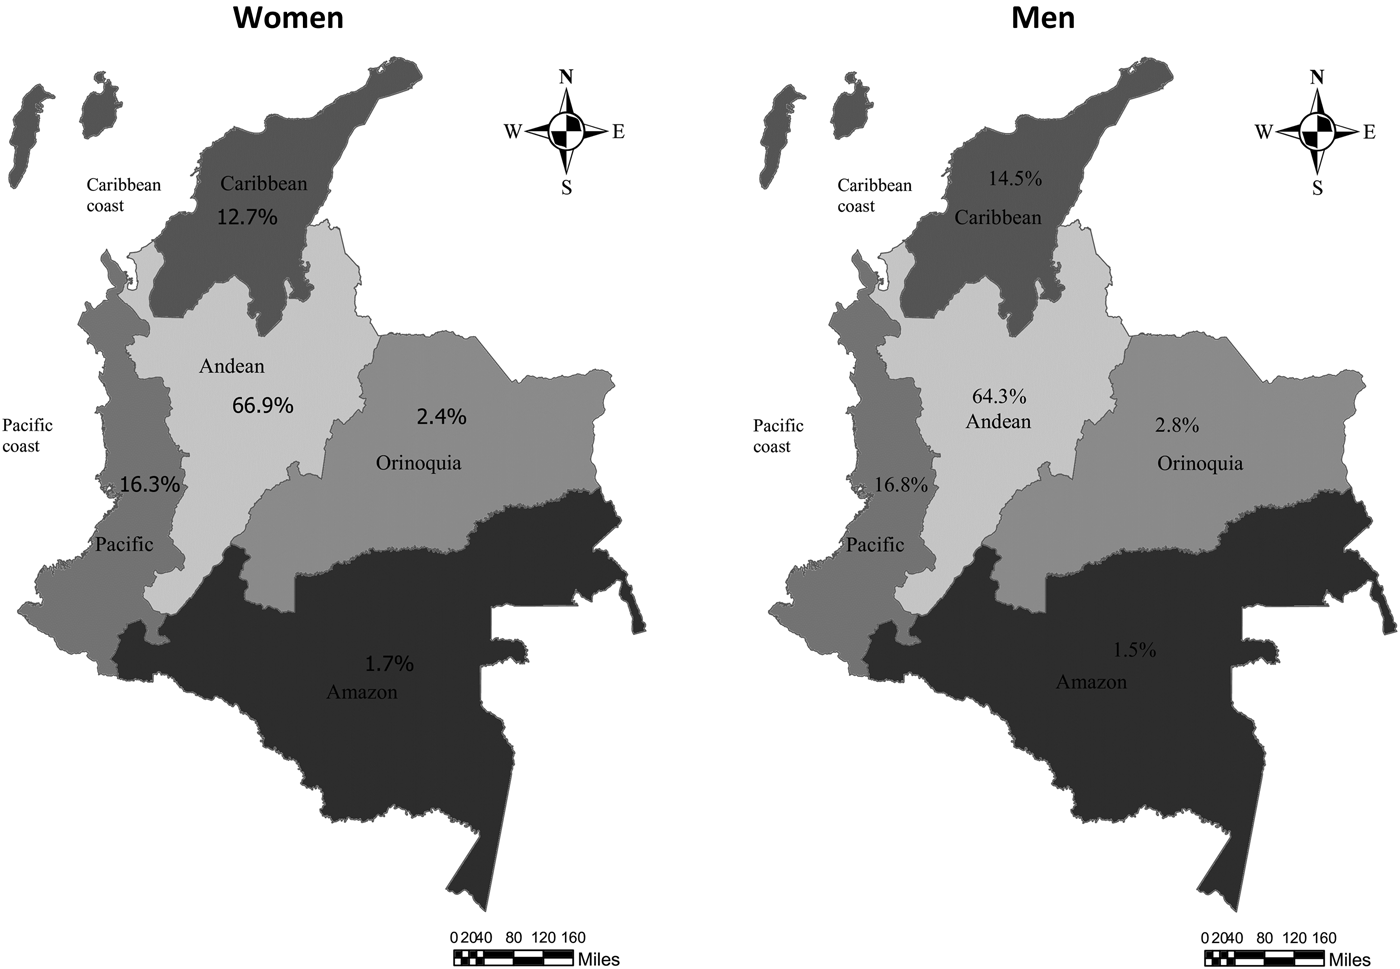
FIGURE 1 REGIONAL SAMPLE DISTRIBUTION.
TABLE 1 DATA OF THE ANTHROPOMETRIC SAMPLE
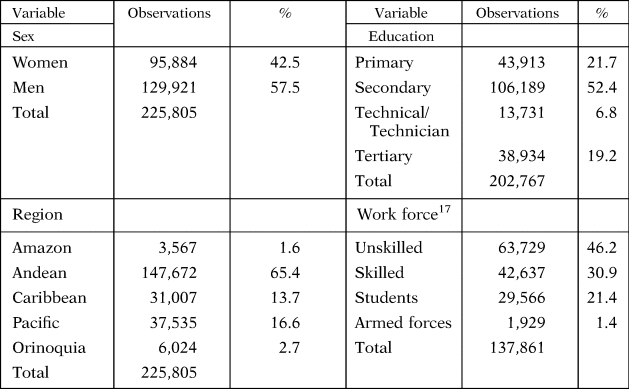
Source: Digitised certificates of judicial background issued by the former DAS.
Most of the people who obtained the judicial background certificate were students (21.4 per cent) or unskilled workers (46.2 per cent). This is consistent with the fact that most individuals in the sample had registered primary or secondary education as their highest level of education. Less than 20 per cent had attended tertiary education.
Substantial improvements took place during the 20th century in terms of education. For both women and men, there was a significant increase in the percentage of individuals with secondary and tertiary education from the first to the last decade accompanied by a decrease in the percentage of individuals with only primary education. In the first decade, the educational attainment distribution was not different for women and men. In the last decade of the century, the percentage of women and men with tertiary education was 24.8 per cent and 14.5 per cent, respectively (Figure 2). The difference is statistically significant in favour of women.

FIGURE 2 CHANGE IN EDUCATION AND WORKFORCE IN COLOMBIA ACCORDING TO SEX, 1920–1980.
There was also a substantial change in the workforce composition during the last century. A significant increase in the percentage of skilled workers and students took place (Figure 2). Differences between women and men were unstable throughout the century; the percentage of unskilled women was considerably higher, and the percentage of students and skilled women workers was lower than the percentage of men in the first decade of the century. In the last decade, there were no significant differences between women and men in the percentage of unskilled workers and students, and the percentage of female skilled workers was significantly higher than the percentage of male skilled workers (Figure 2).
3.2 Methodology
As the anthropometric literature has shown, adult height is affected by economic, social and health conditions in childhood (Steckel Reference Steckel1995a; Silventoinen Reference Silventoinen2003; Akachi and Canning Reference Akachi and Canning2007). In this section, we investigate the relationship between the stature of Colombians born in the 20th century and several socio-economic variables such as gender, education, occupational activity and size of the municipality where the individual was born.
In particular, the year of birth is an important variable given that, as mentioned by Ayuda and Puche-Gil (Reference Ayuda and Puche-Gil2014), it includes the effect that economic, social and political conditions could have on the quality of life. On the other hand, the level of education reached by the individual would reflect her/his socio-economic status and its effect on biological well-being measured by her/his height in adulthood. Occupation also provides information about the effect of the individual's socio-economic status on her/his height, as it could be considered a proxy for the family's income levelFootnote 18. A person's place of birth can also provide information about the social, environmental, economic and health conditions of the individual during the first years, which is a determinant of physical development.
As Silventoinen (Reference Silventoinen2003) remarks, nutrition and diseases in childhood are the main non-genetic factors affecting body height. Gastrointestinal diseases (especially diarrhea), fevers and respiratory infections negatively affect nutrition and, consequently, statureFootnote 19. It is for this reason that we include the mortality rate from gastrointestinal and respiratory diseases, as well as the mortality rate from maternal puerperal diseases in our regression analysisFootnote 20. Finally, we include the percentage of households in each department covered by aqueductsFootnote 21. The provision of public services is important since the decline of mortality and morbidity rates was partly caused by improvements in the provision of public goods, especially regarding sanitary conditions. For an analysis of the contribution of the provision of public services, namely aqueducts and sewerage, to the reduction in mortality rates from different types of diseases see Jaramillo-Echeverri et al. (Reference Jaramillo-Echeverri, Meisel-Roca and Ramírez-Giraldo2018).
Several models were estimated in order to analyse the socio-economic determinants of heightFootnote 22. The logarithm of individual height was regressed on observable characteristics: year of birth, sex, highest level of education reached (primary, secondary, technical/technological, or university education), occupation (unskilled, skilled labour, student, or armed forces), population size in the municipality of birth, percentage of households in the department and year of birth covered by aqueducts and mortality rate (per 1,000 inhabitants) from gastrointestinal infections, respiratory diseases and puerperal diseases in the department and year of birthFootnote 23. We include department fixed effects. In order to identify differential growth rates, we added interaction terms between sex, education, occupation and size of the municipality with the year of birth. In Model 1 aqueduct provision is not included because we consider it an important determinant of health, so a collinearity problem would arise between health variables and aqueducts. In Model 2, we include aqueduct provision, but exclude health variables. Education and occupation are different measures of human capital that are highly correlated, which is why we include them separately in two different regressions for each model.
4. RESULTS AND DISCUSSION
4.1 Secular Trend and Biological Inequality
Figure 3 shows the positive trend in the average height of Colombians during the 20th century. The average height for women increased by 4.1 cm between the first and the last decades of the century, and men's average height increased by 5.8 cm (Figure 4). This trend is similar to the results found by Meisel and Vega (Reference Meisel and Vega2007b), which include data for the entire Colombian population in the 20th century. Meisel and Vega (Reference Meisel and Vega2007b) explain the improvement in height by the advances in nourishment, urbanisation, and the fall in food prices due to high investments in transportation since 1950. First, the authors point out that at the beginning of the 20th century, the diet of labourers in the country was deficient in terms of intake of calories and protein due to the low wages of the working classes. However, over the course of the century, calorie and protein consumption increased due to the growth of GDP per capita which increased at an average annual rate of 2.3 per cent during 1905–2000. Likewise, improvements in transportation and the industrialisation of the food sector since 1950 led to a decrease in the real price of key foods, which had positive effects on average height. Second, health conditions in terms of personal hygiene, public sanitation and medical knowledge improved. For example, according to Jaramillo-Echeverri et al. (Reference Jaramillo-Echeverri, Meisel-Roca and Ramírez-Giraldo2018), the percentage of deaths from tuberculosis, pneumonia and gastrointestinal diseases decreased significantly through the century. Third, urbanisation and economic development led to an increase in job creation in the industrial and services sectors. As the latter are less physically demanding (compared with jobs in the rural sector), as discussed in Fogel (Reference Fogel1994), nutrient intake is mostly reflected in increases in height. For the same reasons, according to Meisel and Vega (Reference Meisel and Vega2007a) the reduction in child labour during the century contributed to an increase in average height. Specifically, by 1965 about 31.9 per cent of children were below their growth potential, whereas by 2000, the figure had fallen to 13.5 per cent.
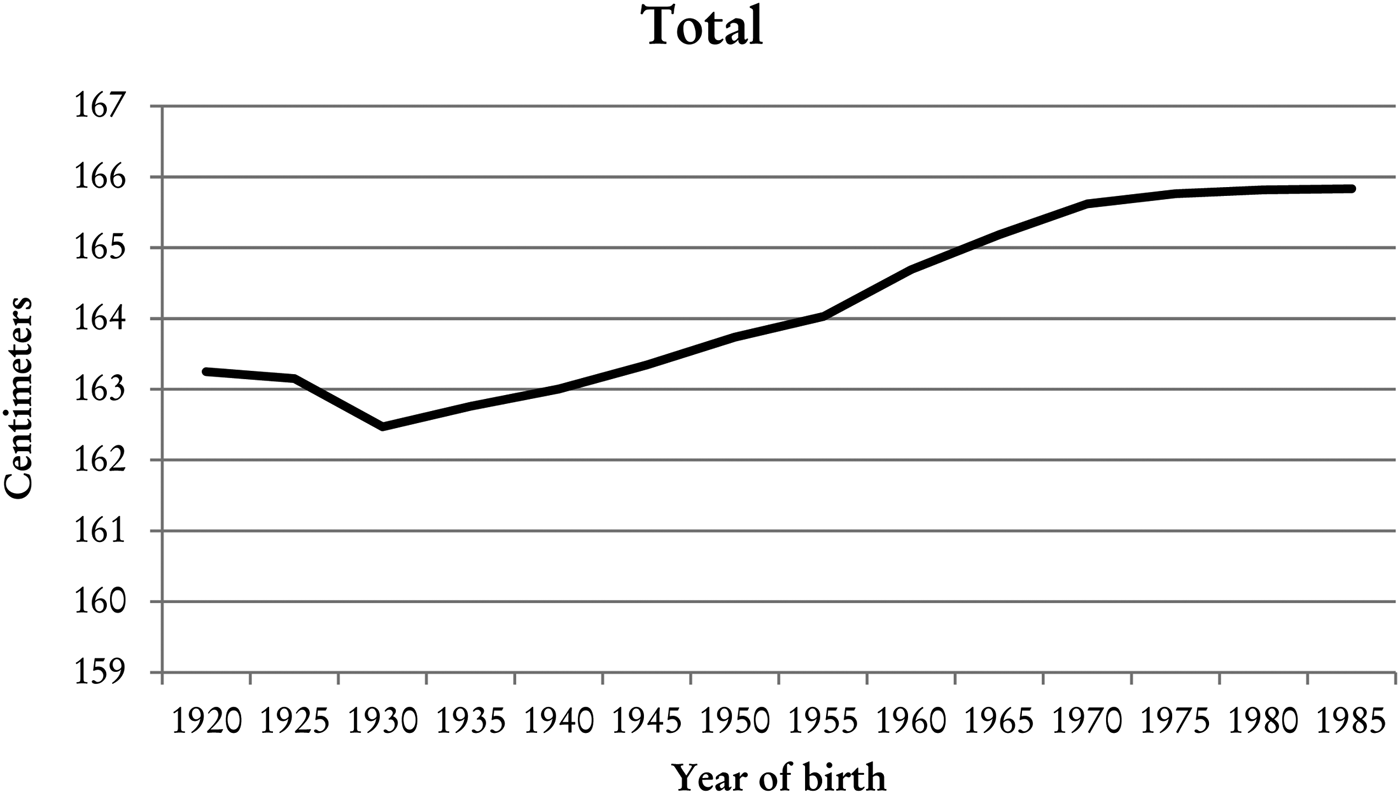
FIGURE 3 EVOLUTION OF AVERAGE HEIGHT IN COLOMBIA DURING THE 20th CENTURY.
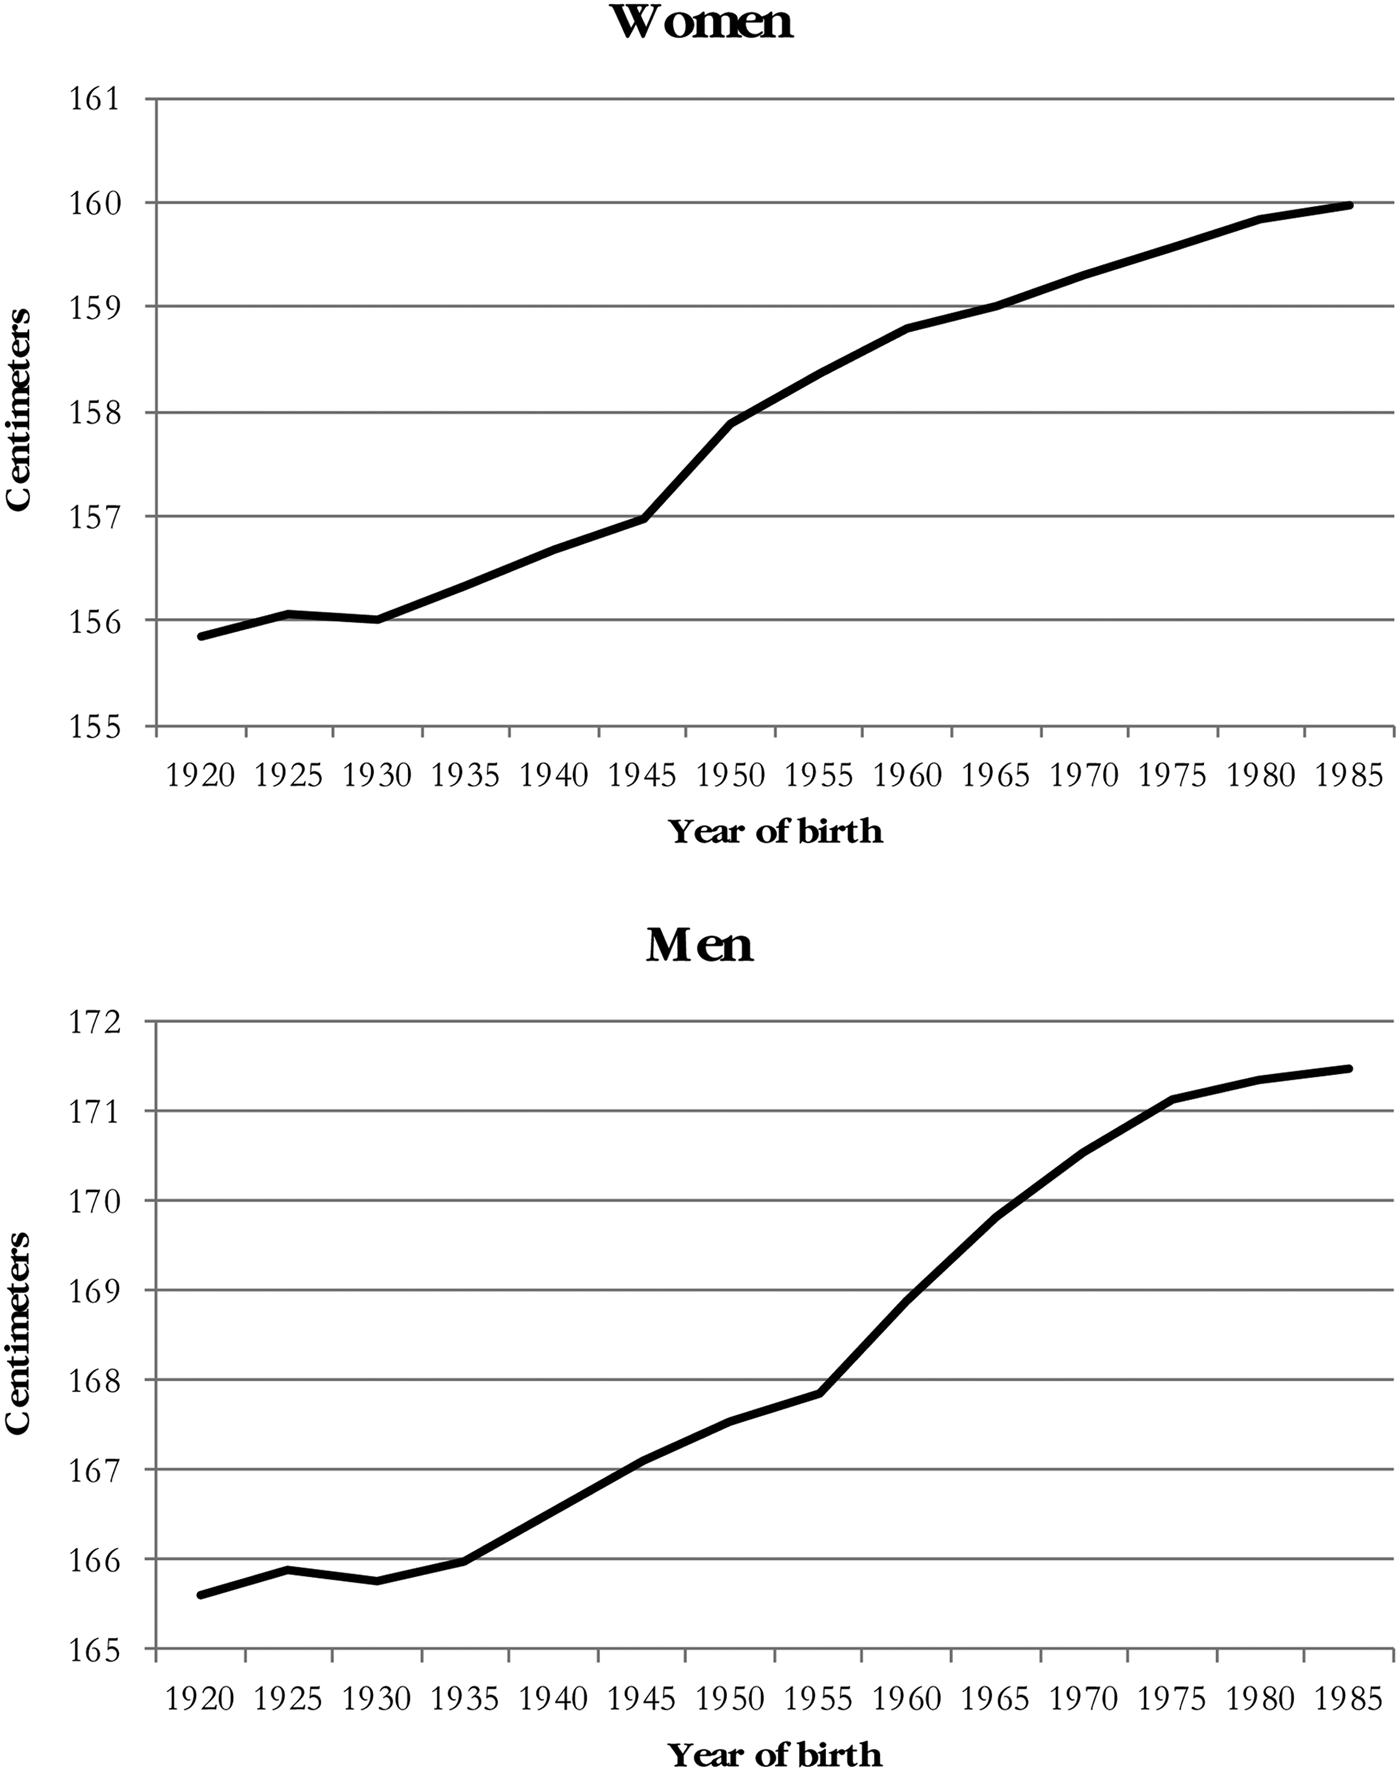
FIGURE 4 EVOLUTION OF AVERAGE HEIGHT IN COLOMBIA DURING THE 20th CENTURY BY SEX.
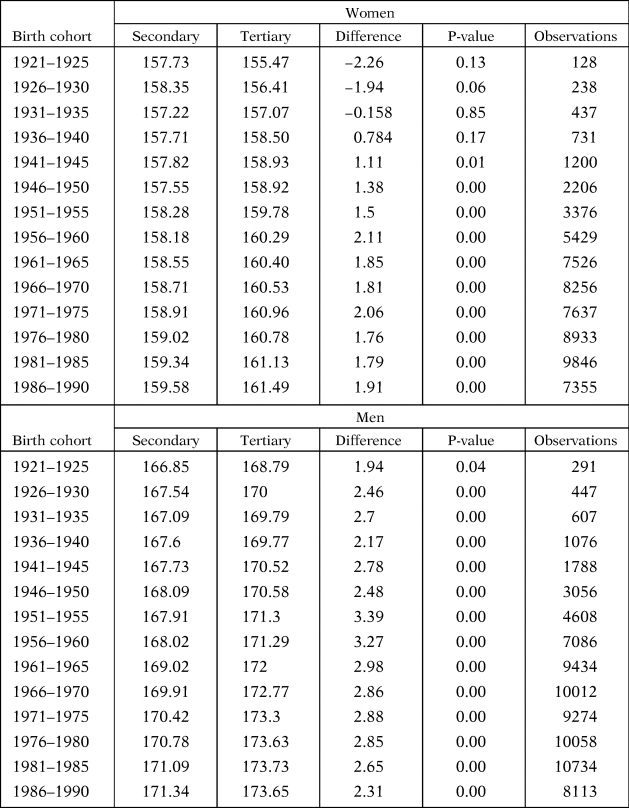
Height differentials can be observed for different educational levels. As the level of education increases, average height increasesFootnote 24. From 1921 to 1990, the average height of individuals with secondary and tertiary education went up by 0.02 per cent and 0.06 per cent annually, respectively, in the case of women; it did so by 0.04 per cent, and 0.05 per cent, respectively, in the case of men. The height differentials between skilled and unskilled workers were 2.2 cm on average throughout the century for women, and 3 cm for men (Figures 5 and 6). This difference was statistically significant since 1930 for men and womenFootnote 25.
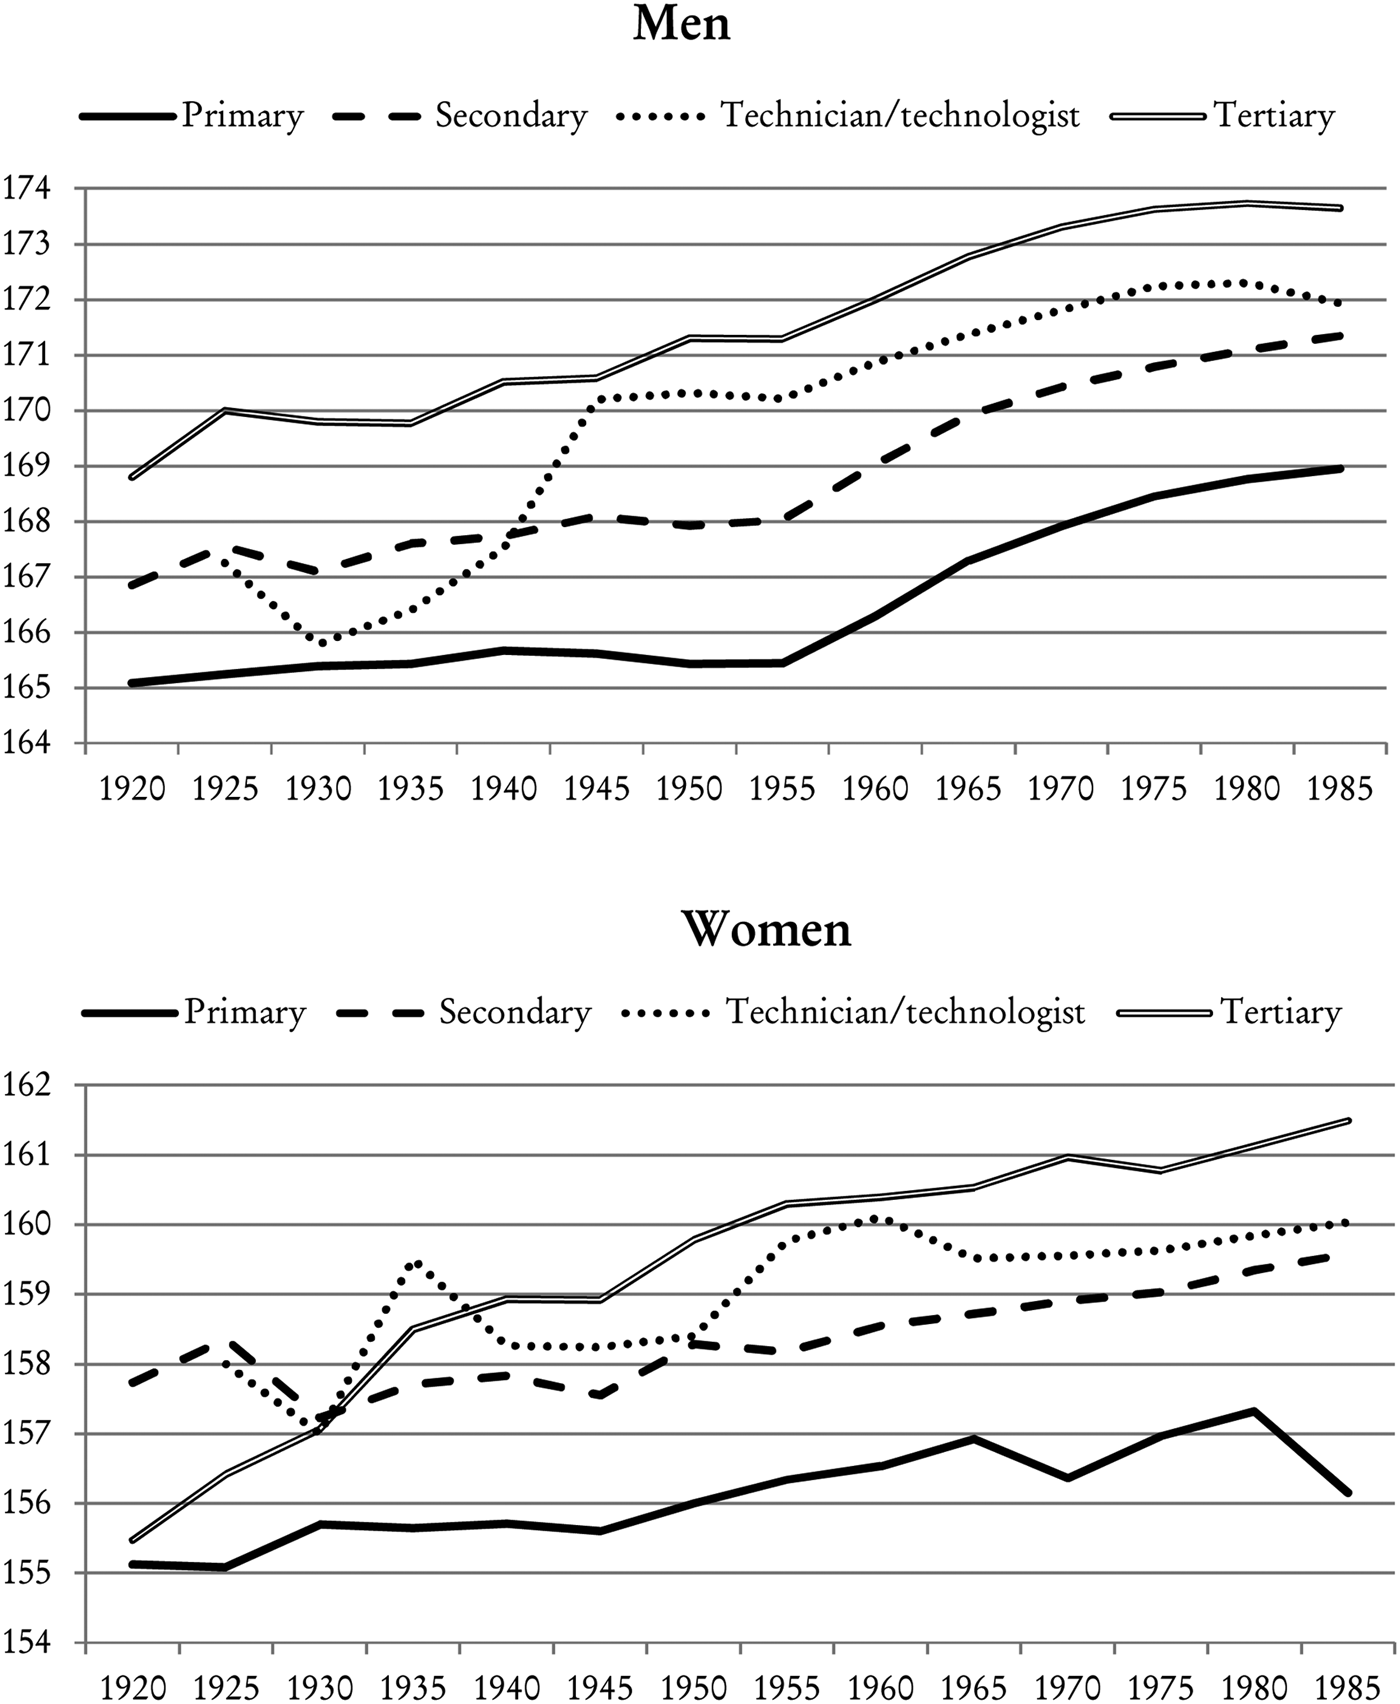
FIGURE 5 EVOLUTION OF AVERAGE HEIGHT IN THE 20th CENTURY BY EDUCATIONAL LEVEL IN COLOMBIA.
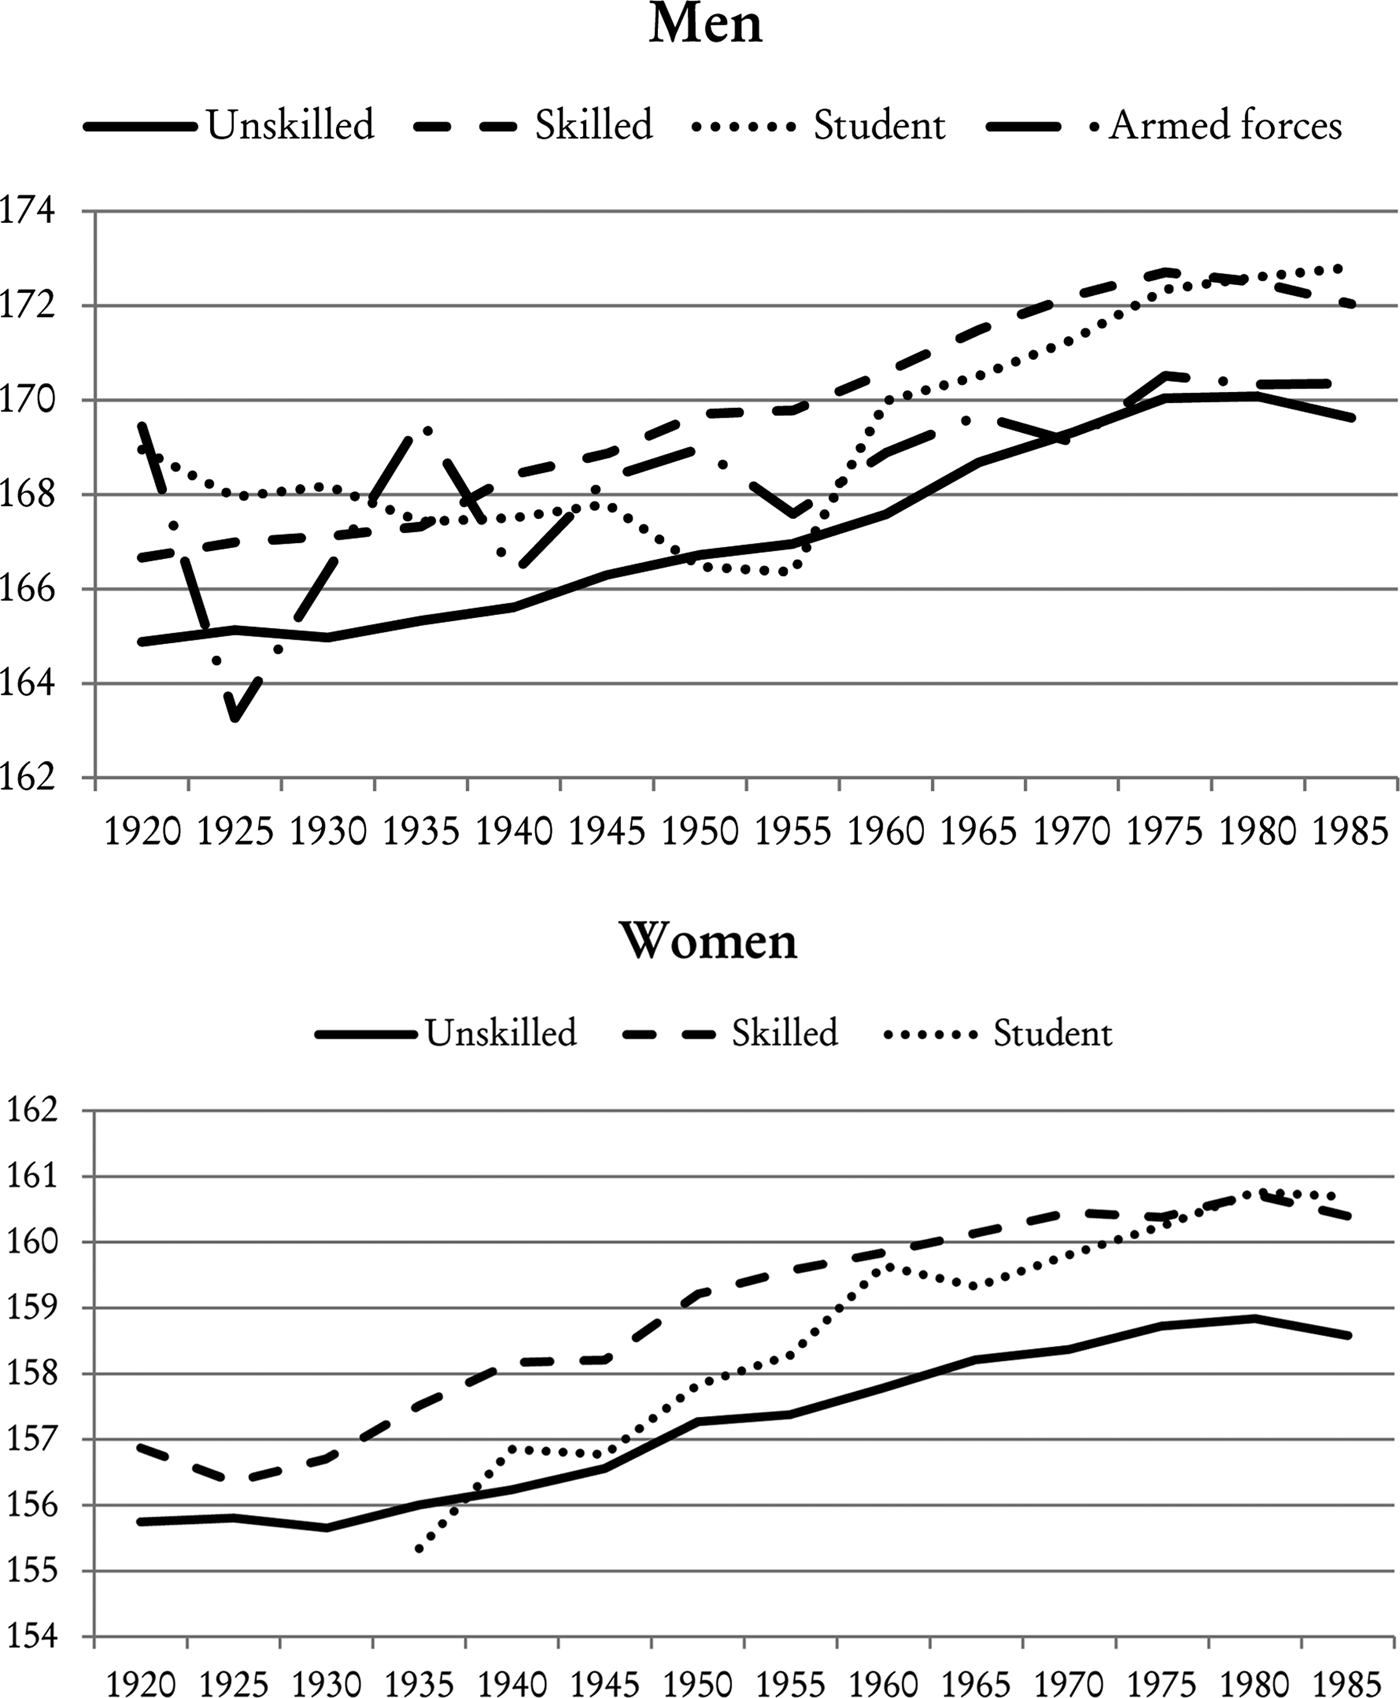
FIGURE 6 EVOLUTION OF AVERAGE HEIGHT IN THE 20th CENTURY BY LABOUR FORCE TYPE IN COLOMBIA.
Height differences across regions were relatively stable through the century, as we can see in Figure 7. On average, people born in the Caribbean region were significantly taller than the rest of the population until 1970. According to Meisel and Vega (Reference Meisel and Vega2007b), this is explained, first, by the anthropometric characteristics of the large percentage of people with African ancestors living in the Caribbean regionFootnote 26. Second, the nutritional condition in this region at the beginning of the 20th century was better than in other regions because it was the country's main cattle-producing area and had greater access to fishing activities, leading to a greater consumption of protein by the inhabitants of the Caribbean region. Conversely, at the beginning of the 20th century, in departments of the Andean region such as Cundinamarca and Boyacá, daily per capita consumption of meat was 4 times lower than that of departments located in the Caribbean region (Meisel and Vega, Reference Meisel and Vega2007a). Third, as mentioned earlier, through the 20th century, the benefits of industrialisation and the expansion in coffee exports had a positive impact on the Andean region, leaving behind other regions. Therefore, the Andean region, which started the century with the second lowest average height, was the region with the highest growth rate in the 20th century. This shows convergence for both men and women because the Caribbean and the Andean region had the lowest and the highest average annual growth rates in height, respectively.
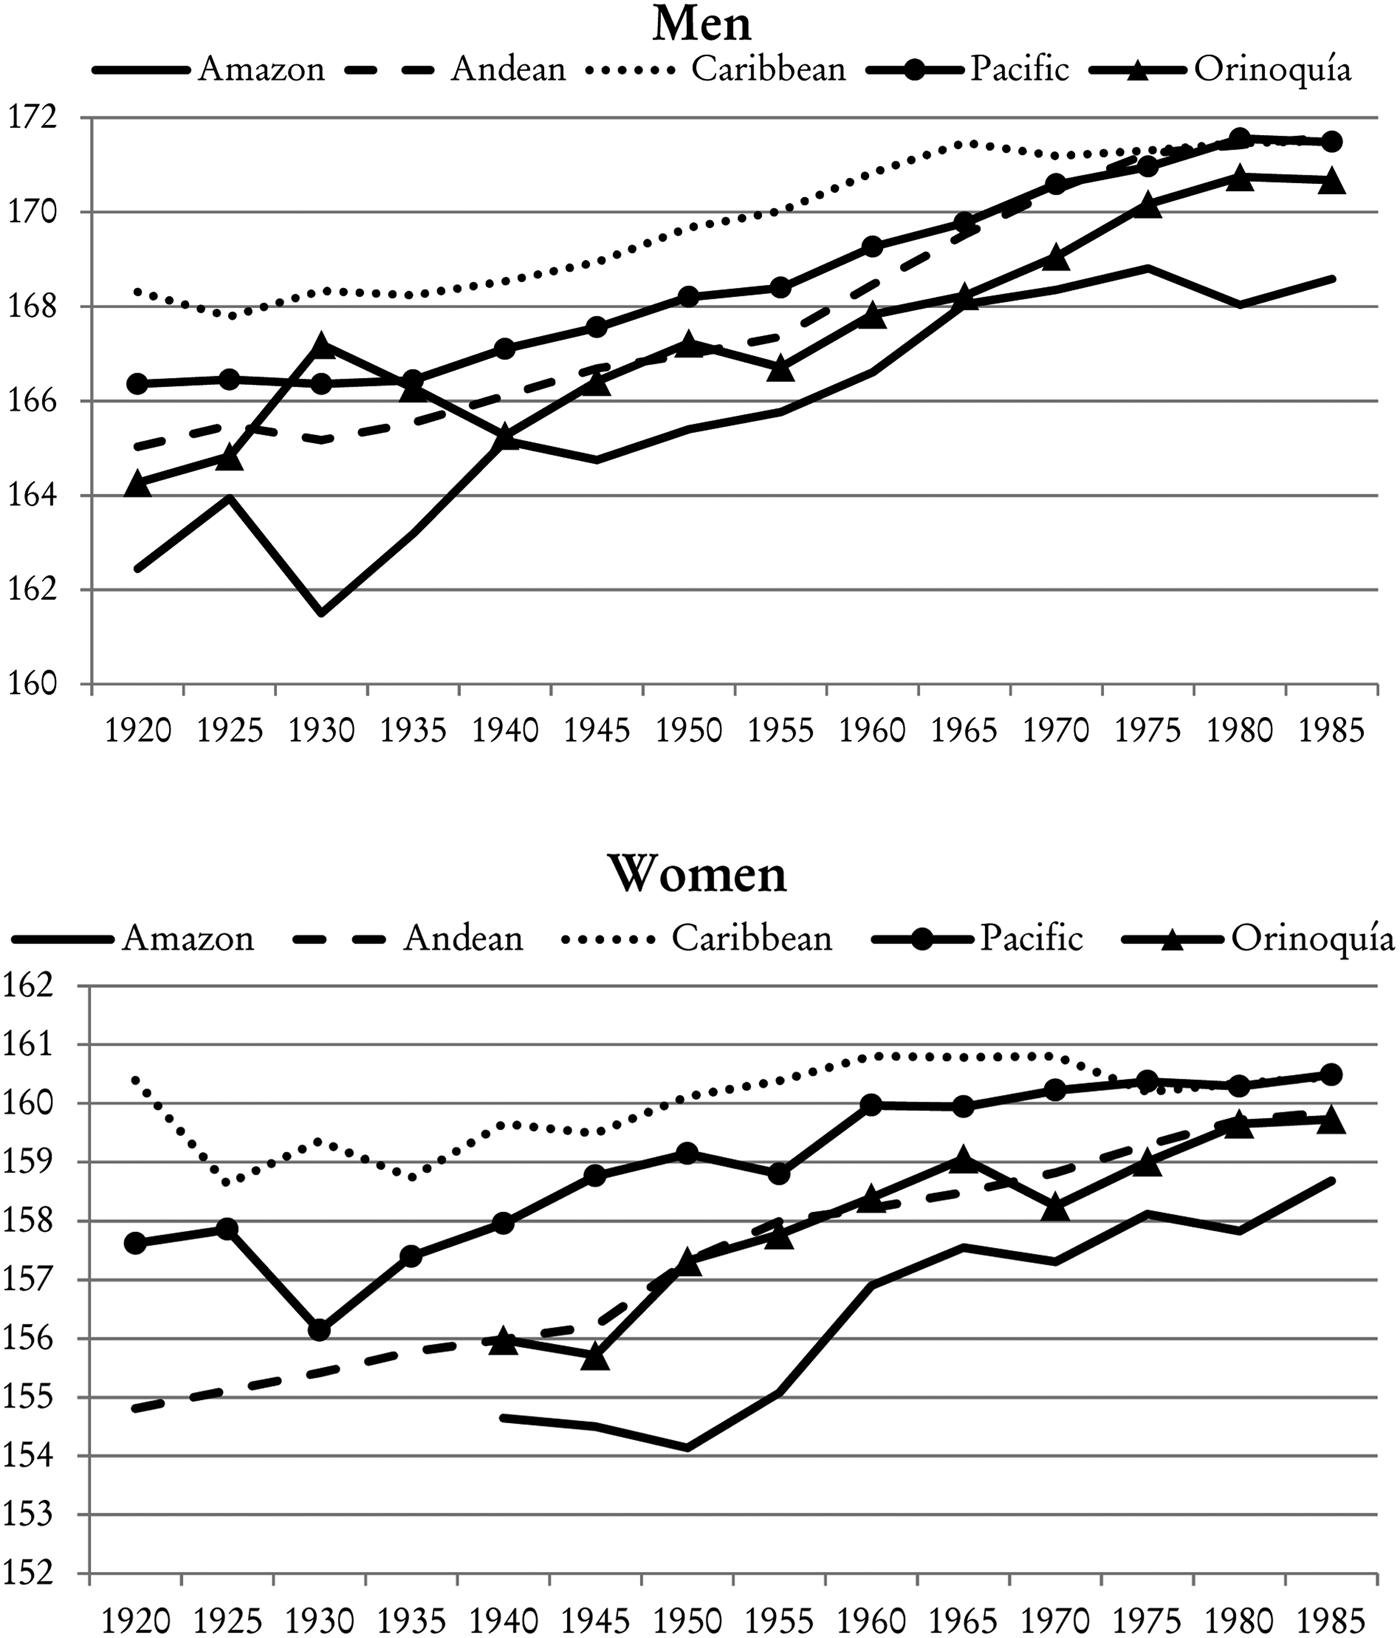
FIGURE 7 EVOLUTION OF AVERAGE HEIGHT IN THE 20th CENTURY BY COLOMBIAN REGIONS.
4.2 Socio-Economic Height Determinants
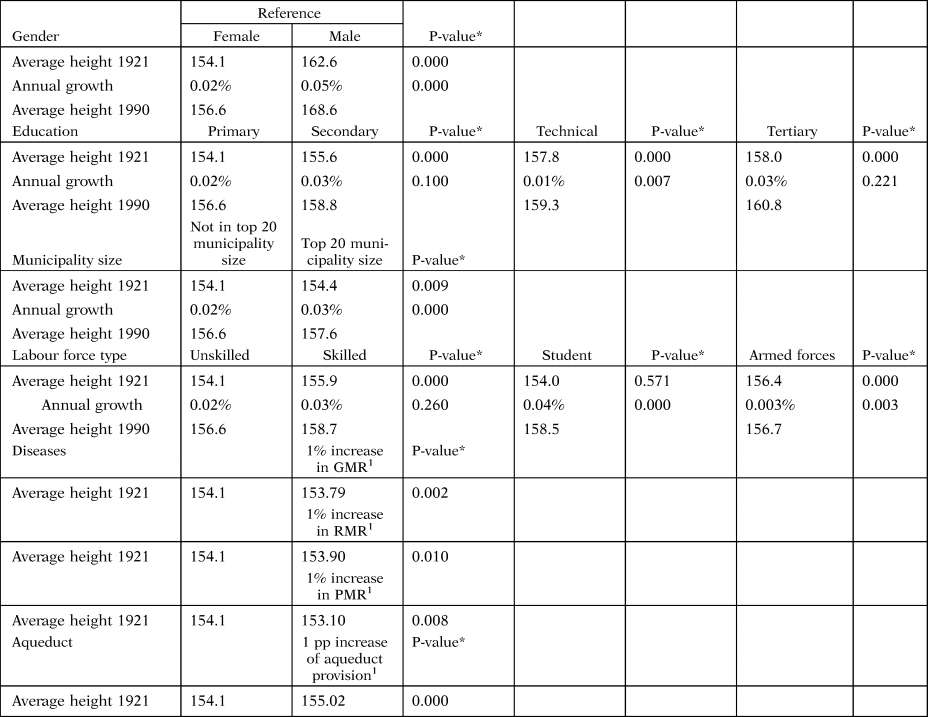
Table 2 presents the results of the econometric estimates and Table 3 displays the estimations of the annual growth rate for stature by variable compared with its corresponding reference categoryFootnote 27. Results from Table 2 indicate that the effects of almost all socio-economic and health variables on height are significant. The year of birth is positive and significant in all models, meaning that average height increased over time in Colombia. Birth cohorts gain around 0.02 per cent and 0.04 per cent in adult height with respect to the cohort born a year before (Table 2). Men are 5.4 per cent taller than women and the interaction term between sex and year of birth indicates that men grew annually 0.03 percentage points more than women. Table 3 shows that the predicted average height of men born in 1921 was, ceteris paribus, 8.5 cm more than that of women, and this gap widened to 12 cm for individuals born in 1990.
TABLE 2 EFFECTS OF SOCIOECONOMIC VARIABLES ON ADULT HEIGHT OF COLOMBIANS BORN BETWEEN 1920 AND 1990: PERCENTAGE DIFFERENCE

Sources: See text.
Notes: Robust standard errors in parentheses, ***P < 0.01, **P < 0.05, *P < 0.1.
Percentage difference is estimated from OLS coefficients. It is equivalent to ![]() $(e^{\hat{\beta}} -1) \times 100$.
$(e^{\hat{\beta}} -1) \times 100$.
TABLE 3 ESTIMATION OF AVERAGE HEIGHT (CM) IN 1921 AND 1990 AND ITS ANNUAL GROWTH RATE BY SOCIO-ECONOMIC INDICATOR
Sources: See text.
Notes:
*P-value of the difference with respect to the reference category.
1 In the department and year of birth.
GRM, gastro-intestinal mortality rate; RMR, respiratory mortality rate; PMR, puerperal mortality rate.
Regarding education, individuals with more education are taller on average (Table 2). An individual's level of education reflects the socio-economic status of her/his family and its effects on nutrition and health, because families would have a greater capacity to acquire better quality foods and better nutrients, as well as access to better health services and better hygiene habits (Chanda et al. Reference Chanda, Craig and Treme2008). Our results indicate that compared with individuals with primary education, those with secondary education are 1 per cent taller, technicians 2.4 per cent taller, and university students 2.5 per cent taller on average (Table 2). Additionally, individuals with secondary education have a higher growth rate, which means that the gap with respect to the reference category widens over time. Table 3 shows that, on average, individuals born in 1990 with secondary education were 2.2 cm taller than those with primary education, and individuals with tertiary education were 4.2 cm taller than those with primary education.
Individuals who were born in large municipalities are slightly taller than those who live in smaller municipalities (Table 2). Individuals born in the top 20 larger municipalities grew 0.01 percentage points more annually than those born in smaller municipalities, on average (Table 3). Concerning occupation, our model estimates that skilled workers were taller than any other occupation during the period under study, except for armed forces at the beginning of the century. Students were not significantly taller than unskilled workers on average, but did have a significantly higher growth rate, which translates into a higher average height throughout the century. Students were almost 2 cm taller and skilled workers were 2.1 cm taller than unskilled workers at the end of the period (Table 3).
In line with the literature, we find a negative and significant relationship between an individual's height and mortality rates from gastrointestinal, respiratory and puerperal diseases that occurred at the time, and department of birth. For example, Schmidt et al. (Reference Schmidt, Jørgensen and Michaelsen2009) examine the relationship between post-neonatal mortality, as a proxy for adverse environmental factors, mainly poor nutrition and infections and conscript height in European countries. The authors find a negative relationship between these variables. Interestingly, puerperal diseases have the largest effect on adult height compared with other diseases. An additional death (per thousand individuals) from puerperal diseases in the year and department of birth leads to a 0.01 per cent reduction in adult height (Table 2). These results are consistent with the literature which finds that maternal health is vital for child health and developmentFootnote 28.
As expected, a larger provision of aqueducts affects stature positively. For instance, a one-percentage-point increase in aqueduct coverage increases height by almost 1 per cent (Table 2). This is a key finding in terms of public health policy. As found in Jaramillo-Echeverri et al. (Reference Jaramillo-Echeverri, Meisel-Roca and Ramírez-Giraldo2018), the expansion of the aqueduct and sewerage infrastructure during the 20th century in Colombia had a positive impact on the decrease of the gastrointestinal mortality rate in the country. Specifically, they found that, on average, a 30 per cent increase in aqueduct coverage, reduced this mortality rate by between 5.5 per cent and 7.3 per cent, and the impact of the provision of sewerage reduced the rate by between 11 per cent and 12 per cent. As explained above, height is affected by the health conditions in which a child grows. Thus, it can be argued that better sanitary conditions lead to better health conditions, which has positive repercussions on height.
In summary, the results suggest statistically significant differences in adult height according to sex, level of education, place of birth, occupation and date of birth. Likewise, disease and aqueduct provision significantly affect stature. The results for Colombia are similar to those found in the literature for other countries such as Spain, The Netherlands, Hungary and Japan, among others, where socio-economic status plays an important role in statureFootnote 29.
4.3 Convergence Analysis
In this section, we explore the spatial convergence of stature across Colombian departments. This analysis is important given the disparities in the individuals' height observed across regions (Figure 8). To this end, we use two measures frequently employed in the literature of economic growth, namely beta convergence (β) and sigma convergence (σ), which are useful to test convergence in the indicators of biological well-beingFootnote 30.
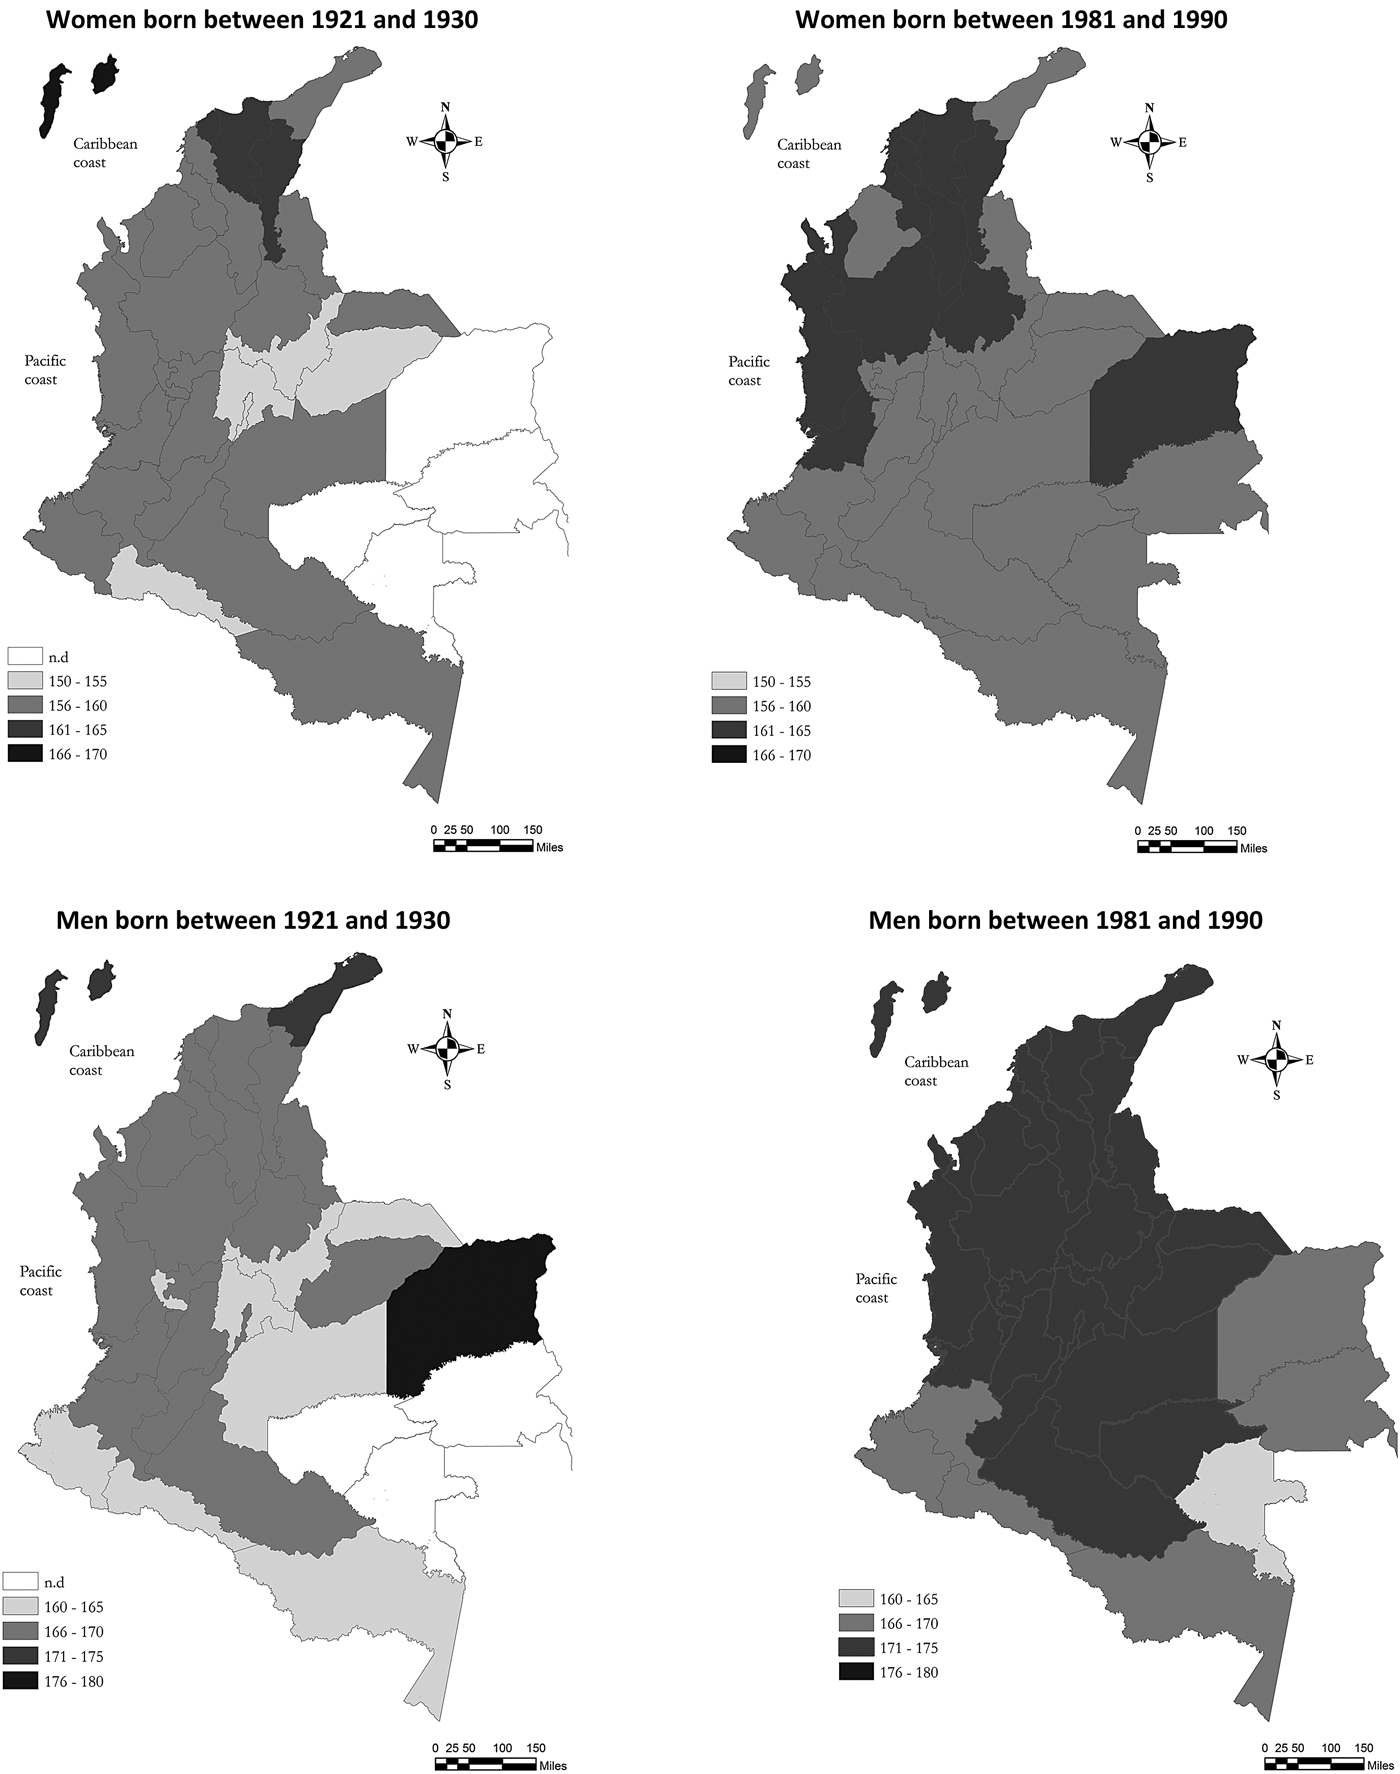
FIGURE 8 GEOGRAPHICAL DISTRIBUTION OF AVERAGE HEIGHTS: FIRST VS. LAST DECADE OF THE 20th CENTURY (CENTIMETERS) IN COLOMBIA.
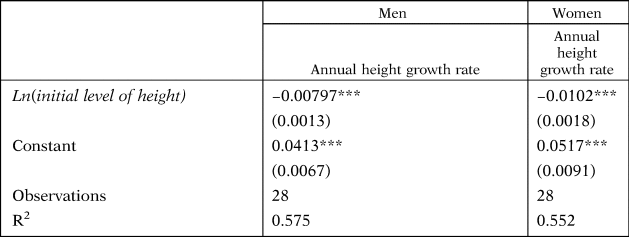
To estimate the β-convergence, we regress the growth rate of average height over the 1920–1990 period, and its initial levelFootnote 31. If ![]() $\hat{\beta} $ is negative, then there is β-convergence, which means that the departments where the initial stature was higher show a lower height growth rate during the period analysed, and inversely, departments lagged in terms of height grow more rapidly. Specifically, we estimate the equation:
$\hat{\beta} $ is negative, then there is β-convergence, which means that the departments where the initial stature was higher show a lower height growth rate during the period analysed, and inversely, departments lagged in terms of height grow more rapidly. Specifically, we estimate the equation:
where ln(h)j,0. is the natural logarithm of the initial height in department j, εj. is the error term, and Δln(h)j,T is the annual rate of height growth over the 1920–1990 periodFootnote 32.
Figures 9 and 10 show the relationship between the growth rate for height and its initial level during the period analysed for males and females, respectively. The figures suggest that the relationship between the initial height and the growth rate is negative.
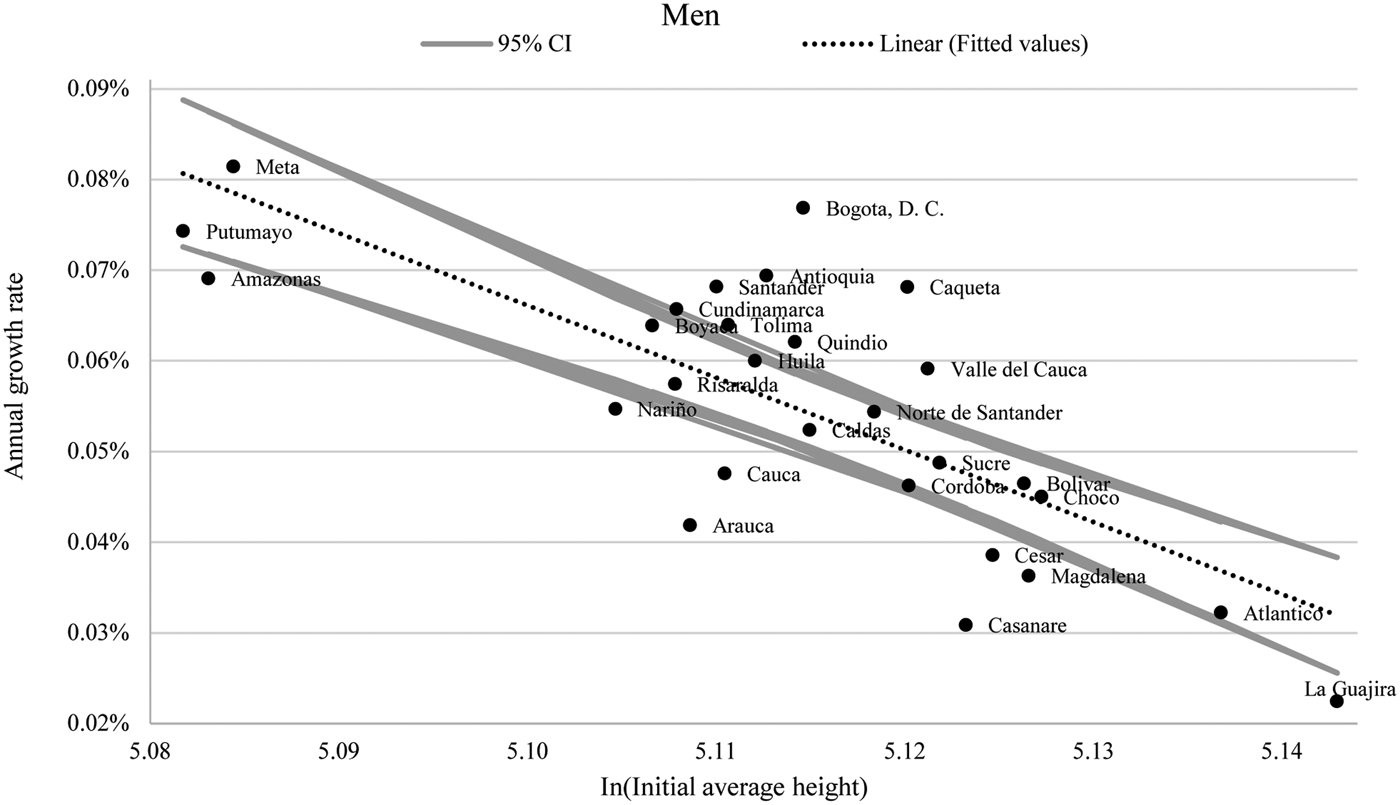
FIGURE 9 β-CONVERGENCE ACROSS COLOMBIAN DEPARTMENTS: MEN BORN BETWEEN 1920 AND 1990.
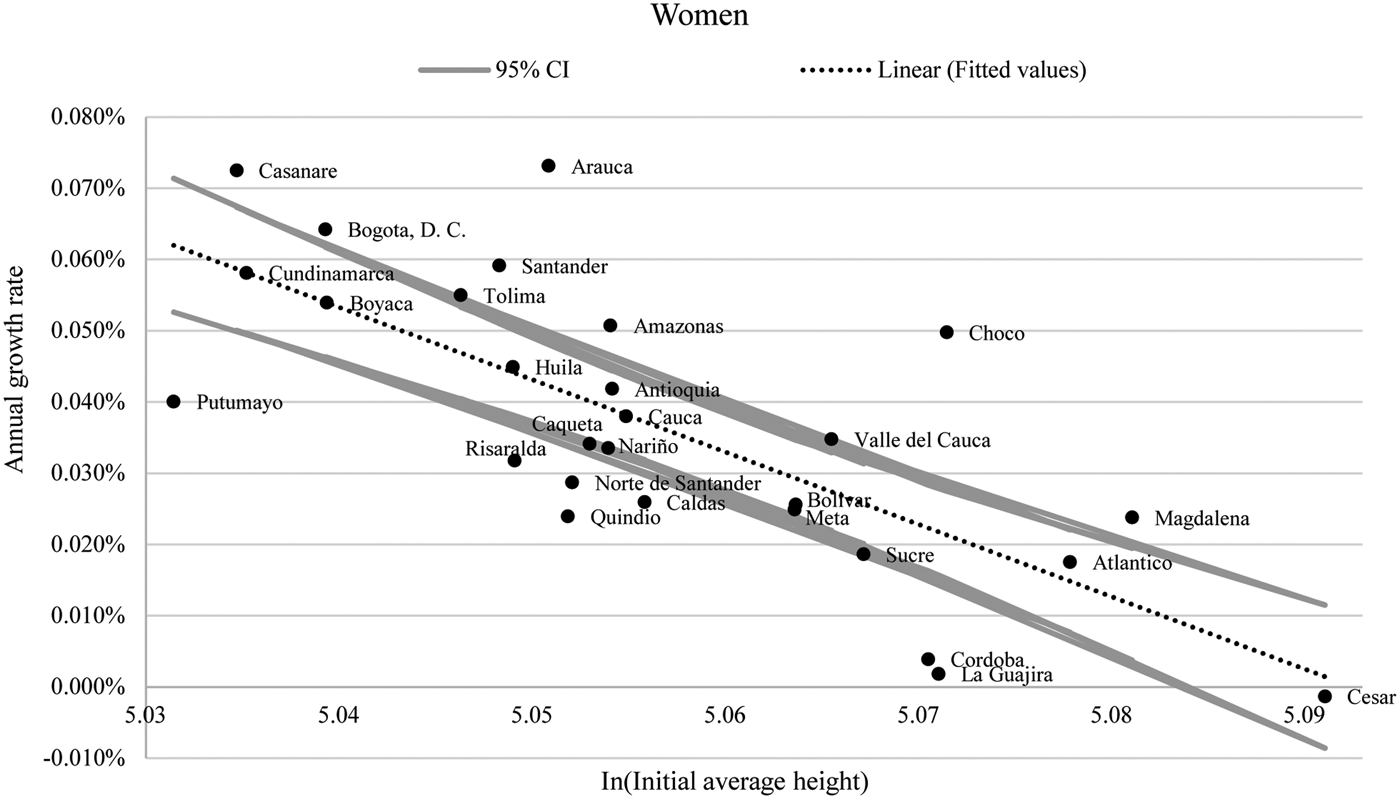
FIGURE 10 β -CONVERGENCE ACROSS COLOMBIAN DEPARTMENTS: WOMEN BORN BETWEEN 1920 AND 1990.
Table 4 presents the results of the estimation of equation [1]. The estimated β coefficient is negative and significant, indicating that a β-convergence of height took place in Colombia across departments for both women and men during the 20th century. In particular, the magnitude of the β-coefficient for males implies that it takes approximately 85 years to eliminate one-half of an initial gap in men's stature, with a speed of convergence of around 0.8 per cent/year (Table 4). For women, the speed of convergence is slightly higher, 1.0 per cent/year, which implies that it takes nearly 67 years to eliminate one-half of the initial gap in women's height Footnote 33.
TABLE 4 β-CONVERGENCE: MEN AND WOMEN BORN BETWEEN 1920-1990
Sources: See text.
Notes: Standard errors in parentheses ***P < 0.01, **P < 0.05, *P < 0.1.
The departments of Guainía, Guaviare, Vichada and Vaupés are grouped due to lack of data availability.
These convergence rates for stature are similar to those found in previous literatureFootnote 34. However, they are lower than those estimated for per capita income. Barro and Sala-i-Martin (Reference Barro and Sala-I-Martin1992) find that the β-coefficient (across different datasets) is between 2 per cent and 3 per cent/year, which implies that it takes 25–35 years to eliminate one-half of an initial gap in per capita incomes.
Furthermore, Figure 11 shows the results of σ-convergence, estimated as the coefficient of variation (CV) between departments for men and women's height and mean heightFootnote 35. The CV is expected to fall over time if there is convergence among departments in the average stature of individuals. The graphs show that a process of rapid reduction in the dispersion of men and women's heights took place between the Colombian departments from 1920 to 1990. As observed, the CV indicates relatively high stature inequality during 1920s and 1930s, which later diminished.
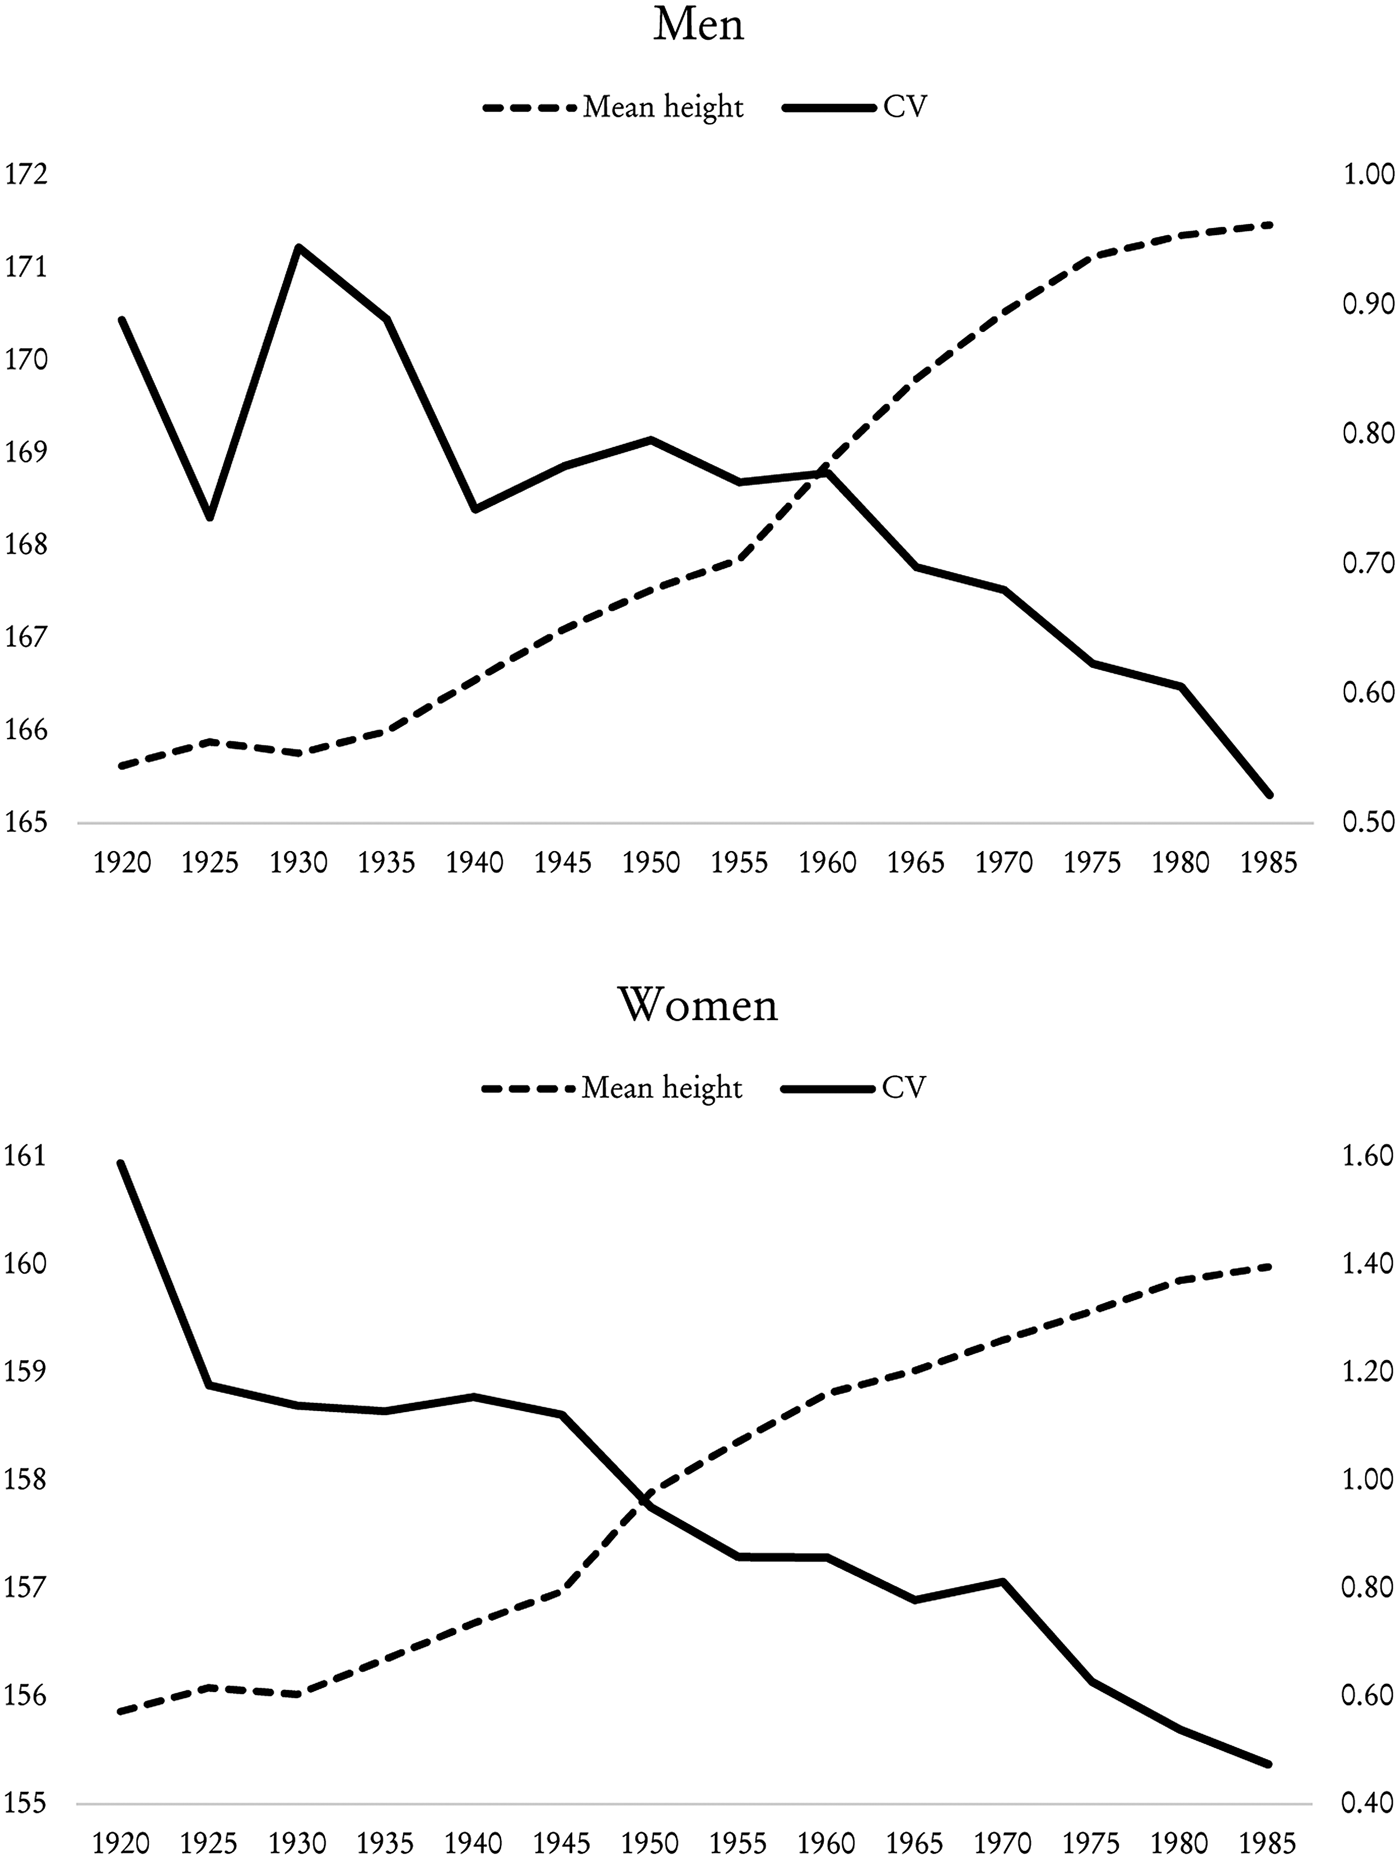
FIGURE 11 σ − CONVERGENCE FOR THE COLOMBIAN DEPARTMENTS: COHORTS BORN BETWEEN 1920 AND 1990.
The fall in dispersion occurred during the second half of the 20th century, and may be partly due to the economic, demographic and epidemiological transformations that took place in this period, resulting in significant progress in living standards for the Colombian population. As mentioned by Jaramillo-Echeverri et al. (Reference Jaramillo-Echeverri, Meisel-Roca and Ramírez-Giraldo2018), the mortality rate declined from 23.4 deaths per thousand inhabitants in 1905 to about 5.5 in 2000. During this same period, the infant mortality rate decreased from 186 deaths per 1000 births to twenty-seven. Likewise, life expectancy at birth increased from 35 to 73 years during the same period. Regarding epidemiological transformations, the authors illustrate that during the 20th century, the percentage of deaths from tuberculosis, gastrointestinal diseases and pneumonia decreased between 1925 and 2005, from 4.25 per cent to 0.5 per cent, from 16 per cent to less than 1 per cent, and from 9 per cent to slightly more than 3 per cent, respectively. This, together with the implementation of various public policies, helped to improve the population's nutrition levels, contributing positively to their immune system, health and quality of life in general. In particular, since the 1950s, we observe significant improvements in public health and sanitary conditions, higher per capita income and better nutritionFootnote 36.
In the case of men, the CV went from 0.9, on average, during the 1920s to approximately 0.52 in the late 1980sFootnote 37. On the other hand, the CV of the stature of women born during the 1920s was 1.6 on average, and reduced to 0.57 by 1990, which means that the dispersion among the departments in the average stature of women decreased rapidly, evidencing a slightly faster process of convergence of height than in the case of men. Figure 11 shows a negative correlation between mean height and departmental inequality. In the case of men, the correlation is −0.87, and for women it is −0.93.
5. CONCLUSIONS
In this paper, we analyse the evolution, the determinants and the process of convergence of the stature of Colombian women and men during the 20th century as an indicator of biological well-being. In particular, we make a quantitative contribution to the literature by econometrically estimating the socio-economic and demographic determinants of height, also including health conditions, the provision of public services and the size of the individual's municipality of birth in Colombia. We also contribute with a new dataset based on judicial background certificates; a sample of more than 225,000 observations that are non-truncated, not self-reported and highly representative of the Colombian population.
Our results show that both women and men born between 1920 and 1990 experienced significant improvements in their biological well-being as their average height increased substantially throughout the century. On average, women's height increased by 4.1 cm between the first and the last decades of the century, and men's height increased by 5.8 cm. These improvements were due to the sustained economic growth that Colombia registered during the 20th century. Higher income resulted in better nutrition, improvements in health conditions, access to public services and progress in education, leading to improvements in the population's standard of living.
The results from the econometric estimations indicate that men are 5.4 per cent taller than women, individuals with more education are taller on average, people who were born in large municipalities are slightly taller than those who live in smaller municipalities, and students and skilled workers were taller on average than unskilled workers, and all of these gaps widen over time.
Larger provision of aqueducts affects stature positively, while mortality rates from gastrointestinal, respiratory and puerperal diseases have a negative effect. These are key findings in terms of public health policy since we provide evidence regarding the relevance of sanitary conditions.
Finally, the results indicate that there was a significant decrease in regional disparities in height during the 20th century. That is, there was a lower height growth rate in those departments in which the population was the tallest in 1920, compared with departments with shorter average initial height. This result ratifies previous findings regarding regional convergence of social indicators despite non-convergence in per capita income.
ACKNOWLEDGEMENTS
We would like to thank Laura Cristancho, Daniela Gualtero and Daniel Zarama for their support as research assistants. We also thank the anonymous referee for the valuable comments. The opinions expressed herein are those of the authors and do not reflect the views of Banco de la República or its Board of Directors.
APPENDIX A
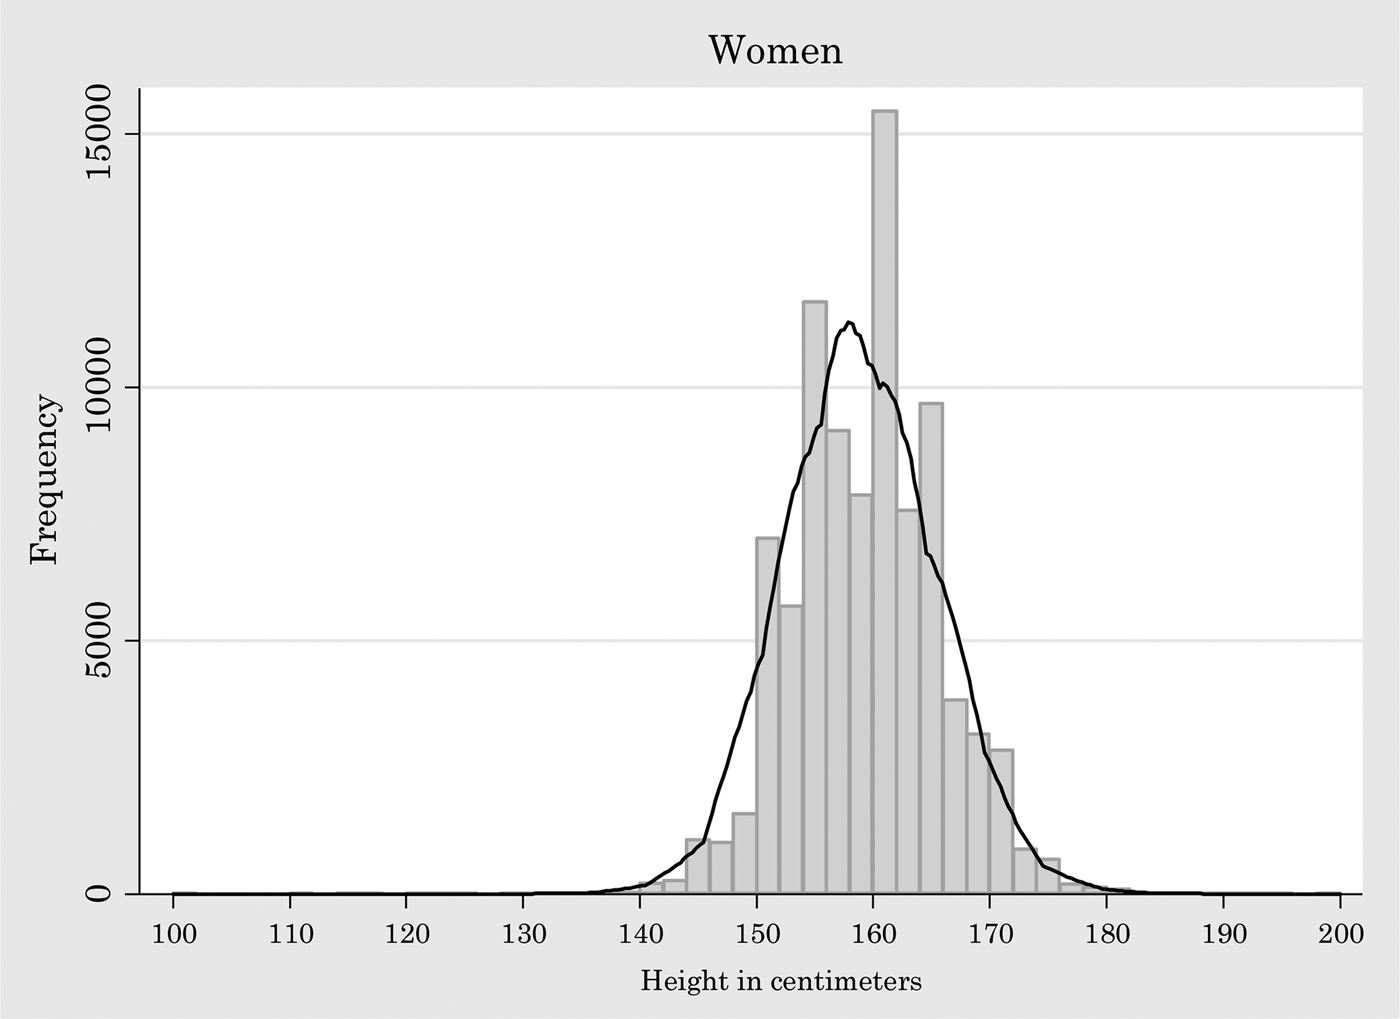
FIGURE A1 FREQUENCY DISTRIBUTION OF FEMALE HEIGHT.
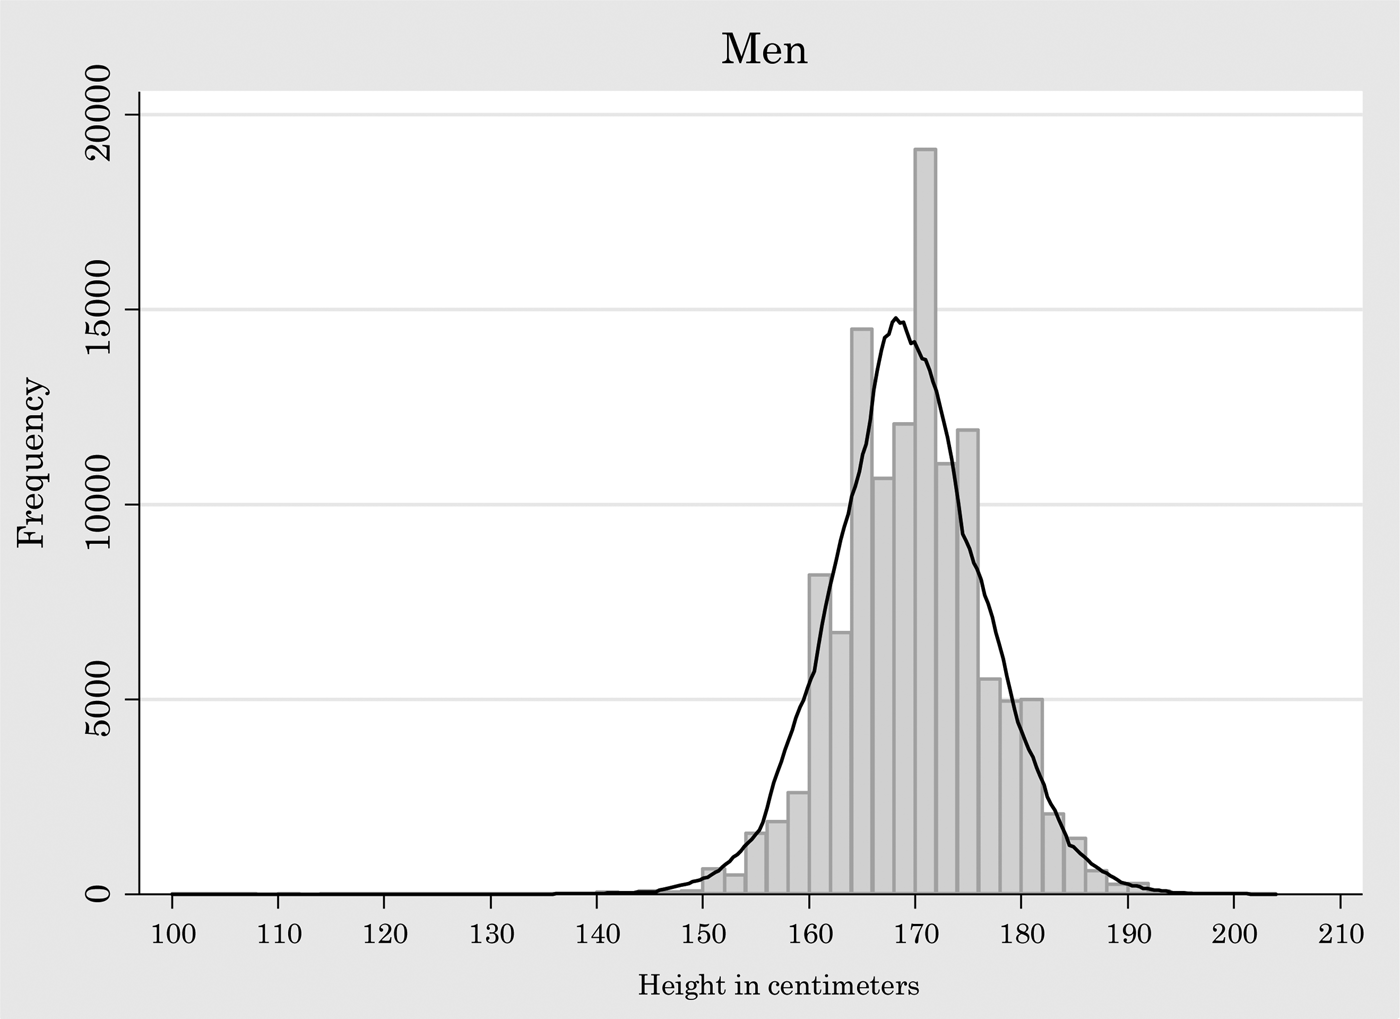
FIGURE A2 FREQUENCY DISTRIBUTION OF MALE HEIGHT.
APPENDIX B
TABLE B1 AVERAGE HEIGHT: SKILLED VS. UNSKILLED WORKERS.
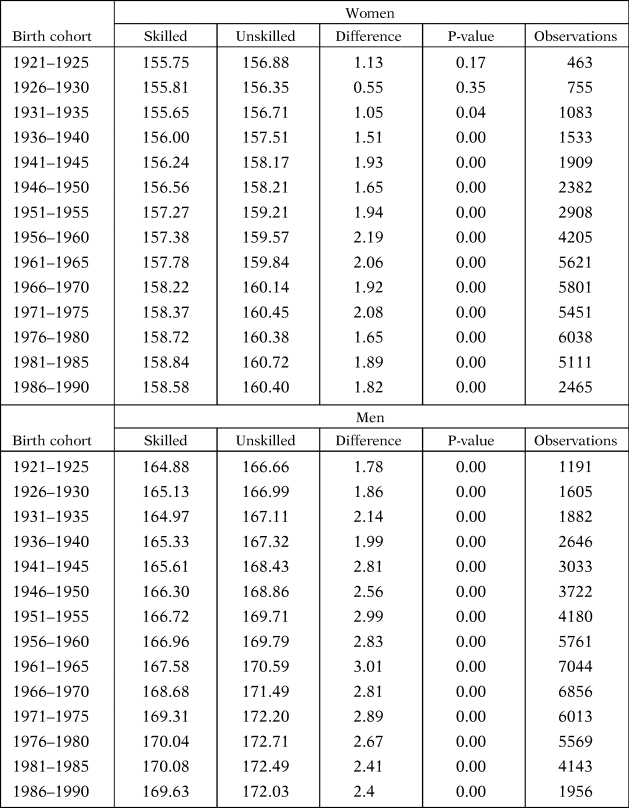
TABLE B2 AVERAGE HEIGHT: SECONDARY VS. TERTIARY EDUCATION.
