Many population studies on the prevalence of mental disorders have been conducted in several countries, including India, during the last few decades (Reference Essen-MollerEssen-Moller, 1956; Reference Leighton, Harding and MacklinLeighton et al, 1963; Reference DubeDube, 1970; Reference Elnaggar, Maitra and RaoElnaggar et al, 1971; Reference Nandi, Ajmany and GanguliNandi et al, 1975). These studies are cross-sectional in nature. They record the mental health status of the cases at the time of the survey. However, they give no indication of any future changes in the mental health status of the whole community.
To assess the changes in the mental health status of an Indian rural community after a long interval, Nandi and colleagues surveyed the same community after 10 years and determined the prevalence of mental disorders in the context of the changing socio-economic status of the community (Reference Nandi, Banerjee and MukherjeeNandi et al, 1986). This study showed that the level of morbidity had not changed significantly after one decade. We now wanted to verify whether this pattern is maintained after two decades.
METHOD
A team of voluntary workers was formed to conduct the study. Each member, under the leadership of the senior author, made personal contact with the villagers in small group meetings; efforts were made to dispel any doubts or prejudice on the part of the villagers, and confidentiality of communication was guaranteed. Once the cooperation of the villagers was assured, a pilot study was undertaken to train the workers in the use of the tools of the survey. All the families were assured of all possible help in the treatment of their sick members if they so wanted.
Sample
All the families of the village of Gambhirgachi, situated in the district of North 24 Parganas (60 km from Calcutta), and all the families of the village of Paharpur in the district of Bankura (32 km from its nearest town) constitute our sample. These villages are situated in the agricultural belt of West Bengal and most of the families live by cultivation. The socio-demographic characteristics of the villagers are presented in the ‘Results’ section, below.
The language used by the villagers, as well as by the voluntary workers, was Bengali, so there was no communication gap or barrier between the two. Culturally, the fact that D.N.N. himself came from a rural background in West Bengal was of significance.
Method
Four schedules were prepared to collect and tabulate the data, as follows:
-
(a) The Household Schedule, which recorded the data connected with family structure, the size of the family, the age of each member, their marital status, education, housing, and identification of the family.
-
(b) The Case Detection Schedule, written in Bengali, contained questions which led to the identification of all possible mental illnesses. The schedule was prepared in consultation with six other psychiatrists, who made additions and alterations as they deemed fit; after incorporating their views, the final draft was prepared. The sensitivity and specificity of this ‘screening scale’ was assessed and found to be highly satisfactory. Reliability and validity were tested and found suitable for use in field settings.
-
(c) The Case Record Schedule gave all relevant information about the case detected through the Case Detection Schedule, and recorded the findings of examination and final diagnosis.
For an operational definition of a case, that in the World Health Organization Technical Report Series (1960) No. 185 was taken as a model, and a minor alteration was made in consultation with six other psychiatrists; the modified version used in the survey resulting was as follows:
‘A manifest disturbance of mental functioning specific enough in clinical character to be consistently recognisable as conforming to a clearly defined standard pattern and severe enough to cause at least partial loss of working or social capacity or both of a degree which can be specified in terms of decrease in quality and/or quantity of work or of the taking of legal or other social action.’
For the formulation of a diagnostic criterion, for each disease the same procedure was followed. Only those who were suffering at the time of examination were accepted as cases, except when the diagnosis was hysteria or epilepsy. In these two instances, manifestation of symptoms at any time during the preceding year was sufficient for inclusion as a case.
-
(d) The Socio-Economic Status Schedule (SES; Reference Pareek and TrivediPareek & Trivedi, 1966), which is standardised for use in the rural area of India, was used to determine the socio-economic status of each family. The SES schedule covered land, caste, farm power, housing, material possessions and leadership in social organisation; the status is quantified numerically and there are five categories. A family scoring up to 13 would be placed in the lowest category (Class V). A family scoring above 42 would be placed in the highest category (Class I). Incidentally, this scale is still deemed a valid research tool by Indian social scientists.
Collection of data
A door-to-door enquiry was made to each family. The data were collected first from the head of the family and again from each adult member of the family, to cross-verify that all the facts had been obtained. Whenever a probable case was detected, a thorough examination, both physical and psychiatric, was made by two senior psychiatrists of the team separately, who made their diagnosis independently. In the event of a divergence of opinion between the two psychiatrists, the case was re-examined and a diagnosis agreed. Cases of divergence of opinion were very few. The psychiatrists had a high level of interrater agreement.
The principal investigator (D.N.N) and three other members of the team who conducted the second survey in 1992 are the same as those who made the first survey in 1972. One of those three (S.P.M.) was the statistical advisor; the other two (G.B. and A.G.) were senior psychiatrists. They took part, along with the principal investigator, in the examination of all probable cases and in diagnosis, in accordance with the diagnostic criteria determined before the beginning of the first survey. The new members of the team (P.S.N. and S.N.) are qualified psychiatrists. They were trained in the use of the tools which were used in both these studies, but they were relatively junior and did not take part in the diagnosis of the cases.
The core of the team, who carried out the examination and diagnosis, was the same in both the surveys (conducted in 1972 and 1992). They followed the case-finding methods and the diagnostic criteria strictly and made the diagnosis in the same way in both the surveys. This strategy was adopted to ensure the comparability of rates of morbidity.
The data obtained by each survey were compiled and computed and variables were dealt with statistically.
Statistical methods used
Data were mostly presented in two-way tables, and the possible association between two classification factors likely or hypothesised to be mutually associated was tested for significance using the standard χ2 tests in contingency tables with k categories for one factor and L for the other. The value of the χ2 statistic obtained was compared with the tabulated percentage ones corresponding to (k-1) × (L-1) degrees of freedom. In a few situations, associations between two factors were tested by using the z-test.
RESULTS
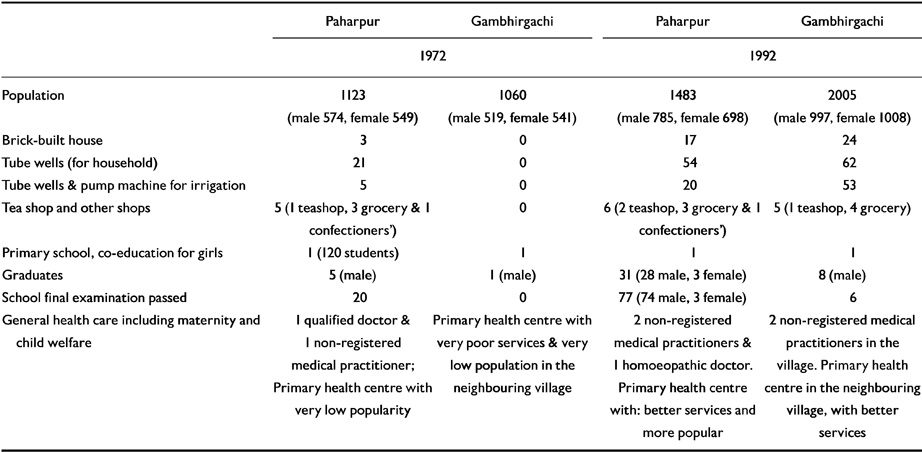
The changes in the socio-demographic characteristics of the community in the two villages (Gambhirgachi and Paharpur) are presented in Table 1. The population in Gambhirgachi has almost doubled during this period, while that of Paharpur has increased by about one-third. The general improvement in the indices of improvement in socio-economic status are however, similar.
Table 1 Change in the socio-demographic characteristics of the community in the villages of Paharpur and Gambhirgachi
| Paharpur | Gambhirgachi | Paharpur | Gambhirgachi | |
|---|---|---|---|---|
| 1972 | 1992 | |||
| Population | 1123 (male 574, female 549) | 1060 (male 519, female 541) | 1483 (male 785, female 698) | 2005 (male 997, female 1008) |
| Brick-built house | 3 | 0 | 17 | 24 |
| Tube wells (for household) | 21 | 0 | 54 | 62 |
| Tube wells & pump machine for irrigation | 5 | 0 | 20 | 53 |
| Tea shop and other shops | 5 (1 teashop, 3 grocery & 1 confectioners') | 0 | 6 (2 teashop, 3 grocery & 1 confectioners') | 5 (1 teashop, 4 grocery) |
| Primary school, co-education for girls | 1 (120 students) | 1 | 1 | 1 |
| Graduates | 5 (male) | 1 (male) | 31 (28 male, 3 female) | 8 (male) |
| School final examination passed | 20 | 0 | 77 (74 male, 3 female) | 6 |
| General health care including maternity and child welfare | 1 qualified doctor & 1 non-registered medical practitioner; Primary health centre with very low popularity | Primary health centre with very poor services & very low population in the neighbouring village | 2 non-registered medical practitioners & 1 homoeopathic doctor. Primary health centre with: better services and more popular | 2 non-registered medical practitioners in the village. Primary health centre in the neighbouring village, with better services |
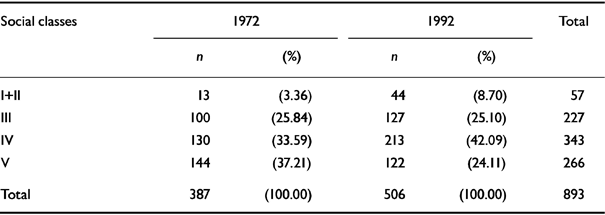
Table 2 Distribution of families according to socio-economic status of the two villages combined
| Social classes | 1972 | 1992 | Total | ||
|---|---|---|---|---|---|
| n | (%) | n | (%) | ||
| I+II | 13 | (3.36) | 44 | (8.70) | 57 |
| III | 100 | (25.84) | 127 | (25.10) | 227 |
| IV | 130 | (33.59) | 213 | (42.09) | 343 |
| V | 144 | (37.21) | 122 | (24.11) | 266 |
| Total | 387 | (100.00) | 506 | (100.00) | 893 |
The distribution of families according to socio-economic status shows that in course of 20 years this has improved. In 1992 the percentage of families in Classes I and II increased, and that in the lowest classes decreased. This change is statistically significant.?
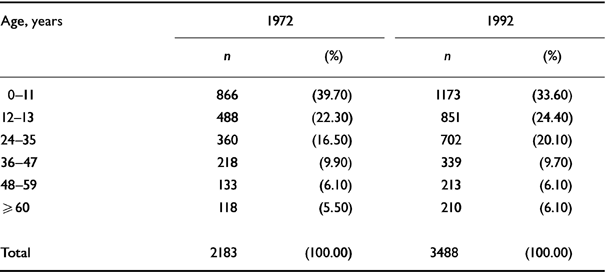
Table 3 Distribution of the total population by age in 1972 and 1992 of the two villages combined (Paharpur & Gambhirgachi)
| Age, years | 1972 | 1992 | ||
|---|---|---|---|---|
| n | (%) | n | (%) | |
| 0-11 | 866 | (39.70) | 1173 | (33.60) |
| 12-13 | 488 | (22.30) | 851 | (24.40) |
| 24-35 | 360 | (16.50) | 702 | (20.10) |
| 36-47 | 218 | (9.90) | 339 | (9.70) |
| 48-59 | 133 | (6.10) | 213 | (6.10) |
| ≥ 60 | 118 | (5.50) | 210 | (6.10) |
| Total | 2183 | (100.00) | 3488 | (100.00) |
Table 4 Comparison between the rate of total mental morbidity in 1972 and in 1992 of the two villages combined

| 1972 | 1992 | |||
|---|---|---|---|---|
| n | (R/1000) | n | (R/1000) | |
| Affected | 255 | (116.8) | 367 | (105.2) |
| Not-affected | 1928 | 3121 | ||
| Total | 2183 | 3488 | ||
Table 5 Affected families, from surveys in 1972 and 1992

| Social classes | Families with a member suffering from a psychiatric illness | ||||||
|---|---|---|---|---|---|---|---|
| 1972 | Total no. of families | 1992 | Total no. of families | Z-test | |||
| No. affected | (%) | No. affected | (%) | ||||
| I+II | 11 | (84.62) | 13 | 22 | (50.00) | 44 | 1.37 NS |
| III | 63 | (63.00) | 100 | 69 | (58.33) | 127 | 0.84 NS |
| IV | 65 | (50.00) | 130 | 98 | (46.00) | 213 | 0.16 NS |
| V | 52 | (36.11) | 144 | 50 | (40.98) | 122 | 0.19 NS |
| Total | 191 | (49.35) | 387 | 387 | (47.23) | 506 | |
The distribution of affected families according to socio-economic status shows that the higher classes had higher rates of morbidity in both 1972 and 1992. In 1992, however, the trend is not so clear-cut as in 1972. The difference in rates of morbidity is, however, statistically not significant.
Table 6 shows that the rate of morbidity was higher in women than in men in the base year (1972), and this trend was not changed significantly after 20 years.
Table 6 Distribution of affected persons in 1972 and 1992 in the two villages combined

| 1972 | 1992 | |||||
|---|---|---|---|---|---|---|
| Total no. | No. affected | (R/1000) | Total no. | No. affected | (R/1000) | |
| Male | 1093 | 95 | 86.9 | 1782 | 131 | 73.5 |
| Female | 1090 | 160 | 146.8 | 1706 | 236 | 138.3 |
| Total | 2183 | 255 | 116.8 | 3488 | 367 | 105.2 |
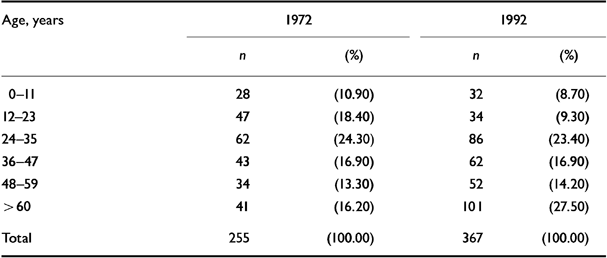
Table 7 shows that the rate of morbidity in the younger age group (under 23 years) has dropped remarkably over the 20 years (from 29.3% to 18.0%). On the other hand, morbidity in the elderly group (over 60 years) has increased significantly.
Table 7 Age distribution of affected persons in 1972 and 1992 in the two villages combined
| Age, years | 1972 | 1992 | ||
|---|---|---|---|---|
| n | (%) | n | (%) | |
| 0-11 | 28 | (10.90) | 32 | (8.70) |
| 12-23 | 47 | (18.40) | 34 | (9.30) |
| 24-35 | 62 | (24.30) | 86 | (23.40) |
| 36-47 | 43 | (16.90) | 62 | (16.90) |
| 48-59 | 34 | (13.30) | 52 | (14.20) |
| > 60 | 41 | (16.20) | 101 | (27.50) |
| Total | 255 | (100.00) | 367 | (100.00) |
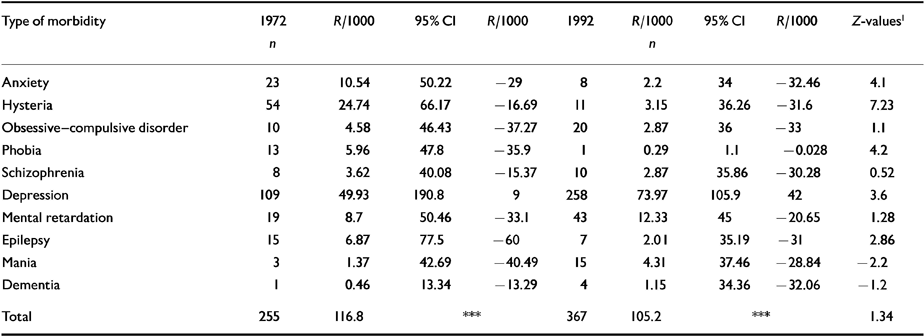
The distribution of different types of illness is shown in Table 8 as rates per 1000. The difference between the morbidity rates in 1972 and 1992 by diagnosis is statistically highly significant (χ=11.1746, d.f.=9, P>0.01).
Table 8 Distribution of type of morbidity in 1972 and 1992 (rates per 1000)
| Type of morbidity | 1972 | R/1000 | 95% Cl | R/1000 | 1992 | R/1000 | 95% Cl | R/1000 | Z-values1 |
|---|---|---|---|---|---|---|---|---|---|
| n | n | ||||||||
| Anxiety | 23 | 10.54 | 50.22 | -29 | 8 | 2.2 | 34 | -32.46 | 4.1 |
| Hysteria | 54 | 24.74 | 66.17 | -16.69 | 11 | 3.15 | 36.26 | -31.6 | 7.23 |
| Obsessive-compulsive disorder | 10 | 4.58 | 46.43 | -37.27 | 20 | 2.87 | 36 | -33 | 1.1 |
| Phobia | 13 | 5.96 | 47.8 | -35.9 | 1 | 0.29 | 1.1 | -0.028 | 4.2 |
| Schizophrenia | 8 | 3.62 | 40.08 | -15.37 | 10 | 2.87 | 35.86 | -30.28 | 0.52 |
| Depression | 109 | 49.93 | 190.8 | 9 | 258 | 73.97 | 105.9 | 42 | 3.6 |
| Mental retardation | 19 | 8.7 | 50.46 | -33.1 | 43 | 12.33 | 45 | -20.65 | 1.28 |
| Epilepsy | 15 | 6.87 | 77.5 | -60 | 7 | 2.01 | 35.19 | -31 | 2.86 |
| Mania | 3 | 1.37 | 42.69 | -40.49 | 15 | 4.31 | 37.46 | -28.84 | -2.2 |
| Dementia | 1 | 0.46 | 13.34 | -13.29 | 4 | 1.15 | 34.36 | -32.06 | -1.2 |
| Total | 255 | 116.8 | *** | 367 | 105.2 | *** | 1.34 | ||
The Z-test of the rates in each diagnostic category at the two points in time indicates that the difference is statistically highly significant for anxiety, hysteria, phobia, depression, and epilepsy. The difference in the rates of mania is significant at the 5% level. Except for depression and mania, each diagnostic category showed a downward trend in morbidity.
DISCUSSION
Total morbidity in 1972 and 1992
Until prospective surveys are conducted for the assessment of mental morbidity of a community by the same method and preferably by the same team of workers, it may not be possible to determine how far that community shows changes in the prevalence of mental morbidity over the years.
In this context the prevalence figures obtained by us in two surveys conducted 20 years apart deserve careful consideration. The core team members and the method followed in both the surveys are the same. The almost identical rates of mental morbidity (116.8 and 105.2 per 1000) (Table 4) observed after 20 years may suggest that the community has maintained a remarkable stability in its total mental morbidity over the years. In their longitudinal study of the natural history of mental disorders, Nandi et al (Reference Nandi, Banerjee and Ganguli1978) identified two categories of opposing factors which regulated this stability. One category increased the morbidity rate: viz, the incidence of new cases and migration of sick people into the village. Factors causing a decrease of the morbidity rate were: (a) recovery of cases; (b) death of cases; (c) migration of sick people out of the village; and (d) an increase in the number of healthy people due to birth and migration. The popular notion that mental disorder is on the increase is not borne out by the data obtained by us in this rural survey.
Gender distribution
In 1972 women showed a higher rate of mental morbidity than men. After two decades this pattern had not changed: the higher rate of morbidity in women persisted. Many field studies conducted in different parts of India have shown this greater vulnerability of women to mental illness (Reference Sethi, Gupta and RajkumarSethi et al, 1967; Reference DubeDube, 1970; Reference Nandi, Ajmany and GanguliNandi et al, 1975). The point to be emphasised here is that this pattern has remained stable over a long period of time (1972, males 86.9 per 1000; females 146.8 8 per 1000; 1992, males 73.5 per 1000; females 138.3 3 per 1000) (Table 6). One should not, however, miss the important fact that there is a downward trend in the prevalence of mental disorder in both men and women (men: <13.4 per 1000; women: <8.5 per 1000). Though this trend is not statistically significant, either within group or between groups, it may assume some importance in the coming decades. Women, having a higher morbidity rate, are showing a slower rate of decrease over a given period of time.
Age distribution
The age distribution of the affected persons in 1972 and 1992 shows that the rate of morbidity was higher in the under-23 years old age group in 1972 than in the corresponding age group in 1992 (29.3% and 18% respectively) (Table 7). The morbidity of the older age group (aged ≥48 years) is in clear contrast to this pattern: in 1972 it was 29.5%, while in 1992 it rose to 41.7%. It must be pointed out that this shift in the pattern of morbidity by age did not significantly alter the total morbidity of the community after 20 years. So, one may presume that the younger age group in this community became a mentally healthier group in the course of time. Could this be associated with the change in the general outlook of the community, with better prospects for jobs, shelter, medical aid and income generation? This point requires exploration.
Type of illness
The rates of depressive illness and mania have increased significantly over the years, but the rates of anxiety, hysteria, epilepsy and phobia have declined (Table 8). The increase in the rate of mental deficiency (though statistically not significant), and the significant fall in the rate of epilepsy may be partly explained by improved medical care and maternity and child welfare measures which have become available in the community during the last 20 years, which will have increased the longevity of the mentally retarded and also decreased one of the potent causes of incidence of epilepsy. In one of our previous studies (Reference Nandi, Banerjee and NandiNandi et al, 1992) we have drawn attention to the persistent downward trend in the rate of hysteria in a rural community over the years and postulated (on the basis of available data) that this may be associated with a persistent rise of the economic status of women in that community.
The social constructs regarding the mechanism of symptom formation postulate that symptoms have special meanings in relation to the shared belief of a community about the nature of an illness (Reference Murphy, Wittkower and ChanceMurphy et al, 1964). In cases of hysteria in the community under study (the majority of whom are women), the dramatic abnormal behaviour is perceived by significant others as the manifestation of a major disorder. Women often live in a state of economic dependence forced on them by the family and by society at large. Being stricken by a major illness such as hysteria often ensures attention and softens strong expressions of emotion from members of the family.
The relationship between the economic dependence of women and their vulnerability to hysteria deserves careful scrutiny. In a study of contagious hysteria in a village near Calcutta, Nandi et al (Reference Nandi, Banerjee and Bera1985) found that the frequency of seizures decreased during the last three years of a decade of illness. During this period women were allowed, for the first time, to work outside their homes for a wage, and they became economically less dependent on their husbands. As the women's self-confidence increased, their episodes of hysterical fits declined. In their survey of several villages in West Bengal, Nandi et al (Reference Nandi, Mukherjee and Boral1980) found a higher rate of hysteria in the lower socio-economic classes.
The rise in the rate of depression is consistent with the findings of other recent studies reviewed by Singh (Reference Singh1979) and by Nandi et al (Reference Nandi, Banerjee and Nandi1992). The change in lifestyles and in the inner life of the people in an upwardly mobile society during the last 20 years is unmistakable. In a recent study of both Indian and Western patients with depression (Reference Ananth, Engelsman and GhadirianAnanth et al, 1993), it was found that 62% (74 out of 119) of the Indian patients suffered from guilt as compared with 84% of the Western patients (96 out of 114). Studies conducted in the 1960s and 1970s reported a low prevalence (varying between 5.3% and 26.7%) of guilt feelings in Indian patients with depression (Reference Murphy, Wittkower and ChanceMurphy et al, 1964; Reference Venkoba RaoVenkoba Rao, 1966; Reference Bagadia, Jeste and DaveBagadia et al, 1973). Carstairs & Kapur (Reference Carstairs and Kapur1976), in their survey of a rural community in Karnataka, India, found that the rate of depression was 30.0 per 1000; Nandi et al (Reference Nandi, Banerjee and Nandi1992) reported that the rate of depression in a village in West Bengal rose from 37.7 per 1000 to 53.3 per 1000 after an interval of 10 years.
The declining prevalence of phobia, to the extent that it has almost disappeared from the community under study, is an enigma.
Socio-economic status (SES)
The SES scale used in the survey showed a significant change in the SES of the community over the course of time (20 years). There was a trend of upward mobility of the families in 1992 (Table 2). Hints of this upward mobility are in the indices of SES recorded in Table 1. The spread of education, improved health facilities and better inputs (seeds, irrigation, fertilizers, insecticides) in farming must have influenced the quality of life of the people. But this had little impact on the distribution of affected families in different classes (Table 5). In 1972, the higher classes had higher rates of affected families. The pattern in 1992 was similar. The rate of families affected in the two upper Classes (I and II), taken together, was higher than that in Classes IV and V (though statistically not significant). It is, therefore, evident that the pattern of higher rates of morbidity in higher classes is a stable characteristic of this community and is maintained over the course of time, but one should not read too much into it, as the difference in morbidity falls short of statistical significance. In this context it may be noted that in one of our earlier surveys of a group of villages in West Bengal (Reference Nandi, Banerjee and BoralNandi et al, 1979) the prevalence of mental morbidity was found to be higher in the higher classes. In his follow-up study of a sample of population surveyed by Essen-Moller in 1947 (Reference Essen-MollerEssen-Moller, 1956), Hagnell was able to confirm this finding in relation to social and economic classes both at the beginning and the end of the 10-year follow-up period (Reference HagnellHagnell, 1966).
Clinical Implications and Limitations
CLINICAL IMPLICATIONS
-
▪ After 20 years the level of morbidity — relative proportion of the morbid stock to the total population — did not change significantly.
-
▪ The morbidity pattern — relative proportion of the type of morbidity to the total population — showed a remarkable change. The rates of anxiety, hysteria and phobia dropped, while those of depression, learning disability and dementia increased.
-
▪ The higher rate of total morbidity in women persisted.
LIMITATIONS
-
▪ The sample is relatively small and is not representative.
-
▪ For the sake of comparability of results, the method adopted in 1972 had to be repeated in 1992. It was not possible, therefore, to use more sophisticated methods in 1992.
-
▪ The diagnostic criteria were developed by us specifically for our study. Precise and widely accepted diagnostic criteria (e.g. ICD-10 or DSM-IV) were not available to us in 1972.


eLetters
No eLetters have been published for this article.