


Introduction
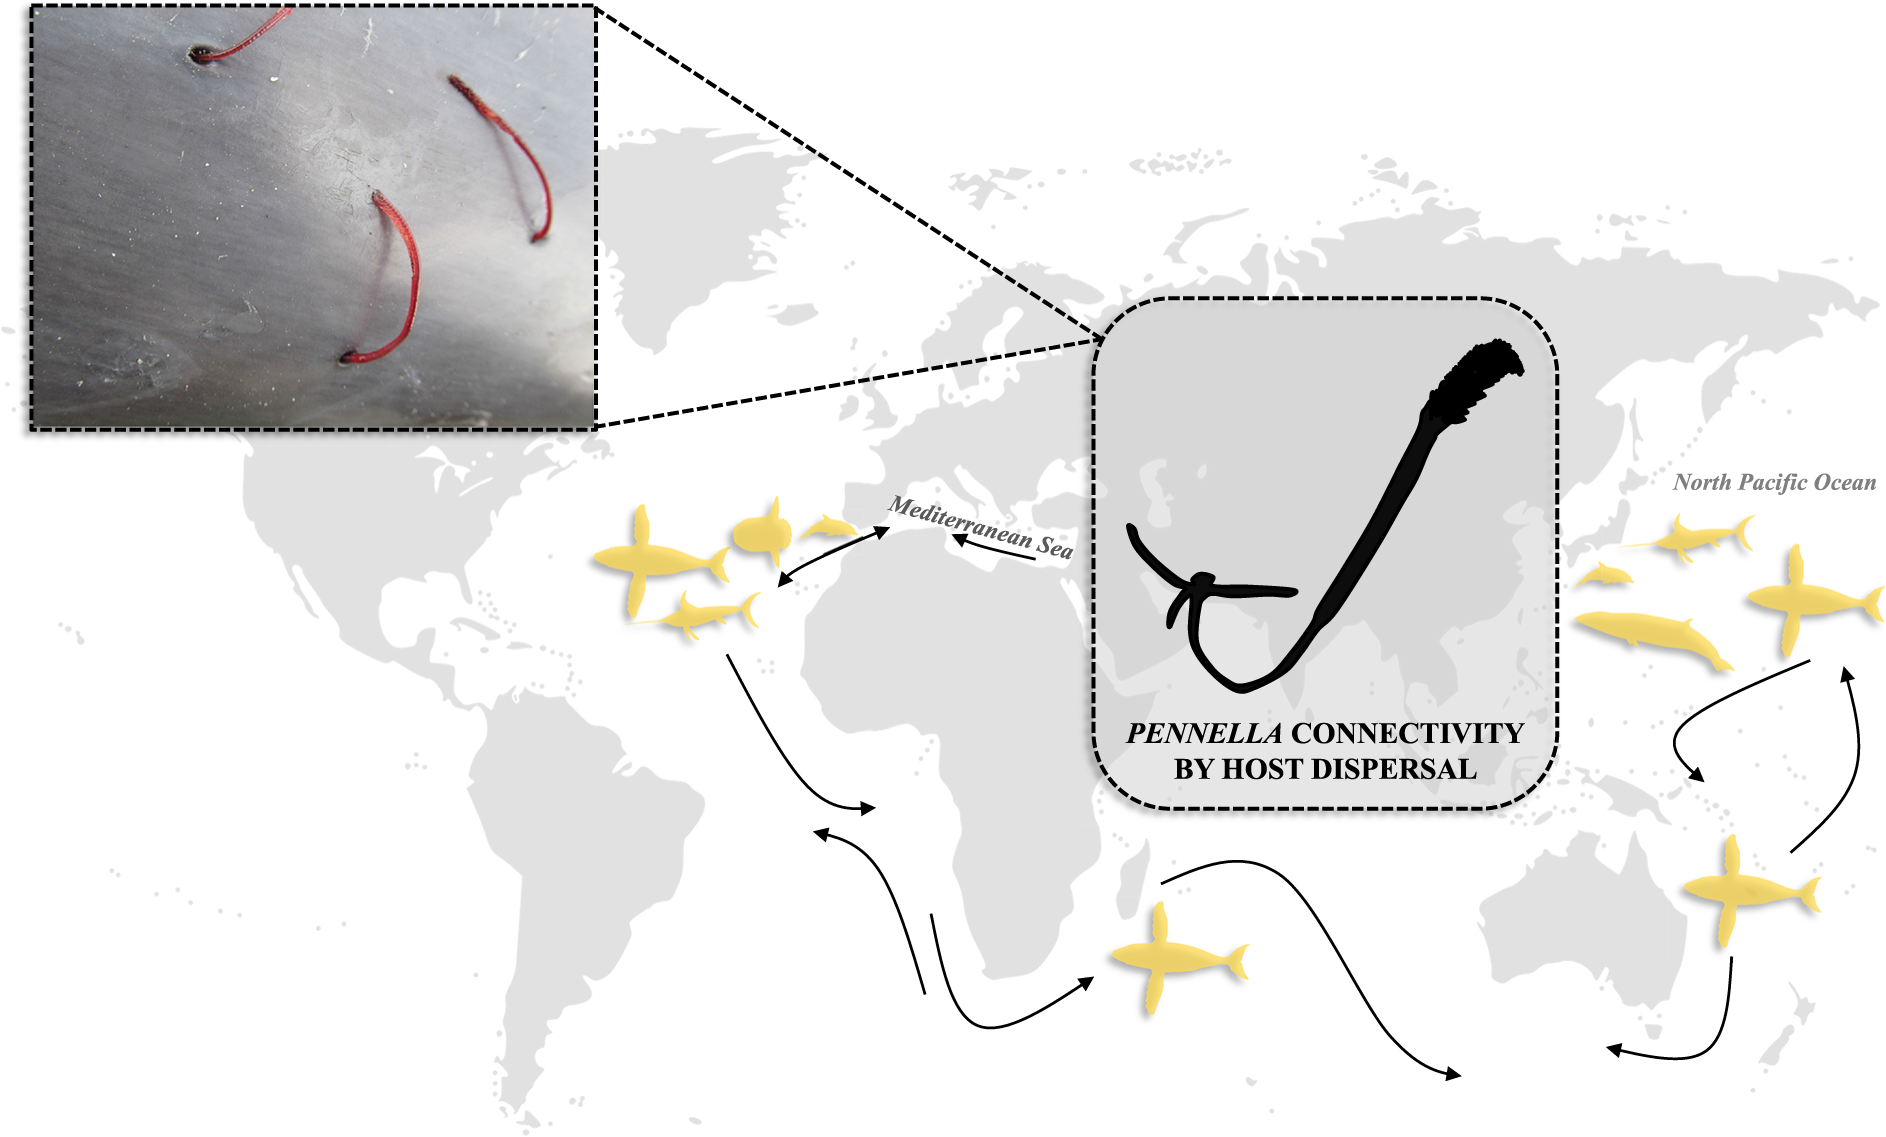
Copepods of the genus Pennella Oken, 1815 (Order Siphonostomatoida) are circumglobal marine parasites that infect a broad range of animals, including cetaceans, teleosts, and cephalopods. Their complete life cycle remains unknown. In the sister genus Lernaeenicus Lesueur, 1824, there is a ca. 2-day planktonic phase with two naupliar stages. The planktonic phase is followed by a copepodid stage that infects an intermediate host, on which the parasite undergoes three chalimus stages before mating, then the inseminated female seeks a definitive host on which it attaches, metamorphoses, and releases over 1,000 eggs (Whitfield et al., Reference Whitfield, Pilcher, Grant, Riley, Boxshall and Schminke1988; Izawa, Reference Izawa2019). It is believed that Pennella spp. use flatfish or cephalopods as intermediate hosts for mating, and fertilized females then infect the definitive host (i.e. a cetacean or teleost). Fertilized females remain partly embedded in the host’s skin and blubber and feed on body fluids while leaving their trunk, abdomen, and gills hanging outside (Turner, Reference Turner1905; Kabata, Reference Kabata1979; Anstensrud, Reference Anstensrud1992; Arroyo et al., Reference Arroyo, Abaunza and Preciado2002; Boxshall et al., Reference Boxshall, Lester, Grygier, Hoeg, Glenner, Shields and Lützen2005). Heavy infections of Pennella spp. have been associated with increased mortality in small fish (Suyama et al., Reference Suyama, Miyamoto and Fuji2021a), whereas in cetaceans they can indicate poor host health (Vecchione and Aznar, Reference Vecchione and Aznar2014; Chaieb et al., Reference Chaieb, Ten and Aznar2024).
The taxonomy of the genus Pennella has traditionally been based on female morphology (e.g. number of antennae or cephalothorax shape) and the identity of the definitive hosts. Recent efforts using these two criteria have progressively reduced the number of species from dozens to nine: P. filosa (Linnaeus, 1758), P. balaenoptera Koren & Danielssen, 1877, P. sagitta Linnaeus, 1758, P. benzi Hogans, Reference Hogans2017, P. instructa Wilson, 1917, P. makaira Hogans, 1988, P. exocoeti (Holten, 1802), P. diodontis Oken, 1816, and P. hawaiiensis Kazachenko & Kurochkin, 1974 (Hogans, Reference Hogans2017 and references therein). Recently, Suyama et al. (Reference Suyama, Yanagimoto, Nakai, Tamura, Shiozaki, Ohshimo and Chow2021b) examined over one hundred specimens of north Pacific and Mediterranean origin and proposed a total of 2–3 Pennella species complexes based on morphological traits. First, the P. sagitta species complex – also named Group I – is composed of fish parasites that have large branched antennary processes and a total length ≤90 mm (Suyama et al., Reference Suyama, Masuda, Yanagimoto and Chow2019; Reference Suyama, Yanagimoto, Nakai, Tamura, Shiozaki, Ohshimo and Chow2021b). Second, the P. filosa complex is composed of large-sized pennellids, with a total length >80 mm, that lack branched antennary processes (i.e. Groups II and III; Suyama et al., Reference Suyama, Yanagimoto, Nakai, Tamura, Shiozaki, Ohshimo and Chow2021b); this complex includes P. filosa, P. benzi and P. instructa, all of which infect teleosts (Fraija-Fernández et al., Reference Fraija-Fernández, Hernández-Hortelano, Ahuir-Baraja, Raga and Aznar2018; Suyama et al., Reference Suyama, Yanagimoto, Nakai, Tamura, Shiozaki, Ohshimo and Chow2021b), as well as P. balaenoptera, which has been documented on over 20 cetacean species and once on a pinniped (Dailey et al., Reference Dailey, Haulena and Lawrence2002; Ten et al., Reference Ten, Raga and Aznar2022). In fact, Fraija-Fernández et al. (Reference Fraija-Fernández, Hernández-Hortelano, Ahuir-Baraja, Raga and Aznar2018) previously suggested that P. balaenoptera could be synonymized with P. filosa based on morphological and molecular evidence. Lastly, the small-sized P. makaira, parasitic on swordfish, could not be assigned to any of these two complexes due to insufficient morphological data and some confusing traits (Suyama et al., Reference Suyama, Yanagimoto, Nakai, Tamura, Shiozaki, Ohshimo and Chow2021b).
Morphology, however, may be of limited use for species delimitation in the genus Pennella since specimens show great morphological plasticity depending on ontogenetic development (e.g. parasites recently attached to the definitive host lack antennae), and on the host and attachment site (Kabata, Reference Kabata1979; Hogans, Reference Hogans1987). Given this high morphological polymorphism and the convergent traits shared among the Pennellidae (e.g. Castro-Romero et al., Reference Castro-Romero, Montes, Martorelli, Sepulveda, Tapia and Martínez-Aquino2016; Yumura et al., Reference Yumura, Adachi, Nitta, Kondo, Komeda, Wakabayashi, Fukuchi, Boxshall and Ohtsuka2022), molecular techniques become particularly relevant for studying the taxonomy of this group. However, the available evidence (see Suyama et al., Reference Suyama, Yanagimoto, Nakai, Tamura, Shiozaki, Ohshimo and Chow2021b) indicates a clear incongruence between morphological and molecular data, suggesting that species delimitation within the genus is still challenging.
Also, host identity is no longer a robust criterion for species delimitation. The proposed species complex P. filosa stands out for its very low host specificity and it shares a host species (i.e. the ocean sunfish) with the putative species complex P. sagitta. These pennellids are unique among metazoan parasites as they are able to parasitize a great diversity of both fish (e.g. swordfish, sunfish, or pufferfish) and cetaceans, including whales and dolphins, from all oceans. The low host specificity and global distribution of Pennella cf. filosa (and, potentially, of other Pennella spp.) suggest that the degree of population structure is probably low, but this hypothesis has never been addressed.
The present study investigates the phylogeography and host specificity of members of Pennella based on data from the cytochrome c oxidase subunit 1 (COI) mitochondrial gene. COI has been, by far, the most commonly used DNA barcoding marker for siphonostomatoid copepods, not only in phylogenetic and phylogeographic studies, but also for species delimitation and for investigating genetic differences between hosts (e.g. Boulding et al., Reference Boulding, DeWaard, Ang and Hebert2009; Dippenaar, Reference Dippenaar2009; Dippenaar et al., Reference Dippenaar, Mathibela and Bloomer2010; Mangena et al., Reference Mangena, Jordaan and Dippenaar2014; Morales-Serna et al., Reference Morales-Serna, Pinacho-Pinacho, Gómez and de León2014; Skern-Mauritzen et al., Reference Skern-Mauritzen, Torrissen and Glover2014; Castro-Romero et al., Reference Castro-Romero, Montes, Martorelli, Sepulveda, Tapia and Martínez-Aquino2016). We first provided new morphological and genetic (i.e. COI) data from a number of specimens of Pennella cf. filosa (syn. P. balaenoptera) collected in the western Mediterranean, then we assessed their position in the phylogeny of Pennella and revisited species delimitation after Suyama et al. (Reference Suyama, Yanagimoto, Nakai, Tamura, Shiozaki, Ohshimo and Chow2021b). Secondly, for the phylogeographic and host specificity analyses we used all available sequences of Pennella spp. since the taxonomy of the genus was unresolved. In particular, we examined the genetic differentiation between specimens collected in the Mediterranean Sea and north Pacific Ocean, and explored other factors that might contribute to genetic structuring, i.e. host identity and degree of host vagility between oceanic basins.
Materials and methods
Data collection
A total of 60 parasites tentatively identified as Pennella filosa (syn. P. balaenoptera) – see Results – were obtained from six dead whales stranded along the coast of Spain, ranging from 40°31.50’N, 0°31.00’E to 37°50.70’N, 1°37.50’W, and a dead swordfish found in Castellón, 39°58.17’N 0°00.84’E (Table 1). Permission and funding to collect stranded animals were given by the Wildlife Service of the Valencian Regional Government, Spain. Some parasites lost the cephalothorax during collection, but they could all be identified following morphological criteria (e.g. Abaunza et al., Reference Abaunza, Arroyo and Preciado2001; Hogans, Reference Hogans2017).
Table 1. Studied specimens of Pennella cf. filosa (syn. P. balaenoptera) from six stranded whales and a swordfish, all from the western Mediterranean. The number (n) of specimens examined morphologically and sequenced is indicated
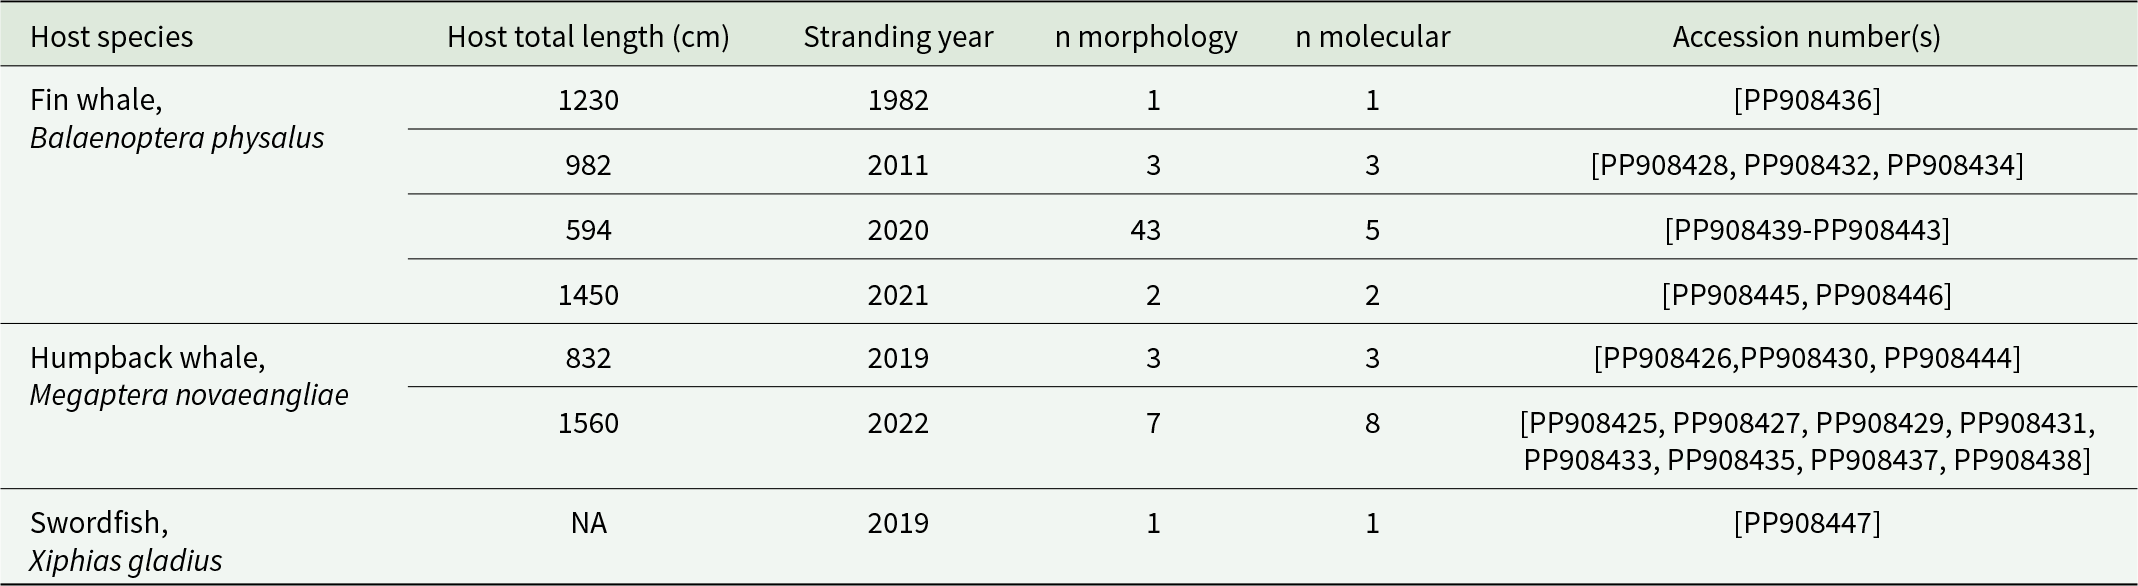
A subset of 23 specimens was selected for molecular identification and phylogeographic analyses. The selected subset allowed for the investigation of differentiation between specimens from different hosts and, in some cases, between those collected from the same host individual (Table 1). We used the DNeasy Blood & Tissue Kit (QIAGEN) for DNA extraction from ca. 2 mm3 of tissue from the trunk or neck of each specimen. Partial mitochondrial cytochrome c oxidase subunit I (COI) was amplified with a Pennella-specific primer pair designed by Suyama et al. (Reference Suyama, Kakehi, Yanagimoto and Chow2020): HijikiCOI-F (5′-GGATATTGGRACTTTGTACTTATTAAG-3′) and HijikiCOI-R (5′-AAAAATCAAAATAAATGCTGG-3′), each at a concentration of 5 pmol/μl. PCR reaction mixtures had a final volume of 20 μl, with 2 μl DNA, 4.8 μl molecular grade water, 1.6 μl of each primer, and 10 μl MyFi™ DNA Polymerase (BioLine, Meridian Life Science Inc., Taunton, MA, USA). Thermocycling profiles for gene amplification were as follows: initial denaturation at 94°C for 5 min, 38 cycles of 94°C for 45 s, 50°C for 45 s, 72°C for 80 s; and a final extension at 72°C for 7 min. Positive and negative (no DNA) controls were used in each PCR.
Aliquots of 2 μl of each amplicon were mixed with 2 μl of loading dye and run on an agarose gel (1% gel; 0.4 g agar powder and 40 ml TE buffer) stained with 1 μl GelRed® Nucleic Acid Gel Stain (Biotium, Hayward, CA, USA) for electrophoresis. The bands were visualized and photographed using an ultraviolet light hood. Amplicons were purified with the Nucleospin® PCR and Gel Purification Clean-up kit (Macherey-Nagel, Düren, Germany) and were sent to Macrogen Europe (Amsterdam, Netherlands) for sequencing with the HijikiCOI primer pair. Sequence identity was verified using the Basic Local Alignment Search Tool (BLAST; https://blast.ncbi.nlm.nih.gov/Blast.cgi). All 23 sequences were uploaded to GenBank (see accession numbers in Table 1).
The 23 COI sequences, along with the other 166 available COI sequences of Pennella spp. in GenBank (searched until January 2024; including those in Fraija-Fernández et al., Reference Fraija-Fernández, Hernández-Hortelano, Ahuir-Baraja, Raga and Aznar2018; Suyama et al., Reference Suyama, Yanagimoto, Nakai, Tamura, Shiozaki, Ohshimo and Chow2021b; Table S1) and 10 outgroups (see Fraija-Fernández et al., Reference Fraija-Fernández, Hernández-Hortelano, Ahuir-Baraja, Raga and Aznar2018), were aligned using MUSCLE within Geneious Prime 2024.0 (https://www.geneious.com) with default settings. The alignment length was 447 bp. We found no evidence that any of the 189 Pennella sequences were nuclear-mitochondrial DNA segments (NUMTs), i.e. mitochondrial DNA fragments inserted into the nuclear genome as non-functional pseudogenes (Porter and Hajibabaei, Reference Porter and Hajibabaei2021; Xue et al., Reference Xue, Moreira, Smith and Fetterman2023). For this purpose, we checked for the presence of indels or stop codons and double peaks in the Sanger chromatogram (for those available), and compared GC content and translation to that of a complete COI gene of Pennella sp. (GenBank accession number: ON161759). Details of all the aligned sequences, including host identity and morphological identification, are provided in Table S1.
Phylogenetic position and genetic structure
The resulting alignment of 189 sequences was used to investigate phylogenetic relationships between the 23 new Mediterranean specimens and those from the two species complexes proposed by Suyama et al. (Reference Suyama, Yanagimoto, Nakai, Tamura, Shiozaki, Ohshimo and Chow2021b), i.e. P. sagitta and P. filosa, and also with the unclassified sequences. Phylogenetic analyses were performed with the General Time Reversible (GTR) nucleotide substitution model with a Gamma rate of variation, selected according to the Akaike Information Criterion (AIC) by jModelTest (Guindon and Gascuel, Reference Guindon and Gascuel2003; Darriba et al., Reference Darriba, Taboada, Doallo and Posada2012) on the CIPRES Science Gateway server (Miller et al., Reference Miller, Pfeiffer and Schwartz2010). A Bayesian analysis was performed in MrBayes 3.2.7 (Huelsenbeck et al., Reference Huelsenbeck, Ronquist and Hall2001), and posterior probability distributions were generated by four simultaneously running Markov chains using 10 M generations. We considered that convergence was achieved if the potential scale reduction factor (PSRF) ∼ 1 and the average standard deviation of split frequencies (ASDSF) ∼ 0.01 (in MrBayes). The stationarity of the runs was assessed by plotting MCMC generations versus the log-likelihood values of the data in Tracer v1.7.2 (Rambaut and Drummond, Reference Rambaut and Drummond2009). Also, an effective sample size (ESS) >200 for each parameter was considered acceptable; this was also checked in Tracer. A total of 25% of the trees were discarded as burn-in. For the Maximum Likelihood (ML) analysis, conducted in RAxML (Stamatakis, Reference Stamatakis2014), we set the number of bootstrap replications to 1 M. Tree topologies of the Bayesian and ML trees were checked for congruence using the program FigTree v.1.4.4 (Rambaut, Reference Rambaut2010).
We also examined potential drivers of genetic differentiation, i.e. the (1) geographic region of the sample (north Pacific vs. western Mediterranean), (2) degree of dispersal of the hosts (samples from host species with interoceanic dispersal and genetic exchange vs. hosts with a smaller distribution range within an ocean basin; see Table S2), and (3) host taxon (i.e. members of the classes Teleostei and Mammalia, and between teleost orders and cetacean superfamilies). Note that all available sequences from the Mediterranean Sea were identified as P. filosa (syn. P. balaenoptera). To this end, we firstly built a parsimony haplotype network (TCS) of the 189 sequences with PopART (Clement et al., Reference Clement, Snell, Walke, Posada and Crandall2002; Leigh and Bryant, Reference Leigh and Bryant2015). This approach was considered pertinent due to the nature of our dataset, i.e. low genetic divergence (see Suyama et al., Reference Suyama, Yanagimoto, Nakai, Tamura, Shiozaki, Ohshimo and Chow2021b) and the observed reticulate relationships (see Results and, e.g. Bandelt et al., Reference Bandelt, Forster and Rohl1999; Clement et al., Reference Clement, Posada and Crandall2000). In any case, TCS topology was very similar to that of Median-joining (MJN) and Minimum-spanning (MSN) networks, also built with PopART. A reticulate network based on distance corrected with the Kimura 2-parameter (K2P) and uncorrected p-distances was generated with the NeighborNet algorithm in SplitsTree v.4.19.2 (Bryant and Huson, Reference Bryant and Huson2023).
Secondly, analyses of molecular variance (AMOVA) were conducted using the software ARLEQUIN version 3.5.2.2 (Excoffier and Lischer, Reference Excoffier and Lischer2010) to test for significant differentiation among (1) geographic regions, (2) types of host dispersal, (3) host taxa (i.e. teleosts vs. cetaceans, including mysticetes and odontocetes), and also (4) the five haplogroups identified by the parsimony haplotype network (see Results). To test for population structure, pairwise differences in fixation index (FST) were also calculated for the five haplotype groups and significance was evaluated with 10,000 permutations. Nucleotide evolutionary divergence between (and within) groups was estimated using the K2P model in MEGA11. The rate variation among sites was modeled with a gamma distribution, following AIC-based model selection from the jModel test (see above), and the number of bootstrap replicates was set to 1,000. Nucleotide divergence among host taxa was also estimated separately for western Mediterranean and north Pacific samples to account for the possible effect of geographic region.
Species delimitation
With only COI sequences available, we attempted to identify potentially differentiated genetic lineages within Pennella using a multi-step (exploratory) approach with all 189 sequences. First, we used the distance-based approaches ABGD (Automatic Barcode Gap Discovery; Puillandre et al., Reference Puillandre, Lambert, Brouillet and Achaz2012) and ASAP (Assemble Species by Automatic Partitioning; Puillandre et al., Reference Puillandre, Brouillet and Achaz2021). For ABGD, we set the intraspecific prior divergence between 0.001 and 0.1. Both methods were run twice with simple distance and K2P evolution models, respectively, on their web interfaces (https://bioinfo.mnhn.fr/abi/public/abgd/ and https://bioinfo.mnhn.fr/abi/public/asap/).
Second, we used the Bayesian implementation of Poisson Tree Processes (bPTP; http://species.h-its.org/ptp/; Zhang et al., Reference Zhang, Kapli, Pavlidis and Stamatakis2013). PTP is considered to efficiently deal with single-locus data (Tang et al., Reference Tang, Humphreys, Fontaneto and Barraclough2014), and it was preferred over GMYC models (generalized mixed Yule-coalescent; Pons et al., Reference Pons, Barraclough, Gomez-Zurita, Cardoso, Duran, Hazell, Kamoun, Sumlin and Vogler2006), another tree-based approach, because it does not require time calibration (an error-prone process; Zhang et al., Reference Zhang, Kapli, Pavlidis and Stamatakis2013; Dumas et al., Reference Dumas, Barbut, Le Ru, Silvain, Clamens, d’Alençon and Kergoat2015). We used the ML tree without outgroups (created following the methodology above) as the input to improve the delimitation results (Zhang et al., Reference Zhang, Kapli, Pavlidis and Stamatakis2013). The number of MCMC generations was set to 200,000 and the other parameters were left as default. We checked for PTP convergence by visual inspection of the likelihood plot (Zhang et al., Reference Zhang, Kapli, Pavlidis and Stamatakis2013).
Results
Morphological identification of new Mediterranean specimens
Specimens were large pennellids (see Hogans, Reference Hogans2017), with minimum estimated total lengths of approximately 100 mm. In five intact specimens, total lengths ranged from 113.0 to 275.0 mm (mean ± SD: 150.3 ± 33.5 mm). The abdomen (mean length: 17.5 ± 9.6 mm, n = 16; Figure 1A) was dark brown and exhibited numerous abdominal plumes expanding outwards; the trunk (mean length: 19.9 ± 12.7 mm, n = 48; mean maximum width: 1.8 ± 1.7 mm, n = 40) was similar in color and presented a striated contour. Eight larger specimens (estimated mean total length: 219.0 ± 48.0 mm) presented egg strings that emerged from the base of the abdomen. The neck was thin and long (mean length: 88.8 ± 7.7 mm, n = 14) and paler in color. The globose head (mean length: 4.9 ± 1.3 mm and mean maximum width: 4.5 ± 1.5 mm; n = 6) was covered with small and numerous papillae (Figure 1B) and presented the antennary region on its dorsal side (Figure 1C). The adjacent thoracic region presented two lateral holdfast horns (mean length: 17.3 ± 8.5 mm, n = 6; Figure 1B), sometimes also a smaller dorsal horn (8.3 ± 6.4 mm, n = 5), and four pairs of swimming legs ventrally (Figure 1D). Therefore, specimens were morphologically identified as Pennella filosa, syn. P. balaenoptera (sensu Abaunza et al., Reference Abaunza, Arroyo and Preciado2001; Hogans, Reference Hogans2017; Fraija-Fernández et al., Reference Fraija-Fernández, Hernández-Hortelano, Ahuir-Baraja, Raga and Aznar2018).
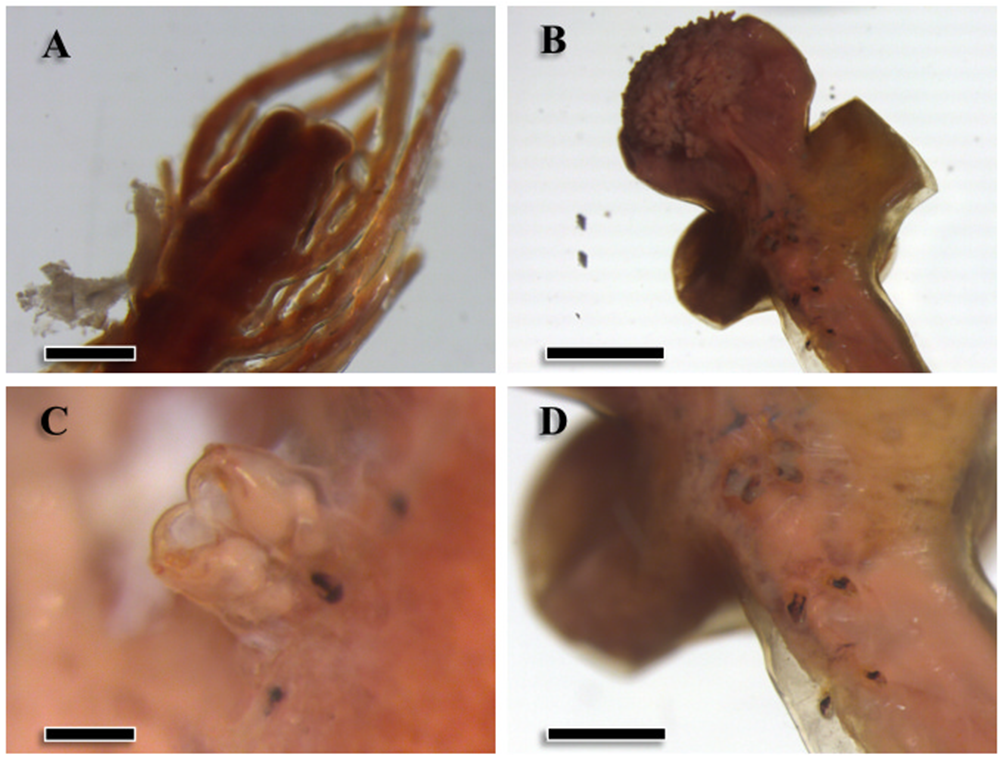
Figure 1. Morphological traits of specimens of Pennella balaenoptera from a fin whale, Balaenoptera physalus, stranded in the western Mediterranean. A, terminal region of the abdomen (scale bar: 0.5 mm); B, cephalothorax (2 mm); C, secondary antennae in the antennary region (0.2 mm); D, detail of the swimming legs (1 mm).
Phylogenetic position and genetic structure
Phylogenetic tree and haplotype network structure
Phylogenetic trees grouped all Pennella sequences in a clade, separated from the outgroups with >95% support. Bayesian (Figure 2) and ML (Fig. S1) topologies were very similar, but with much higher support values for Bayesian inference. This analysis reached both convergence and stationarity since PSRF = 1.001, ASDSF = 0.008, log-likelihood values fluctuated around a horizontal line, and ESS >300 for all parameters. The 23 newly obtained sequences were identified as P. balaenoptera with BLAST searches but were widespread on the phylogenetic tree (Figure 2), with some being more closely related to north Pacific than to other Mediterranean samples (see bottom nodes in Figure 2). Except for the sequence from the swordfish parasite, the other 22 samples are the first sequences from pennellids associated with humpback and fin whales.
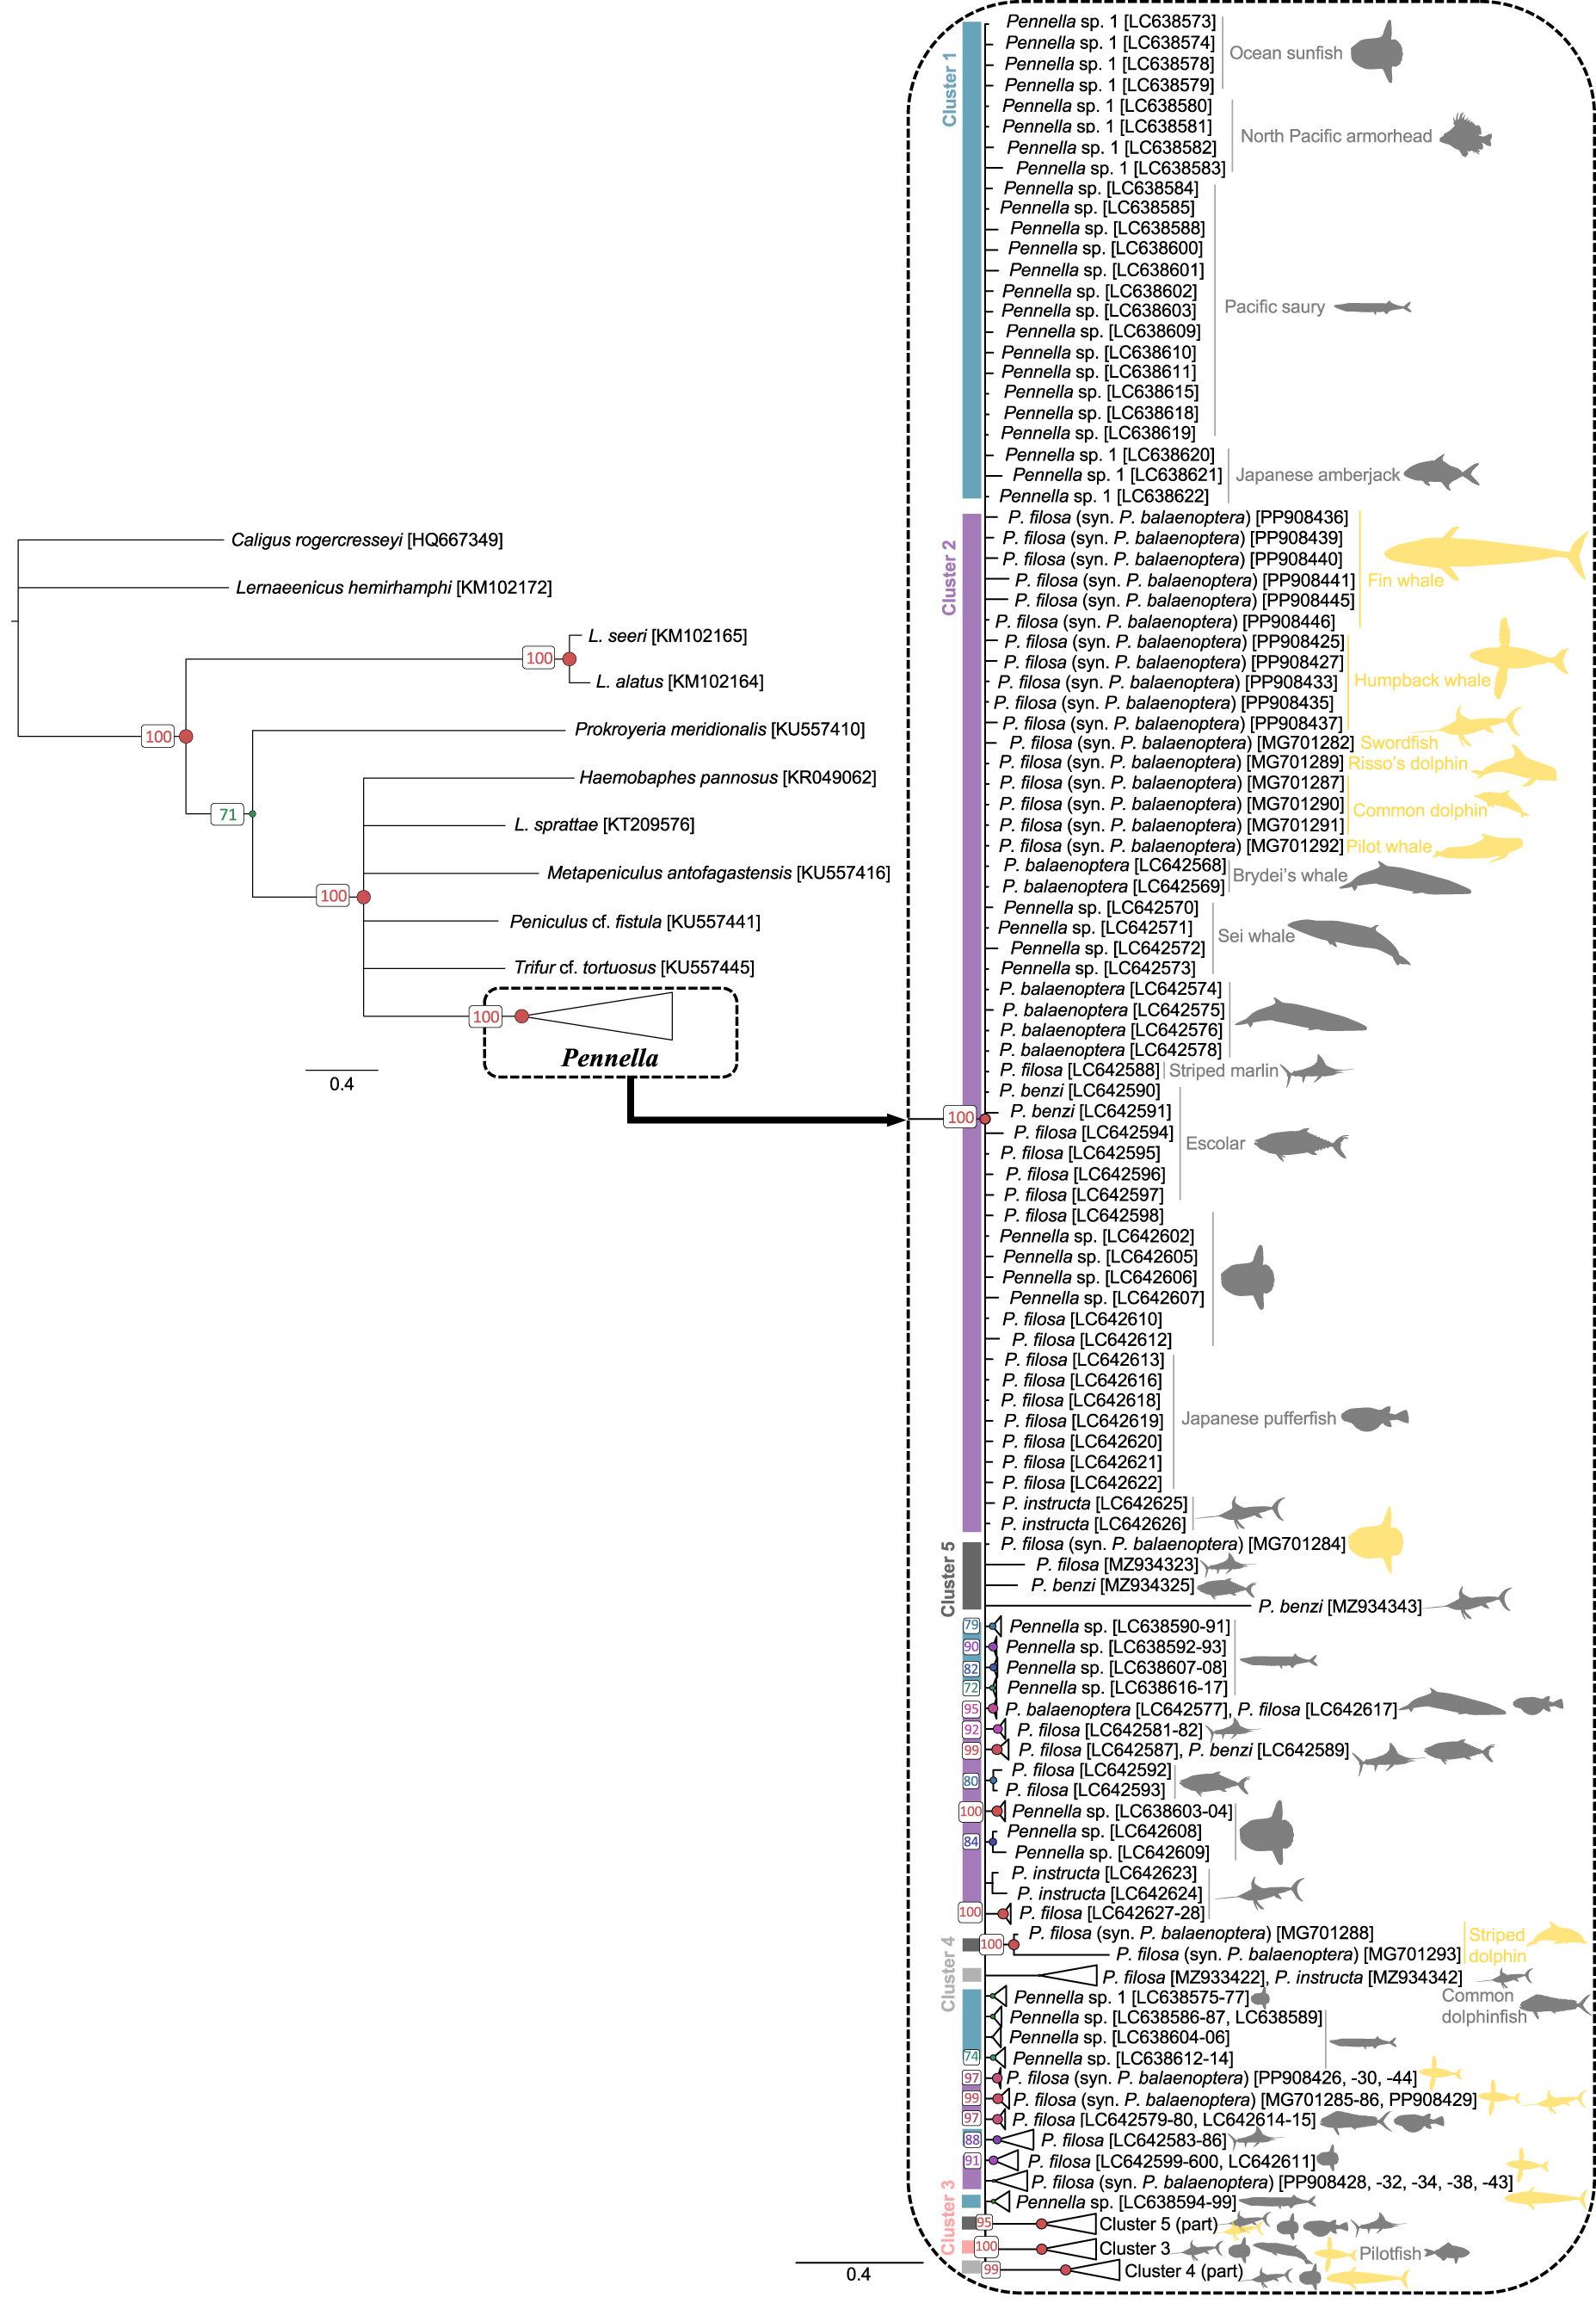
Figure 2. Bayesian inference phylogenetic tree based on COI sequences of 189 specimens of the genus Pennella. Host identity is indicated by icons, colored by geographic origin (grey, north Pacific; yellow, western Mediterranean). Support values for each node are expressed as posterior probabilities; values <70% are not shown. color bars and cluster numbers indicate the haplogroups from the haplotype network in Figure 3. Horizontal bars indicate evolutionary distance.
The overall structure of the haplotype network was complex (Figure 3). A total of 145 COI haplotypes were found among the 189 sequences (Table S1). Suyama et al. (Reference Suyama, Yanagimoto, Nakai, Tamura, Shiozaki, Ohshimo and Chow2021b) detected 126 haplotypes, so the 23 new Pennella sequences from the western Mediterranean represent 19 unique haplotypes (Table S1). The new specimens that did not represent unique haplotypes shared haplotypes with north Pacific specimens (i.e. the specimen from the swordfish, Xg5, and one each from a humpback and fin whale, Mn1 and Bp3 respectively; Table S1). At least one specimen from highly vagile host species (e.g. a humpback whale, swordfish, or sunfish; Table S2) was present when haplotypes were shared between parasites from the two geographic regions, except for haplotype XLVI, which includes pennellids from a Mediterranean fin whale and a north Pacific escolar (Table S1).
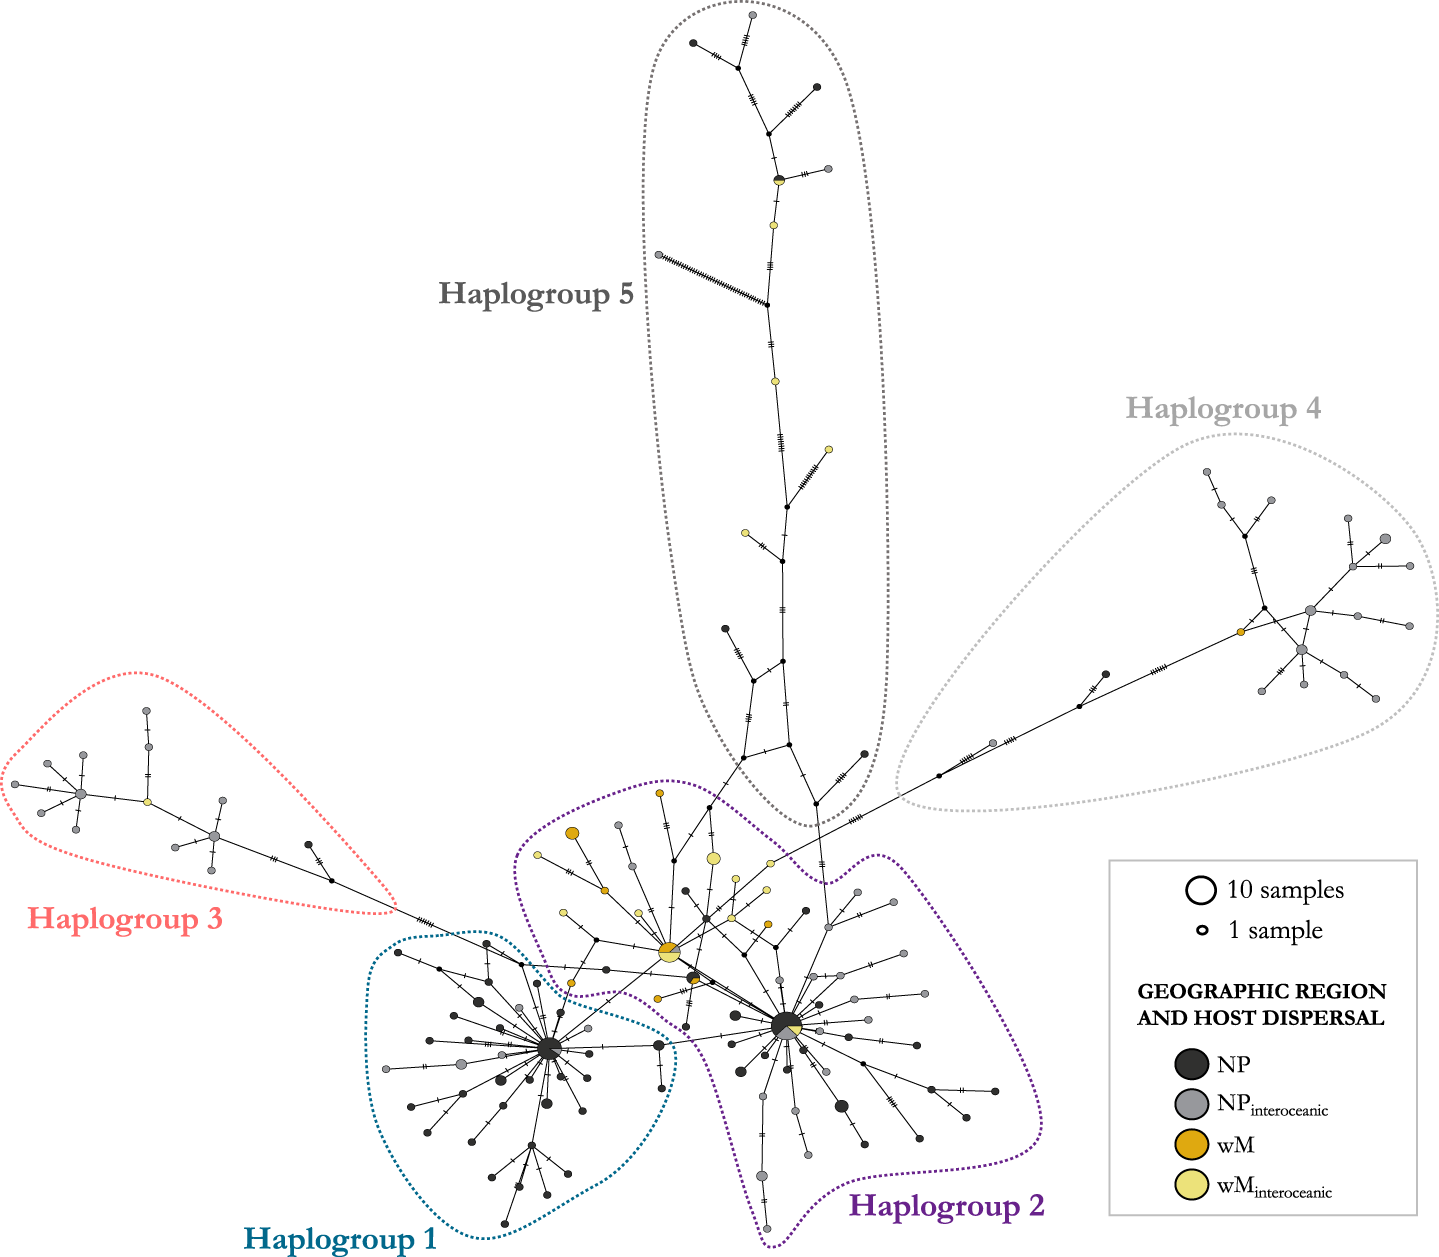
Figure 3. Parsimony haplotype network of COI sequences from Pennella spp. specimens. Haplotype frequency is proportional to circle area. Colors of the circles represent the geographic origin of the samples (black, gray: north Pacific; orange, yellow: western Mediterranean) and the degree of dispersal of the Hosts (gray, yellow: Host species with interoceanic connectivity; black, orange: Hosts with lower dispersal). Five major haplogroups were identified in the network (outlined areas); see the main text for details. Sequence identity and accession numbers can be found in Table S1.
We identified 5 haplogroups on the network; Haplogroups 3–5 were separated by >7 mutational steps (i.e. nucleotide substitutions) from the center of the network, composed of the two more closely related Haplogroups 1 and 2 (Figure 3). Despite the low number of mutational steps between Haplogroups 1 and 2 (about 1; Figure 3), they were morphologically distinct. Samples in Haplogroup 1 were smaller (total length < 74 mm) and showed branched antennary processes on the cephalothorax (Group I in Suyama et al., Reference Suyama, Yanagimoto, Nakai, Tamura, Shiozaki, Ohshimo and Chow2021b, putatively the species complex P. sagitta), whereas those in Haplogroups 2 and 3 were larger and lacked branched processes (Figure 1; Groups II and III in Suyama et al., Reference Suyama, Yanagimoto, Nakai, Tamura, Shiozaki, Ohshimo and Chow2021b, putatively the P. filosa species complex). Samples in Haplogroups 4-5 had the same morphology as those from Haplogroups 2-3.
In both phylogenetic trees, sequences from Haplogroups 1 and 2 (Figure 3) were not differentiated and displayed a comb shape (Figures 2 and S1). Except for the 23 new Mediterranean samples, these sequences would correspond to samples from the species complex P. sagitta (Group I) and some of the complex P. filosa (Group II) sensu Suyama et al. (Reference Suyama, Yanagimoto, Nakai, Tamura, Shiozaki, Ohshimo and Chow2021b). By contrast, Haplogroup 3 always constituted a monophyletic clade (with ≥98% support; Figure 2; also the monophyletic Group III, considered part of the P. filosa complex in Suyama et al., Reference Suyama, Yanagimoto, Nakai, Tamura, Shiozaki, Ohshimo and Chow2021b). The Bayesian tree suggested, with 99% support, that Haplogroup 4 belongs to a monophyletic clade, while the paraphyletic Haplogroup 5 may be subdivided into three genetic lineages (Figure 2). ML was not very informative for these two haplogroups as support values were extremely low (i.e. 0–3%; Fig. S1). Reticulate relationships were frequent between and within the five haplogroups (Fig. S2), with similar topologies between the reticulate networks based on K2P and uncorrected p-distances.
There were three relatively abundant haplotypes (shared by 7–13 samples) at the center of the network, i.e. one in Haplogroup 1 and two in Haplogroup 2. Two of these included mostly north Pacific samples and constituted star-like structures with most branches being short (generally <4 mutational steps, up to 6 in a few branches) (Figure 3). A large proportion of Mediterranean samples was clustered at the very center of the network, in Haplogroup 2 (see below), and were separated from those in Haplogroup 3 by at least 11 mutational steps. The number of steps within Haplogroup 3 was much lower (i.e. 1–6). Haplogroups 4 and 5 were connected to the central haplogroups through many mutational steps (i.e. 8–68 steps, from the closest to the most distant samples). Haplogroups 4 and 5 exhibited a much more ramified structure, with a broad range of mutational steps between samples (i.e. 1–49; Figure 3), and correspond to Group IV in Suyama et al. (Reference Suyama, Yanagimoto, Nakai, Tamura, Shiozaki, Ohshimo and Chow2021b), which was considered a group of NUMTs. Branches with > 10 mutational steps belong to highly divergent haplotypes (see Feis et al., Reference Feis, Thieltges, Olsen, de Montaudouin, Jensen, Bazaïri, Culloty and Luttikhuizen2015). We found no evidence of poorer sequence quality in these two haplogroups (i.e. similar GC content, 26.9–37.8%; and percentage of base ambiguities, with all group means <0.07%).
Geographic and host effect on genetic differentiation
Despite the aforementioned genetic structure within Pennella, the observed differentiation could not be associated with the geographic region where samples had been collected nor with host taxon or host dispersal pattern (i.e. interoceanic connectivity). The haplotype network highlighted some patterns that would go unnoticed by just looking at phylogenetic trees. Mediterranean samples were clustered at the center, although they were well represented throughout the network – except for Haplogroup 1, with only north Pacific samples – and shared haplotypes with north Pacific samples from Haplogroups 2 and 5, regardless of the degree of host dispersal (Figure 3). The proportion of hosts that conduct interoceanic movements was lower in Haplogroup 1 while larger in Haplogroups 3–5, although we failed to detect a significant effect (see below). Haplotype relationships were also decoupled from host identity or taxonomy; some specimens from different hosts were more closely related, and even shared haplotypes, than those co-occurring on the same host individual (e.g. parasites of Mn1; Table S1). In fact, genetic differentiation was detected at the infrapopulation level (i.e. within an individual host), with co-occurring parasites being assigned to two different haplogroups. This was reported in 10 hosts from 9 species, including mysticetes and teleosts from both geographic regions and dispersal types. One additional case involved the parasites of a north Pacific swordfish, grouped into three different haplogroups (Table S1).
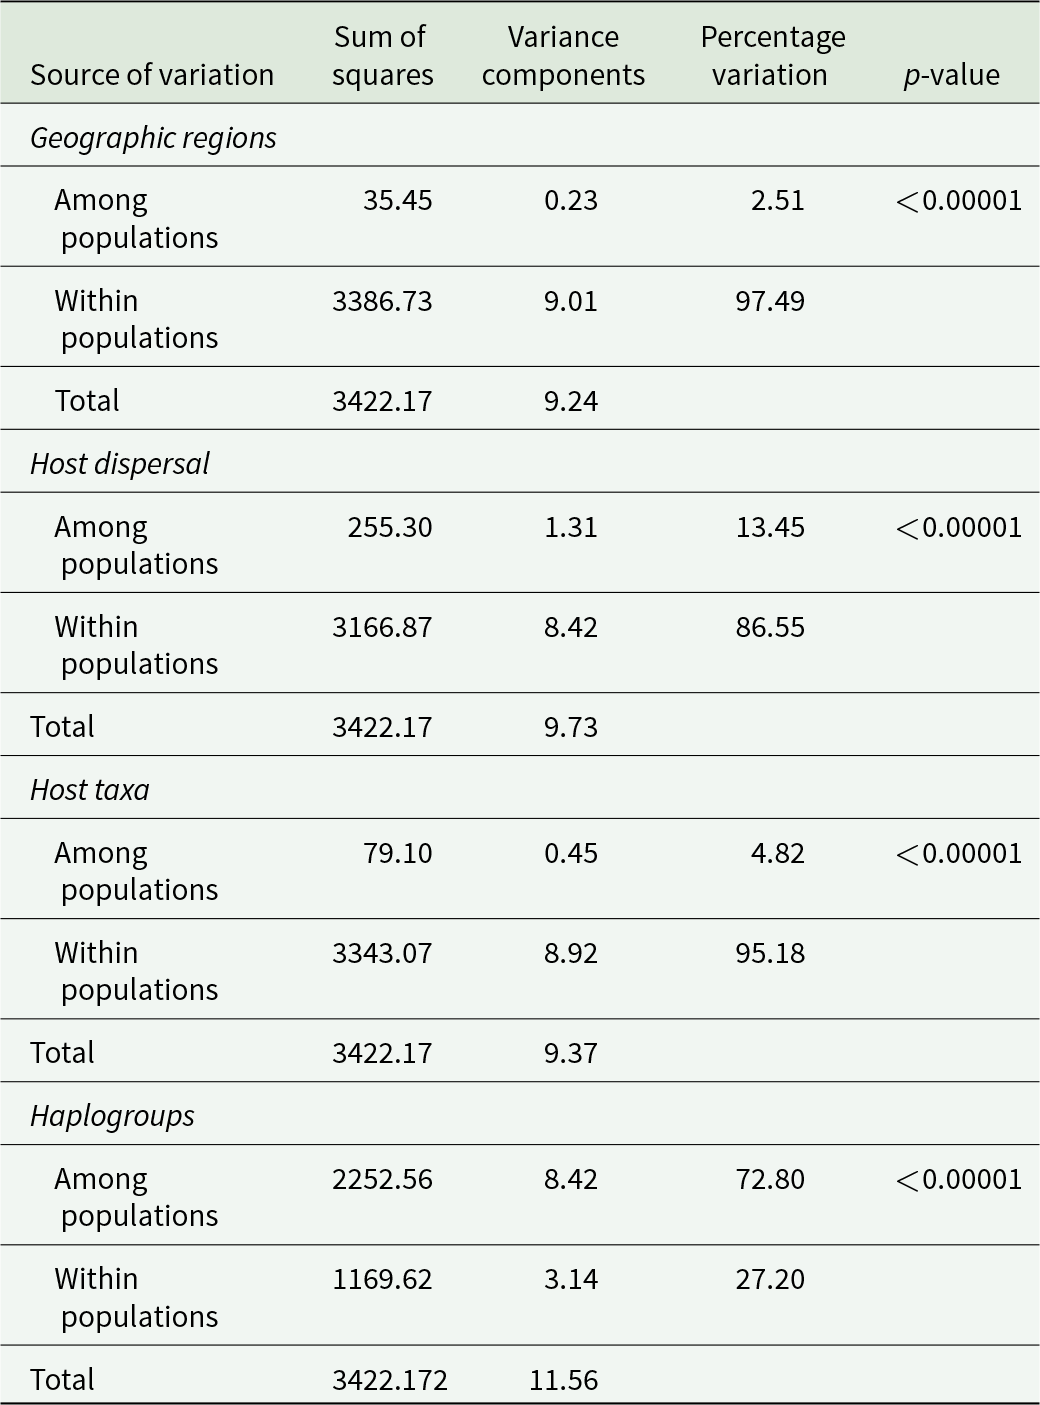
The AMOVAs showed that most of the genetic variation (>85%) occurred within, rather than between, geographic regions and host types (Table 2). Mean nucleotide sequence divergence (% K2P ± standard error) between geographic regions (4.4 ± 5.5) or between host types (4.2 ± 1.9 between taxa, Table S3; 5.2 ± 0.7 for dispersal) was, in some cases, lower than within groups (i.e. 4.98% among north Pacific samples and 6.87% among samples from interoceanic hosts). The lower divergence between cetacean superfamilies than between cetaceans and teleosts could be an artifact of the high divergence among the teleosts (Table S3), observed in both geographic regions (Table S4). In contrast, there was significant genetic heterogeneity between the five haplogroups (Table 2).
Table 2. Results of the AMOVA among Pennella spp. sequences from two geographic regions (north Pacific and western Mediterranean), from hosts with a varying degree of vagility (interoceanic movement and gene exchange vs. smaller range within an ocean basin), and from five haplogroups inferred from previous analyses (see main text)
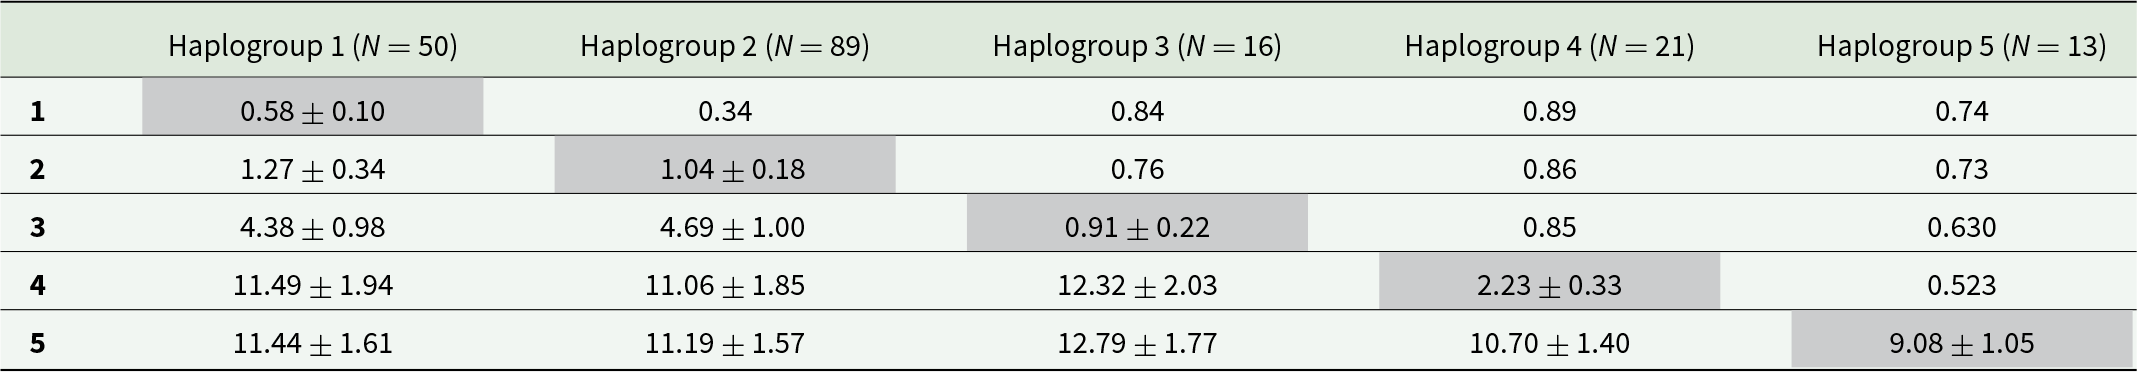
Pairwise FST differences between haplogroups were all significant at the 95% significance level (p < 0.0001; Table 3). Nucleotide sequence divergence was low between Haplogroups 1 and 2 (K2P: 1.3%, and also lower FST, i.e. 0.3), intermediate between both 1–2 and 3 (>4%), and very high for all combinations including Haplogroups 4 or 5 (>10%), matching the patterns in the phylogenetic trees (Figures 2 and S1) and networks (Figures 3 and S2). Haplogroup 5 was particularly diverse, with intra-haplogroup K2P ∼ 9% (vs. ≤3% for the rest; Table 3).
Table 3. Genetic diversity among 189 COI sequences of Pennella spp. from five haplogroups identified in a parsimony haplotype network. Values represent pairwise differences in FST (above diagonal) and mean nucleotide pairwise sequence divergence (% K2P ± standard error) between (below diagonal) and within (shaded values on diagonal) haplogroups. All FST differences are significant, with all nominal p-values <0.0001
Species delimitation
Species delimitation methods did not find consistent evidence of interspecific differentiation between the 189 analyzed COI sequences, a matter that should be directly addressed with more markers (see Discussion). First, ABGD and ASAP show a lack of ‘barcode gap,’ i.e. the gap between intraspecific and interspecific variation. Second, bPTP had low support values at the internal nodes and showed a tendency toward over-splitting, with 37 ‘species’ detected.
Discussion
The present phylogeny based on COI sequences supports that the genus Pennella constitutes a monophyletic group within the order Siphonostomatoida (Fraija-Fernández et al., Reference Fraija-Fernández, Hernández-Hortelano, Ahuir-Baraja, Raga and Aznar2018; Suyama et al., Reference Suyama, Yanagimoto, Nakai, Tamura, Shiozaki, Ohshimo and Chow2021b). All the specimens from this study – collected from western Mediterranean whales and a swordfish – were identified as Pennella filosa (syn. P. balaenoptera) following previous morphological and molecular criteria. These specimens were interspersed within the phylogeny of Pennella, which generally displayed a comb shape.
Based on distinct morphological traits, Suyama et al. (Reference Suyama, Yanagimoto, Nakai, Tamura, Shiozaki, Ohshimo and Chow2021b) proposed that Pennella could be grouped into 2 species complexes – namely P. sagitta and P. filosa – and possibly a third species, P. makaira. When also considering molecular data, however, this taxonomic classification becomes controversial. First, there is clear incongruence between morphological and molecular data. Second, we failed to find significant genetic differentiation through species delimitation methods or by comparing sequence divergence between samples from the putative species complexes P. sagitta and P. filosa (Suyama et al., Reference Suyama, Yanagimoto, Nakai, Tamura, Shiozaki, Ohshimo and Chow2021b), which correspond to Haplogroups 1 and 2–3, respectively (see below). Interspecific nucleotide divergence is very variable within genera of siphonostomatoid copepods (generally 14.4–30.1%; Øines and Schram, Reference Øines and Schram2008; Dippenaar et al., Reference Dippenaar, Mathibela and Bloomer2010; Muñoz et al., Reference Muñoz, Landaeta, Palacios-Fuentes, López and González2015; Lovy and Friend, Reference Lovy and Friend2020). There are also cases of sibling or cryptic species of siphonostomatoids with divergences 12–17% (Øines and Heuch, Reference Øines and Heuch2005; Øines and Schram, Reference Øines and Schram2008; Dippenaar et al., Reference Dippenaar, Mathibela and Bloomer2010). The divergence values between Haplogroups 1–3 (i.e. 1.3–4.7%) in our study are therefore compatible with intraspecific variation. In contrast, the divergence between Haplogroups 1–3 and 4 or 5, and between Haplogroups 4 and 5, was larger (i.e. 10–12%), hence we cannot rule out the possibility of cryptic species – specimens in Haplogroups 2–3, 4, and 5 could represent three sibling species that share morphology (that of the P. filosa complex sensu Suyama et al., Reference Suyama, Yanagimoto, Nakai, Tamura, Shiozaki, Ohshimo and Chow2021b). In contrast, Haplogroups 1 and 2–3 could constitute two morphotypes of a single species – Castro-Romero et al. (Reference Castro-Romero, Montes, Martorelli, Sepulveda, Tapia and Martínez-Aquino2016) found very low genetic distance (0.95%) among morphologically different specimens of the pennellid Peniculus cf. fistula (see also Lovy and Friend, Reference Lovy and Friend2020). Note, however, that this classification into 3 putative species was not supported by species delimitation methods. Also, Suyama et al. (Reference Suyama, Yanagimoto, Nakai, Tamura, Shiozaki, Ohshimo and Chow2021b) stated that sequences in Haplogroups 4–5 (i.e. Group IV) were NUMTs, although we did not find conclusive evidence for this assumption.
Another possibility for the incongruence between morphological and molecular data could be incomplete lineage sorting since only a single molecular marker was available. This would mean that COI might not be the most suitable marker for species delimitation in Pennella, even if reliable for other siphonostomatids (e.g. Castro-Romero et al., Reference Castro-Romero, Montes, Martorelli, Sepulveda, Tapia and Martínez-Aquino2016). Another example is the molecular marker ITS1, which failed to reveal the clades identified in the COI phylogeny (Suyama et al., Reference Suyama, Yanagimoto, Nakai, Tamura, Shiozaki, Ohshimo and Chow2021b). Furthermore, the high morphological polymorphism among the Pennellidae (Kabata, Reference Kabata1979; Hogans, Reference Hogans1987) hampers morphology-based inferences on species delimitation. Therefore, the taxonomy of Pennella remains in a state of flux and should be investigated in future studies by incorporating multiple loci (including at least one nuclear marker other than ITS1) to provide reliable measures of genetic differentiation. In the meantime, using species classification by Hogans (Reference Hogans2017) or Suyama et al. (Reference Suyama, Yanagimoto, Nakai, Tamura, Shiozaki, Ohshimo and Chow2021b) could be a practical approach for referring to specific morphologies, and the use of the qualifier ‘cf.’ (Latin: conferre) before the species name is recommended.
Phylogenetic networks are useful for displaying relationships that may not be bifurcating, while accounting for the effect of gene flow (Blair and Ané, Reference Blair and Ané2020). We identified 5 haplogroups in a COI-based haplotype network, and they were all linked by reticulate relationships. The structure of the network, with a few shared haplotypes and relatively low levels of nucleotide diversity (i.e. ≤2% for Haplogroups 1–4) may be indicative of rapid population growth (Avise, Reference Avise2000). Also, the star-like structures of the two most common haplotypes may be related to recent population expansion (see Feis et al., Reference Feis, Thieltges, Olsen, de Montaudouin, Jensen, Bazaïri, Culloty and Luttikhuizen2015). Interestingly, pennellids from the same individual host were sometimes more closely related to those from other hosts (even if collected in different years) than to each other. This could indicate that individuals within an infrapopulation have colonized their hosts during different events, separated in time and potentially in space, and belong to different genetic pools. The less defined structure of the phylogenetic trees, which display a comb shape, is also compatible with recent (and potentially ongoing) genetic exchange between populations, as supported by the structure of the reticulate and haplotype networks.
In all haplogroups, we found Pennella from both geographic regions (except for the exclusively north Pacific Haplogroup 1), levels of host dispersal (i.e. with or without interoceanic connectivity), and from multiple host species. Genetic variation was lower between geographic regions and host types (both dispersal level and taxon) than within each group. Firstly, the lack of differentiation by geographic region or degree of host dispersal could indicate high rates of genetic exchange across oceans (see below). Secondly, the extremely low host specificity of Pennella may explain why patterns of genetic diversity did not match host taxonomy; e.g. even the most closely related fish parasites were found on relatively distant taxa (i.e. scombriforms, beloniforms, and acropomatiforms; Near et al., Reference Near, Eytan, Dornburg, Kuhn, Moore, Davis, Wainwright, Friedman and Smith2012; Malmstrøm et al., Reference Malmstrøm, Matschiner, Tørresen, Star, Snipen, Hansen, Baalsrud, Nederbragt, Hanel, Salzburger, Stenseth, Jakobsen and Jentoft2016; Smith et al., Reference Smith, Ghedotti, Domínguez-Domínguez, McMahan, Espinoza, Martin, Girard and Davis2022). The degree of host–parasite taxonomic congruence may increase with host specificity, and in parasites with direct life cycles, low dispersal, and limited (or no) free-living stages (Hafner et al., Reference Hafner, Demastes, Spradling, Reed and Page2003; Nieberding et al., Reference Nieberding, Morand, Libois and Michaux2004). The opposite scenario seems to hold true for Pennella – i.e. a generalist parasite of marine vertebrates with a complex life cycle with free-living stages and some highly vagile hosts–, thus it seemingly benefits from great opportunities for dispersal. Note, however, that mating occurs at the intermediate host, where host specificity could be different.
Even if unattributable to geographic origin or host, genetic variation was significant between the five haplogroups (see above). Therefore, it seems unlikely that Pennella represents a strict panmictic population. Instead, gravid females of Pennella seem to show low specificity for definitive hosts and disperse across oceans with some definitive hosts. At a regional scale, earlier infective stages could exhibit greater specificity for intermediate hosts – where mating (genetic exchange) occurs, hence resulting in some degree of reproductive isolation. Interoceanic connectivity is likely facilitated by the dispersal of highly vagile definitive hosts, including the humpback whale (Megaptera novaeangliae), sei whale (Balaenoptera borealis), swordfish (Xiphias gladius), and ocean sunfish (Mola mola) (Table S2). In fact, it has been suggested that ocean sunfish are responsible for the range expansion of its helminth parasites into the Mediterranean Sea (Santoro et al., Reference Santoro, Palomba, Mattiucci, Osca and Crocetta2020). Host dispersal may contribute to the effect of the ‘high mixing in aquatic habitats’ hypothesis, which proposes that aquatic parasites with several hosts have multiple opportunities for mixing of unrelated individuals during transmission to the definitive host (Criscione and Blouin, Reference Criscione and Blouin2006; Criscione et al., Reference Criscione, Vilas, Paniagua and Blouin2011). Moreover, the effect of host-mediated dispersal on the parasite’s genetic structure (e.g. Hedgecock et al., Reference Hedgecock, Barber and Edmands2007; Fraija-Fernández et al., Reference Fraija-Fernández, Fernández, Lehnert, Raga, Siebert and Aznar2017) could be enhanced in species with high fecundity like the pennellids (e.g. Whitfield et al., Reference Whitfield, Pilcher, Grant, Riley, Boxshall and Schminke1988; Yumura et al., Reference Yumura, Adachi, Nitta, Kondo, Komeda, Wakabayashi, Fukuchi, Boxshall and Ohtsuka2022), in which a relatively small proportion of adults may account for the bulk of reproduction of a population at a specific spatial and temporal scale (i.e. sweepstakes events, which are sometimes hard to detect; Hedgecock et al., Reference Hedgecock, Barber and Edmands2007). Therefore, immigrants could release a great number of larvae into the new geographic region and lead to population expansion from a few animals, which is consistent with the aforementioned star shapes in the haplotype network (Nieberding et al., Reference Nieberding, Morand, Libois and Michaux2004). Other dispersal mechanisms for Pennella (e.g. independent swimming or drifting, or transport in ballast water; see Pagenkopp Lohan et al., Reference Pagenkopp Lohan, Darling and Ruiz2022) seem unlikely, given the brief naupliar stage and presumably low vagility of the putative intermediate flatfish or cephalopod hosts (e.g. Arroyo et al., Reference Arroyo, Abaunza and Preciado2002; Izawa, Reference Izawa2019). Nonetheless, the identity and degree of dispersal of the intermediate hosts and the duration of the second infective stage (i.e. the inseminated adult female) remain unknown, hence we cannot rule out the additional effect of these stages on parasite dispersal.
In the future, genomic data or microsatellite markers could allow for kinship analyses, potentially overcoming the limitations of indirect methods such as F-statistics for investigating gene flow at diverse scales (e.g. Iacchei et al., Reference Iacchei, Ben‐Horin, Selkoe, Bird, García‐Rodríguez and Toonen2013; Carroll et al., Reference Carroll, Alderman, Bannister, Bérube, Best, Boren, Baker, Constantine, Findlay, Harcourt, Lemaire, Palsbøll, Patenaude, Rowntree, Seger, Steel, Valenzuela, Watson and Gaggiotti2019). Even if COI has been applied successfully in analyses of cryptic species complexes (Hebert et al., Reference Hebert, Penton, Burns, Janzen and Hallwachs2004), and successfully among siphonostomatids, multilocus approaches provide a better understanding of cryptic structure (Criscione et al., Reference Criscione, Vilas, Paniagua and Blouin2011) and assist in the investigation of host–parasite phylogenetic congruence (e.g. Sweet et al., Reference Sweet, Bush, Gustafsson, Allen, DiBlasi, Skeen, Weckstein and Johnson2018). Lastly, gathering samples from other geographic locations could also allow for reconstructing gene flow via interpolation (Iacchei et al., Reference Iacchei, Ben‐Horin, Selkoe, Bird, García‐Rodríguez and Toonen2013).
Supplementary material
The supplementary material for this article can be found at https://doi.org/10.1017/S0031182025000101.
Data availability statement
New COI sequences have been uploaded to GenBank under Accession Numbers PP908425–PP908447.
Acknowledgements
We thank all the participants of the Valencian Stranding Network.
Author contribution
ST, RVP, and FJA conceived and designed the study. ST and RVP collected samples and performed bench work and bioinformatics. ST performed statistical analyses and made the figures. ADS and FJA supervised the work. ST and FJA wrote the original draft. ST, RVP, JAR, ADS, and FJA reviewed and edited the draft. JAR and FJA obtained funding. All authors read the manuscript drafts and contributed to this work.
Financial support
The project VARACOMVAL of the Biodiversity Foundation of the Spanish Ministry for the Ecological Transition and the Demographic Challenge (MITECO) under the NextGeneration EU Recovery, Transformation, and Resilience Plan (PRTR) provided financial support for the Valencian Stranding Network and the Wildlife Service and the Conselleria de Medi Ambient, Aigua, Infraestructures i Territori of the Generalitat Valenciana for the logistic support. This work was also supported by the Valencian Regional Government [project AICO/2021/022]. S. Ten benefitted from the predoctoral grant UV-INVPREDOC15-265927, awarded by the University of Valencia.
Competing interests
The authors declare there are no conflicts of interest.
Ethical standards
Permission to collect samples from stranded animals was granted by the Wildlife Service and the Conselleria de Medi Ambient, Aigua, Infraestructures i Territori of the Generalitat Valenciana.


 Open access