Introduction
Over thick ice in the Arctic, the downwelling radiation flux is typically two orders of magnitude greater than either the turbulent or oceanic flux. One would therefore expect sea-ice models to be sensitive to the radiative fluxes used to drive them. For example, in the two-dimensional (2-D) dynamic thermodynamic ice model described in Reference Maslanik, Key and SchweigerMaslanik and others (1995), a 10% change in the longwave flux changes the computed mean ice mass by 36%. A 10% increase in the shortwave flux decreases the mean ice mass by 11%, while a 10% decrease in the shortwave flux increases ice mass by 8%. Accurate simulations of sea ice therefore require accurate forcings of the downwelling radiation fluxes. While a radiative-transfer model will give more accurate estimates of radiative fluxes, computational considerations and data constraints generally preclude their use. Therefore, thermodynamic sea-ice models have incorporated simple radiative flux parameterizations that require only a few input variables. It is important to know which schemes are most accurate, what the main problems or errors associated with them are, and if they can be improved.
Reference Key, Silcox and StoneKey and others (1996) evaluated the accuracy of a variety of parameterizations for downwelling shortwave (SW↓) and longwave (LW↓) radiative fluxes that can be used in dynamic-thermodynamic sea-ice models. The objectives of this paper are (1) to present a new shortwave flux parameterization scheme, and (2) to compare it to a number of the schemes presented in Reference Key, Silcox and StoneKey and others (1996). (See Reference Key, Silcox and StoneKey and others (1996) for recommended longwave schemes.)
Data
Tb assess the accuracy of the various parameterization schemes we compare parameterized fluxes to observations made at two Arctic locations: Resolute, in the Northwest Territories, Canada, and Barrow, Alaska. The Resolute observations were made at the Seasonal Sea Ice Monitoring and Modelling Site (SIMMS), located off the coast of Corn-wallis Island near Resolute (74.6° N, 94.7° W) (Reference Papakyriakou, Misurak, Barrber and LeDrewPapakyriakou, 1993). It is a region where both multi-year and first-year ice can be found, as well as areas of open water in summer. Downwelling and upwelling shortwave and long-wave radiation were measured at the site and averaged over 15 minute intervals. Data from May and June 1993 are used here. While these data cover a wide range of solar zenith angles, no part of this period was without solar radiation.
The Barrow data were collected at the Climate Monitoring and Diagnostic Laboratory (CMDL) baseline observatory (71.32°N, 156.61°W) near Barrow. Alaska (BRW). Although situated on the Arctic tundra, where complete melting of the snow occurs each summer, the site is generally considered to be representative of an Arctic maritime climate because the prevailing winds are northeasterly, off the Beattfort Sea; all observations are made within 2 km of the coast. Surface albedo varies from about 0.18 during summer months to over 0.86 when snow covered. The data used in this study were carefully edited, calibrated and further averaged into daily values. Shortwave-irradiance measurements are accurate to within 3% on average, with systematically greater uncertainties as the signal diminishes with increasing zenith angle (Reference Stone, Mfefford, Dutton, Halter and EndresStone and others, 1996). Data from all of 1994 are used here.
Existing Schemes
Radiation parameterizations are simple schemes or equations that require just a few input variables io estimate radiative fluxes. They do not treat explicitly many important physical processes in the atmosphere but, instead, employ empirical relationships to predict radiative fluxes. Here, radiative-flux parameterizations are categorized as “clear sky” or “all sky” (clear, partly cloudy and overcast). Units presented have been standardized and the coefficients altered accordingly. Thus SW↓ and LW↓, and the solar constant, S0 , are in W m−2; the solar zenith angle Z is in degrees; the near-surface air temperature T is in K, the near-surface vapor pressure e is in mb, while the cloud optical depth τ cloud fraction c, and the surface albedo a are unitless. The subscripts clrandclr refer to clear and cloudy conditions, respectively, In this section only those parameterization schemes that are most applicable to high-latitude conditions are evaluated. Descriptions are brief; for more detail see Reference Key, Silcox and StoneKey and others (1996).
For clear-sky fluxes, Reference Moritz, Barry and JacobsMoritz (1978) modified the method of Reference LumbLumb (1961) using data from Baffin Bay. Canada:
Reference BennettBennett (1982) used a very simple formula in an ice-modelling experiment:
This equation, due to its simplicity, would likely be inaccurate over short time periods, although it may be of value for estimating long-term means (e.g. monthly).
Reference ZillmanZillman (1972), using data from the Indian Ocean, developed a parameterization that includes the near-surface vapor pressure. It has been used in sea-ice modelling experiments (e.g. Reference PeasePease, 1975; Reference Parkinson and WashingtonParkinson and Washington, 1979):

Using this equation, Reference ShineShine (1984) compared parameterized Aretic fluxes to fluxes generated by a radiative-transfer model. He concluded that the Reference ZillmanZillman (1972) equation generally underestimated Aretic fluxes and modified the coefficients to give a better fit with the modelled fluxes:

In order to parameterize the effects of clouds on the all-sky flux, SW↓clr is commonly multiplied by a simple cloud factor, which includes the cloud fraction and a coefficient. Reference Jacobs, Barry and JacobsJacobs (1978) modified the Reference BerliandBerliand (1960) model using measurements from Baffin Island, Canada:
while Reference BennettBennett (1982) used a value of 0.52 in Aretic sea-ice modelling experiments:
For cloudy conditions, Reference ShineShine (1984) developed a para-meterization suitable for high albedo surfaces such as snow and ice. The inclusion of the cloud optical depth and ground surface-albedo parameters takes into account the effects of cloud thickness and multiple reflections between the surface and cloud base:

Equation (8) is likely to be superior to the others described, particularly for estimating fluxes over short time periods.
A New Shortwave Scheme
Is it possible to improve upon these shortwave parameterizations? We approach this question by returning to the basic issue of what processes influence the transmission of solar radiation through the atmosphere. In the absence of the atmosphere, the flux of downwelling solar radiation is expressed in a well-known form:
In the presence of an atmosphere, the transmission of solar energy invokes gaseous absorption, molecular scattering and particle scattering, and can be characterized by two quantities: transmissiviiy T and optical air mass m Transmissivity is the relative amount of solar energy transmitted to the bottom of the atmosphere if the transmission path is vertical, Optical air mass summarizes the effect on transmission if the path is other than vertical:
For clear skies the value T = 0.8 has been widely used in the literature (Reference HartmannHartmann, 1994). For a cloudy atmosphere T decreases with increasing cloud thickness.
For optical air mass m, we use an expression similar to that given by Reference KastenKasten (1966):

where R = 6371 km is the radius of the earth and H is the equivalent height of the atmosphere. Note that H can be higher than the physical height of the atmosphere; for example, on a clear day H is 120 km but under cloudy conditions H can be several hundred km.
The relationship between transmissivity T and equivalent height H is expressed in Beer’s Law:
where β is an empirical constant and βH is equivalent opti-cal depth of the atmosphere. These relationships have been documented elsewhere (i.e. Reference IqbalIqbal, 1983).
Our objective is to develop a model based on Equations (10), (11) and (12) using field data to derive empirical relationships. Table 1 summarizes the Barrow clear-sky data in terms of transmissivity, the standard deviation of the observed shortwave flux, and the ranges of temperature, dew-point temperature and surface albedo. The transmissivity given is the ratio of the observed surface flux to the modelled top of the atmosphere (TOA) shortwave flux. Although a relationship between atmospheric transmissivity and temperature or humidity in Table 1 is not obvious, the correlation between transmissivity and surface albedo is more apparent. The empirical relationship determined from the data is:
For this relationship the coefficient of variation R2 is 0.94. The clear-sky flux can now be expressed as a function of solar zenith angle and surface albedo by setting H = 120 km and using Equations (13), (12), (11), and (10).
Table 1. Clear-day transmissivity (T) at Barrow

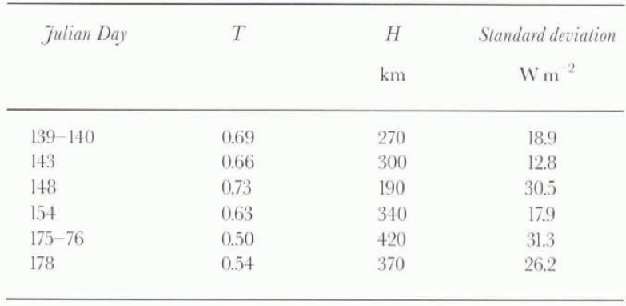
Table 2 gives the Julian Day, transmissivity, equivalent height of atmosphere, and flux standard deviation for overcast conditions at Barrow. As in Table 1, the transmissivity was computed as the ratio of the surface to TOA shortwave fluxes. H was then determined from Equation 12 using β for the clear-sky case. The values of T and H differ substantially from the clear-sky case in that clouds reduce the transmissivity and effectively increase the path length.
Table 2. Cloudy-day transmissivity (T) and equivalent atmospheric height (H) at Barrow
The relationship between H and the cloud optical depth τ was determined using a two-stream radiative—transfer model (Reference KeyKey, 1996). Calculations of the downwelling short-wave fluxes at the surface and TOA were performed using a standard Aretic summer atmosphere, an aerosol optical depth of 0.25. and a liquid-water cloud with the top at 500 mb. a water content of 0.2 g m−3, effective droplet radius of 10 μm. and visible optical depths ranging from 1 to 32. T and H for the model results were determined in the same manner as the empirical results in Table 2. From these data a relationship between T and τ was determined:
Approximately 84% of the variance in H is explained by this relationship.
To estimate the downwelling shortwave flux with observations of the solar zenith angle, surface albedo and cloud optical depth the following procedure is used, for clear conditions, the equivalent atmospheric heighl is fixed at 120 km and the transmissivity is computed as a function of albedo using Equation (13). For cloudy conditions H is determined with Equation (11) and T is computed using Equation (12) with β for clear sky. In both clear and cloudy situations m is determined using Equation (11) and the downwelling shortwave flux is calculated with Equation (10). In the text, tables and Iigures that follow, this method is identified as “TM”.
Comparisons With in Situ Measurements
Measurements of climalological variables from Resolute and Barrow are now used in the various parameterizations and the estimated fluxes are compared to the in situ measurements. Each of these datasets was analyzed separately in order to examine the effects of the differences in surface types/location and time averaging. Results for the two data-sets were nearly identical, with the accuracy ranking oi the various parameterizations being the same and the means and root mean square errors (r.m.s.e.) within 20%. This result is significant given that high temporal resolution data are often not available, or desired, in modelling studies. In the figures and tables presented below, the results for these two datasets are combined.
For the Reference ShineShine (1984) and TM parameterizations, cloud optical depth is required. Here a value of 10 is used, which is near the center of the distribution reported by Reference Leontyeva and StamnesLeontyeva and Stamnes (1994) for optical-depth estimates at Barrow. The all-sky parameterizations require an estimate of SW↓clr which, for all schemes except TM, was computed using Reference ShineShine’s (1984) formulation. For comparison with the Resolute data, shortwave flux parameterizations are computed using the solar zenith angle in the middle of the 15 min data averaging period. For the daily Barrow data, fluxes are computed for each hour of the day using the solar zenith angle in the middle of the hour. The 24 flux values are then averaged to get the daily average flux.
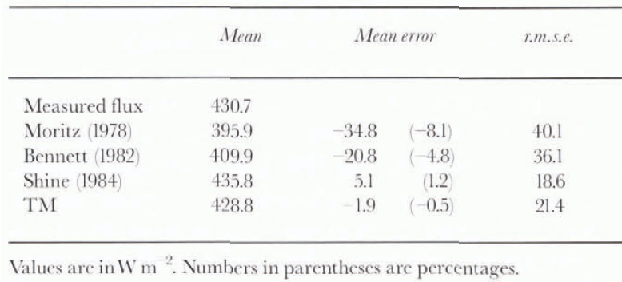
Parameterized shortwave flux errors under clear skies are shown in Figure 1. The mean, mean error and r.m.s.e. of the parameterized fluxes are given in Table 3. The most accurate parameterizations of SW↓clr are TM and that of Reference ShineShine (1984). The equation of Reference BennettBennett (1982) tends to over-estimate fluxes at low sun angles and underestimate fluxes at higher sun angles, but performs surprisingly well considering its simplicity. The parameterized fluxes using Reference Moritz, Barry and JacobsMoritz (1978) are the least accurate. The equation tends to underestimates fluxes, particularly under moderate solar zenith angles.
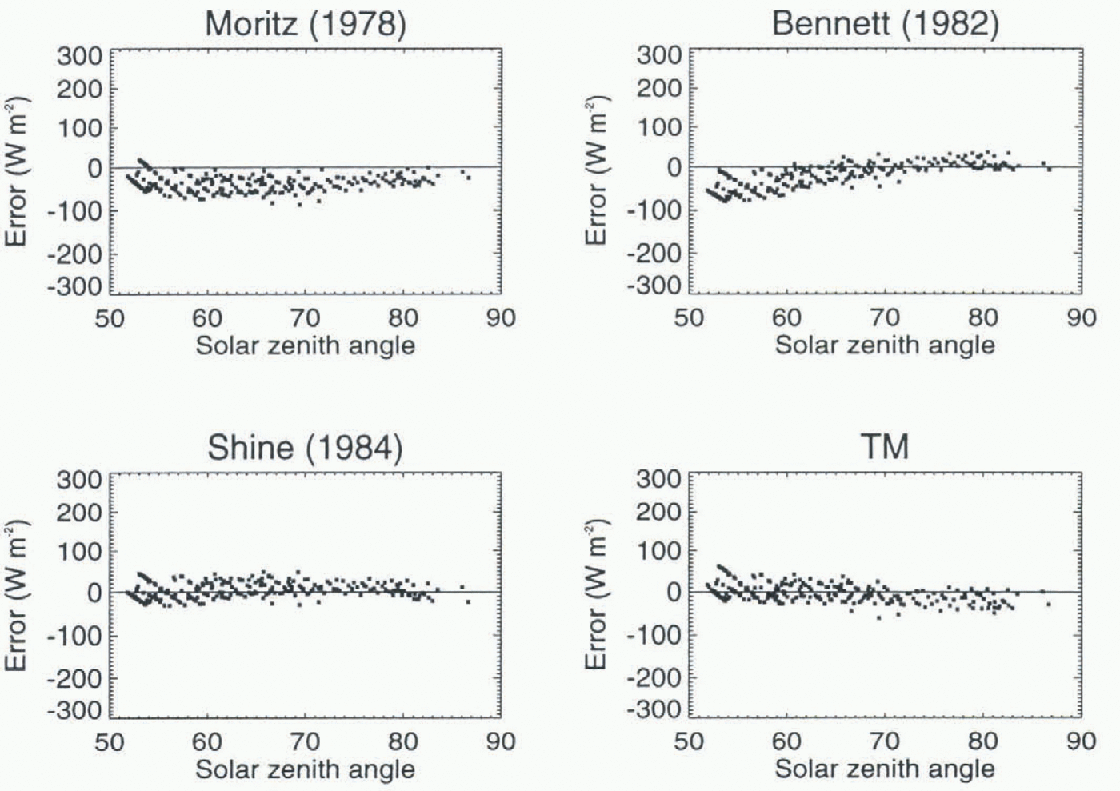
Fig. 1. The shortwave clear-sky flux error for four parameterizations (estimated flux minus the flux measured at Barrow and Resolute).
Table 3. Paramelerized shortwave clear-sky flux errors
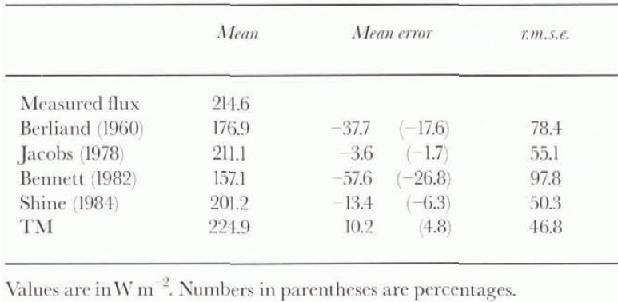
Parameterized shortwave flux errors under all skies are shown in Figure 2. The mean, mean error, and r.m.s.e. of the parameterized fluxes are given in Table 4. The most accurately parameterized fluxes are again those computed using TM and Reference ShineShine (1984) . These parameterizations include surface albedo and cloud optical depth. The parameterizations of Reference Jacobs, Barry and JacobsJacobs (1978) and Reference BennettBennett (1982) are extremely simple, consisting of a coefficient multiplied by the clear-sky flux. Thus, they do not model any of the variability due to factors such as cloud thickness or surface albedo. The parameterization of Bennett significantly underestimates fluxes. The parameterization of Jacobs fares better than that of Bennett, perhaps because the coefficient was selected to fit Canadian Aretic data. Although the r.m.s.e. is still relatively high, the mean error is the smallest of the expressions examined.
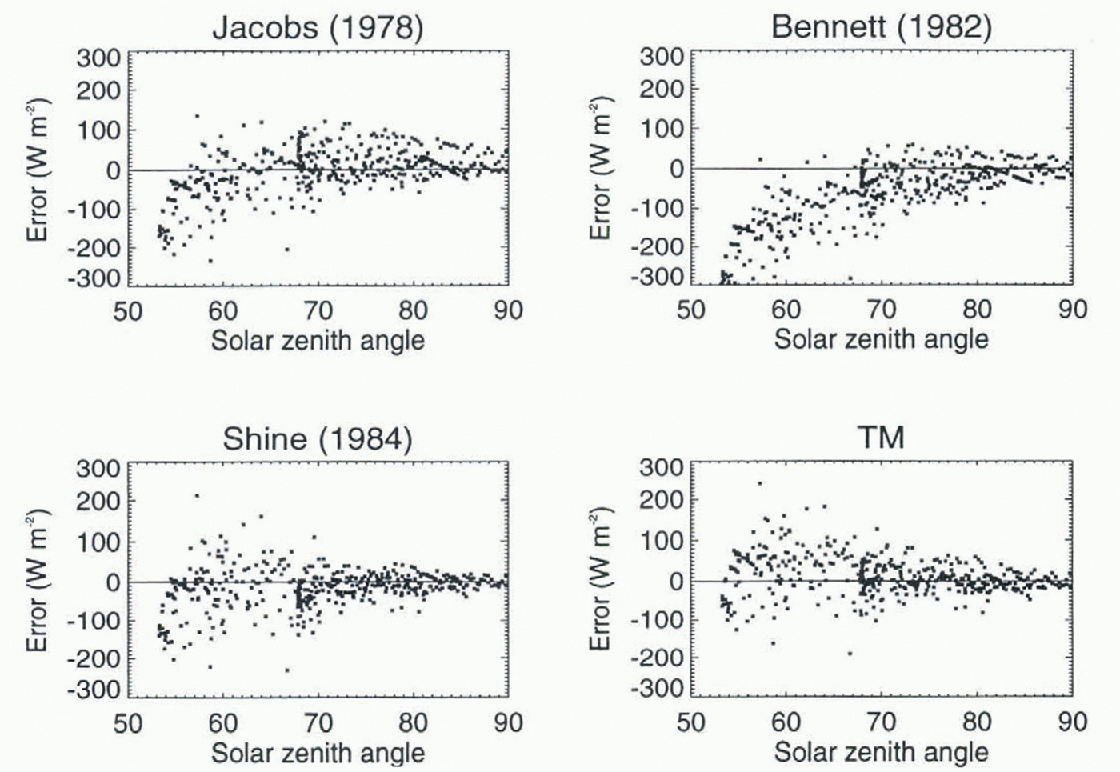
Fig. 2. The shortwave cloudy-sky flux error for four parameterizations (estimated flux minus the flux measured al Barrow and Resolute).
Table 4. Parameterized shortwave all-sky flux errors
What is the effect of cloud optical depth? Both TM and Reference ShineShine (1984) cloudy sky methods exhibit the lowest r.m.s.e. when the optical depth is near 10. This is the approximate mean of the cloud optical depth distribution in the Barrow data, determined using an inverse procedure with a radia-tive—transfer model. Therefore, the coefficients in Equation (14) are appropriate for the optical depth range estimated from the Barrow data, or about 5–25. Camparisons with a radiative-transfer model showed that TM performed consistently, though modestly, better than the Shine method throughout this range. Because the range of surface albedo observed at Barrow is large, both methods are appropriate for open water, dark vegetation and bright snow surfaces.
Conclusions
The objectives of this study were to present a new all-sky parameterization of downwelling shortwave radiation at the Arctic surface, and to evaluate its performance against existing schemes. Using in situ data from two sites, the most accurate parameterizations are the new scheme developed here and that of Reference ShineShine (1984). Comparing the two, the new parameterization offers a more unified approach for clear and cloudy conditions and is more accurate. Additionally, it was developed for a wide range of conditions over both sea ice and land, so it may be more generally applicable. Based on these results the new parameterization is recommended for use in sea-ice models.
Acknowledgements
This researeh was funded by NASA grant NAGW-2407 and NSF grant OPP-9696032. Thanks are due to NOAA/CMDL for providing the Barrow data and to the SIMMS group at the University of Waterloo for the Resolute data.


