In Italy, legislation in 1978 established the gradual replacement of mental hospitals with a range of community-based services, including general hospital psychiatric units and, to a lesser extent, other facilities for acute in-patient care. Law 180 stated that each general hospital unit should have no more than 15 beds, to prevent the establishment of large-scale, asylum-like wards (Reference De Girolamo and Cozzade Girolamo & Cozza, 2000). Since then, all public mental hospitals have been closed, and public in-patient care is now provided by general hospital psychiatric units, university psychiatric clinics and (in limited areas of the country) community mental health centres operating 24 h a day. There are also 54 private in-patient facilities, which were already in place before Law 180 was enacted; fees of patients admitted to these facilities are covered by the national health service. This study reports the first phase of a national survey, the Progetto Residenze (PROGRES) Acute study, funded by the Italian Ministry of Health and jointly coordinated by the Italian National Institute of Health and the Department of Mental Health of Trieste, aimed at obtaining data on the physical characteristics, staffing arrangements, admission rules and activities of in-patient facilities.
METHOD
All 21 Italian regions agreed to participate in the study, except for Sicily. All public and private acute in-patient facilities admitting patients with a primary diagnosis of mental disorder were to be assessed.
Data collection
Information about the number and location of facilities was obtained from the regional health authorities and departments of mental health. The project began in 2001 and data were collected in 2002–2003. Each facility's head psychiatrist (previously informed by letter about the study) was administered a structured interview, previously validated and adapted from the ‘facility form’ used for a national survey of non-hospital residential facilities in Italy (Reference De Girolamo, Picardi and Micciolode Girolamo et al, 2002; Reference Picardi, de Girolamo and SantonePicardi et al, 2006).
All activity data reported here refer to the year 2001 and were obtained through local computerised case registers or calculated manually for the 145 facilities (40.8%) with no electronic information system available. After data collection, thorough quality control was performed, first locally in each region, and then centrally. The admission episodes considered included both episodes of care when patients were directly admitted to a psychiatric unit, and episodes of care for patients initially admitted to another specialty ward (e.g. transfer from a medical ward after a self-harm episode). For the calculation of staffing levels, we included all staff directly involved in patient care, including psychiatrists, psychologists, nurses, nursing aids and social workers.
To assess the variability of several indicators throughout the country, we grouped the regions into four major areas, following the European Union recommendations (European Union, 2003): north-west, north-east, central and southern (including Sardinia).
Statistical analysis
In-patient facility characteristics and activity data were summarised using descriptive statistics. All analyses were conducted using the Statistical Package for the Social Sciences version 12.01 for Windows.
RESULTS
In the 20 participating regions, the project surveyed 262 general hospital psychiatric units, with a total of 3431 beds; 23 university psychiatric clinics, with 399 beds; and 16 community mental health centres, located in Friuli-Venezia Giulia (n=10) and in Campania (n=6), with 98 beds. Nearly all public in-patient facilities participated in the survey. There were only four refusals (three general hospital units and one university clinic), all located in Lombardy. Overall, Italy (excluding Sicily) had 4108 public acute in-patient beds available (including the four units not included in the survey), with 0.78 beds for 10 000 inhabitants.
We also surveyed eight medical wards (limited to some areas in Tuscany) with a total of 20 beds available for psychiatric in-patients, and six additional in-patient facilities with 98 beds, which, however, did not admit involuntary patients. These latter facilities were located outside general hospitals and admitted mainly medium-term patients. As these units presented a different profile from the main three groups, we excluded them from subsequent analyses (together with the four refusals). There were 54 private in-patient facilities, with 4862 beds and 0.94 beds per 10 000 inhabitants; these units were located in ten regions, and all took part in the study. These facilities have only psychiatric beds, and cannot admit compulsory patients.
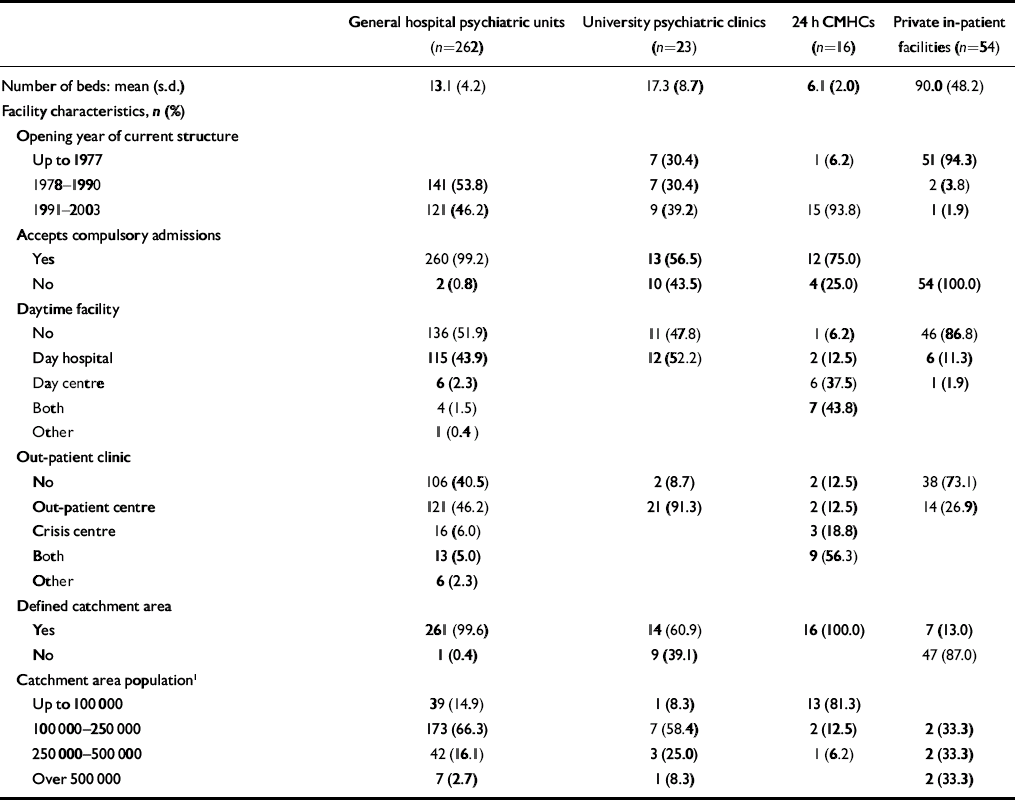
The overall number of acute, short-term psychiatric beds (public and private) in Italy (except Sicily) is therefore 8970, i.e. 1.72 per 10 000 inhabitants. Three regions (Lazio, Campania and Calabria), located in central and southern Italy, which have the fewest public acute beds, also showed the highest concentration of private beds. Table 1 summarises the main organisational characteristics of Italian in-patient facilities.
Table 1 In-patient facility organisation and management characteristics
| General hospital psychiatric units (n=262) | University psychiatric clinics (n=23) | 24 h CMHCs (n=16) | Private in-patient facilities (n=54) | |
|---|---|---|---|---|
| Number of beds: mean (s.d.) | 13.1 (4.2) | 17.3 (8.7) | 6.1 (2.0) | 90.0 (48.2) |
| Facility characteristics, n (%) | ||||
| Opening year of current structure | ||||
| Up to 1977 | 7 (30.4) | 1 (6.2) | 51 (94.3) | |
| 1978-1990 | 141 (53.8) | 7 (30.4) | 2 (3.8) | |
| 1991-2003 | 121 (46.2) | 9 (39.2) | 15 (93.8) | 1 (1.9) |
| Accepts compulsory admissions | ||||
| Yes | 260 (99.2) | 13 (56.5) | 12 (75.0) | |
| No | 2 (0.8) | 10 (43.5) | 4 (25.0) | 54 (100.0) |
| Daytime facility | ||||
| No | 136 (51.9) | 11 (47.8) | 1 (6.2) | 46 (86.8) |
| Day hospital | 115 (43.9) | 12 (52.2) | 2 (12.5) | 6 (11.3) |
| Day centre | 6 (2.3) | 6 (37.5) | 1 (1.9) | |
| Both | 4 (1.5) | 7 (43.8) | ||
| Other | 1 (0.4) | |||
| Out-patient clinic | ||||
| No | 106 (40.5) | 2 (8.7) | 2 (12.5) | 38 (73.1) |
| Out-patient centre | 121 (46.2) | 21 (91.3) | 2 (12.5) | 14 (26.9) |
| Crisis centre | 16 (6.0) | 3 (18.8) | ||
| Both | 13 (5.0) | 9 (56.3) | ||
| Other | 6 (2.3) | |||
| Defined catchment area | ||||
| Yes | 261 (99.6) | 14 (60.9) | 16 (100.0) | 7 (13.0) |
| No | 1 (0.4) | 9 (39.1) | 47 (87.0) | |
| Catchment area population1 | ||||
| Up to 100 000 | 39 (14.9) | 1 (8.3) | 13 (81.3) | |
| 100 000-250 000 | 173 (66.3) | 7 (58.4) | 2 (12.5) | 2 (33.3) |
| 250 000-500 000 | 42 (16.1) | 3 (25.0) | 1 (6.2) | 2 (33.3) |
| Over 500 000 | 7 (2.7) | 1 (8.3) | 2 (33.3) |
All but two of the general hospital psychiatric units were opened in the decade after the 1978 reform law was approved and nearly 60% of the 24 h community mental health centres opened in the past 6 years; in contrast, all private facilities but one were already operational in 1978.
Physical characteristics
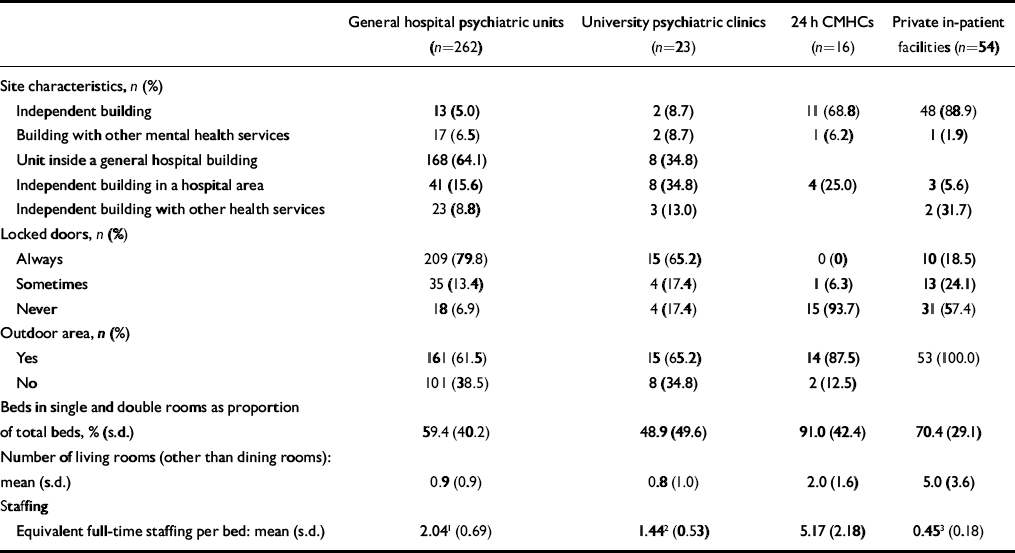
Table 2 shows the main physical and logistic characteristics and the staffing of Italian acute in-patient facilities. Most public facilities (n=230, 81.3%) were located in buildings built before 1980, and only 37 (13.1%) facilities had been built since 1991. As for private facilities, all but one had been built before 1972. All general hospital units and university clinics were functionally integrated with a general hospital. Half of the general hospital units were located on the ground floor, but seven (3%) were situated in basements, and the remainder on upper floors. Approximately two-thirds of general hospital units and university clinics had an outdoor area available for in-patients, whereas this was available for all private facilities.
Table 2 In-patient facility logistics, physical characteristics and staffing
| General hospital psychiatric units (n=262) | University psychiatric clinics (n=23) | 24 h CMHCs (n=16) | Private in-patient facilities (n=54) | |
|---|---|---|---|---|
| Site characteristics, n (%) | ||||
| Independent building | 13 (5.0) | 2 (8.7) | 11 (68.8) | 48 (88.9) |
| Building with other mental health services | 17 (6.5) | 2 (8.7) | 1 (6.2) | 1 (1.9) |
| Unit inside a general hospital building | 168 (64.1) | 8 (34.8) | ||
| Independent building in a hospital area | 41 (15.6) | 8 (34.8) | 4 (25.0) | 3 (5.6) |
| Independent building with other health services | 23 (8.8) | 3 (13.0) | 2 (31.7) | |
| Locked doors, n (%) | ||||
| Always | 209 (79.8) | 15 (65.2) | 0 (0) | 10 (18.5) |
| Sometimes | 35 (13.4) | 4 (17.4) | 1 (6.3) | 13 (24.1) |
| Never | 18 (6.9) | 4 (17.4) | 15 (93.7) | 31 (57.4) |
| Outdoor area, n (%) | ||||
| Yes | 161 (61.5) | 15 (65.2) | 14 (87.5) | 53 (100.0) |
| No | 101 (38.5) | 8 (34.8) | 2 (12.5) | |
| Beds in single and double rooms as proportion of total beds, % (s.d.) | 59.4 (40.2) | 48.9 (49.6) | 91.0 (42.4) | 70.4 (29.1) |
| Number of living rooms (other than dining rooms): mean (s.d.) | 0.9 (0.9) | 0.8 (1.0) | 2.0 (1.6) | 5.0 (3.6) |
| Staffing | ||||
| Equivalent full-time staffing per bed: mean (s.d.) | 2.041 (0.69) | 1.442 (0.53) | 5.17 (2.18) | 0.453 (0.18) |
A considerable proportion of general hospital units (42%, n=111) and two-thirds of university clinics had no single rooms available, and only 8 of the general hospital units (3%) had at least five single rooms; also 8 (15%) private facilities had no single rooms. At least one three-bedded room was present in 126 general hospital units (48.1%), in 12 (52.2%) university clinics and in 39 (82.2%) private facilities. Availability of patient bathrooms varied: general hospital units had a mean of 0.4 (s.d.=0.2) bathrooms for each bed, and university clinics a mean of 0.3 (s.d.=0.2); the mean was slightly higher for the 24 h community mental health centres (0.6, s.d.=0.3). Private facilities had a value similar to the general hospital units (0.4, s.d.=0.1).
Most facilities (95% of general hospital units, 91% of university clinics and 83% of the community centres) had on average three or four rooms available for clinical activities and meetings with patients’ families; some had just one or two rooms. In private facilities, rooms for clinical evaluations were available everywhere, and 40% of them had more than four rooms.
Staffing
All public and private facilities had 24 h coverage with staff on duty at night. The 301 public facilities employed 8058 full-time equivalent professionals (excluding medical residents and volunteers), 86.5% (n=6971) of whom worked full-time. The number of staff in private facilities was substantially smaller (n=2384, of whom 1918 were working full-time); this is reflected in a much smaller equivalent full-time staff per bed in private facilities compared with any type of public facility (Table 2). There was marked variation in the total number of equivalent staff among the three public facility types, with general hospital units having 1.5 times more staff available than the university clinics, and 24 h community mental health centres having more than double the staff per bed than the general hospital units (this is probably accounted for by the fact that in the community centres the staff are also employed for out-patient care). This variation involved all staff types.
Most public facilities (n=239, 79.0%) had a full-time medical staff; in the remainder staff additionally worked part-time in other mental health services such as outpatient and residential facilities. All private facilities but two had only full-time medical and nursing staff.
Clinical supervision of various intensity and quality was available in 107 general hospital units (41.6%) and 29 private facilities (53.7%).
Exclusion criteria for admission and length of stay
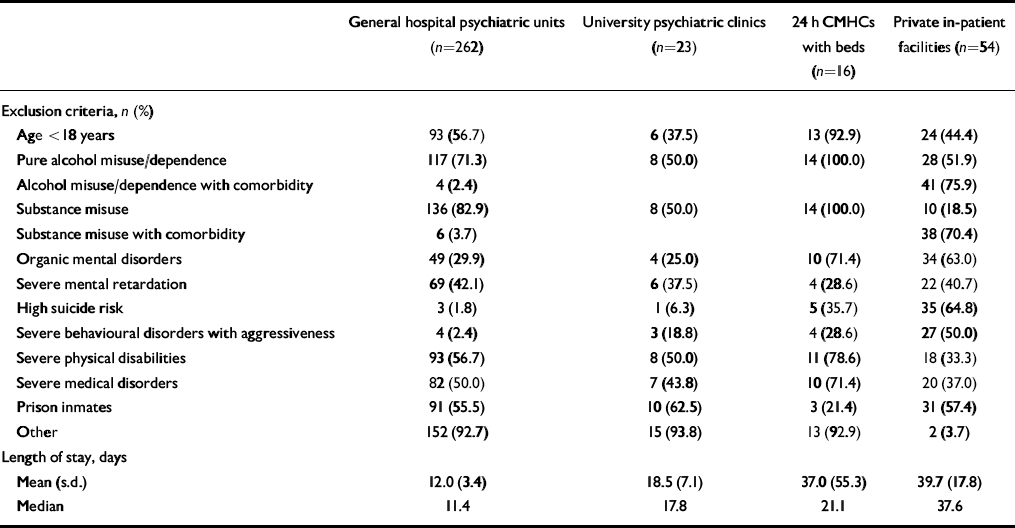
Most facilities used exclusion criteria for admission (Table 3). Criteria varied considerably per facility type and within each facility type. In almost all private facilities admission criteria excluded the most difficult patients.
Table 3 Exclusion criteria and average length of stay
| General hospital psychiatric units (n=262) | University psychiatric clinics (n=23) | 24 h CMHCs with beds (n=16) | Private in-patient facilities (n=54) | |
|---|---|---|---|---|
| Exclusion criteria, n (%) | ||||
| Age < 18 years | 93 (56.7) | 6 (37.5) | 13 (92.9) | 24 (44.4) |
| Pure alcohol misuse/dependence | 117 (71.3) | 8 (50.0) | 14 (100.0) | 28 (51.9) |
| Alcohol misuse/dependence with comorbidity | 4 (2.4) | 41 (75.9) | ||
| Substance misuse | 136 (82.9) | 8 (50.0) | 14 (100.0) | 10 (18.5) |
| Substance misuse with comorbidity | 6 (3.7) | 38 (70.4) | ||
| Organic mental disorders | 49 (29.9) | 4 (25.0) | 10 (71.4) | 34 (63.0) |
| Severe mental retardation | 69 (42.1) | 6 (37.5) | 4 (28.6) | 22 (40.7) |
| High suicide risk | 3 (1.8) | 1 (6.3) | 5 (35.7) | 35 (64.8) |
| Severe behavioural disorders with aggressiveness | 4 (2.4) | 3 (18.8) | 4 (28.6) | 27 (50.0) |
| Severe physical disabilities | 93 (56.7) | 8 (50.0) | 11 (78.6) | 18 (33.3) |
| Severe medical disorders | 82 (50.0) | 7 (43.8) | 10 (71.4) | 20 (37.0) |
| Prison inmates | 91 (55.5) | 10 (62.5) | 3 (21.4) | 31 (57.4) |
| Other | 152 (92.7) | 15 (93.8) | 13 (92.9) | 2 (3.7) |
| Length of stay, days | ||||
| Mean (s.d.) | 12.0 (3.4) | 18.5 (7.1) | 37.0 (55.3) | 39.7 (17.8) |
| Median | 11.4 | 17.8 | 21.1 | 37.6 |
More than 90% of general hospital units (n=239) and university clinics (n=21) did not specify a maximum length of stay. When they did, it was set at 15 days. A maximum length of stay was spelled out by 23 (42.6%) private facilities; this ranged from 15 to 90 days, with the most common length being 60 days. The highest average length of stay was found in private facilities, followed by the community centres, the university clinics and the general hospital units. Even median values showed a substantial difference across facilities.
Figure 1 shows the average length of stay and the bed rate per 10 000 inhabitants of public facilities in the four geographical areas. There was a substantial variation in the length of stay across different areas, with the mean length of stay in the northeast region being almost twice that in the central and southern regions; even the number of public beds shows a substantial difference between the southern region compared with the north-east and central regions.
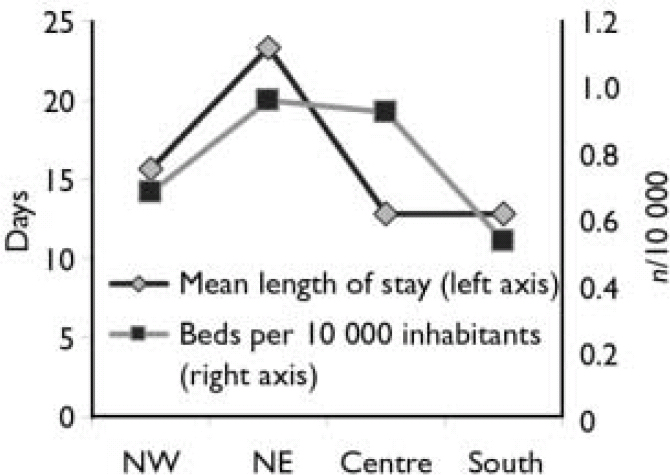
Fig. 1 Mean duration of admissions (left axis) and beds per 10 000 inhabitants (right axis) in public facilities in north-west, north-east, central and southern regions of Italy.
Nearly all general hospital units (n=257; 98%), but only some university clinics (n=16; 70%) and community centres (n=9; 56%) provided emergency room consultations for the general hospital in which they were housed (for the community centres this was the catchment area general hospital). Ninety-eight general hospital units (38%) had a doctor on duty 24 h per day; 107 (42%) had a doctor on call during the night shift; and the remainder had different organisational arrangements. In private facilities a doctor on duty 24 h per day was available in 51 settings (94%), and in the remainder a doctor was on call during the night shift. Nearly all general hospital units (n=253; 97%) and 21 university clinics (91%) also provided psychiatric consultations for other medical and surgical wards.
Activity data
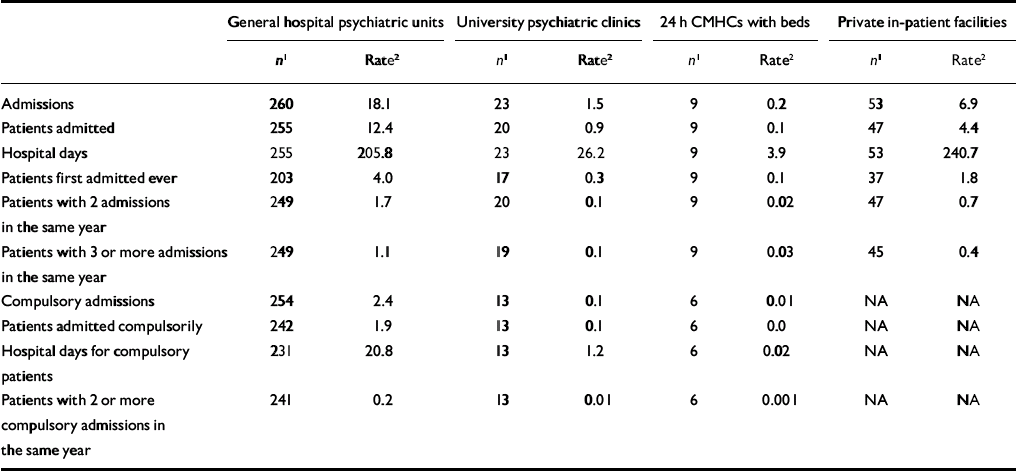
Table 4 shows activity data for the facilities, during the year 2001. Overall, psychiatric admission and admitted patient rates per 10 000 inhabitants in public facilities were 19.8 and 13.4 respectively, whereas in private facilities the rates were 6.9 and 4.4 respectively. There was a mean of 363.0 (s.d.=154.7) yearly admissions for each general hospital unit, with a similar figure for university clinics (342.7, s.d.=197.5) and a lower one for the community facilities (111.9, s.d.=49.7). Private facilities had a higher mean number of admissions (676.3, s.d.=409.5).
Table 4 Activity data of in-patient facilities (year 2001)
| General hospital psychiatric units | University psychiatric clinics | 24 h CMHCs with beds | Private in-patient facilities | |||||
|---|---|---|---|---|---|---|---|---|
| n 1 | Rate2 | n 1 | Rate2 | n 1 | Rate2 | n 1 | Rate2 | |
| Admissions | 260 | 18.1 | 23 | 1.5 | 9 | 0.2 | 53 | 6.9 |
| Patients admitted | 255 | 12.4 | 20 | 0.9 | 9 | 0.1 | 47 | 4.4 |
| Hospital days | 255 | 205.8 | 23 | 26.2 | 9 | 3.9 | 53 | 240.7 |
| Patients first admitted ever | 203 | 4.0 | 17 | 0.3 | 9 | 0.1 | 37 | 1.8 |
| Patients with 2 admissions in the same year | 249 | 1.7 | 20 | 0.1 | 9 | 0.02 | 47 | 0.7 |
| Patients with 3 or more admissions in the same year | 249 | 1.1 | 19 | 0.1 | 9 | 0.03 | 45 | 0.4 |
| Compulsory admissions | 254 | 2.4 | 13 | 0.1 | 6 | 0.01 | NA | NA |
| Patients admitted compulsorily | 242 | 1.9 | 13 | 0.1 | 6 | 0.0 | NA | NA |
| Hospital days for compulsory patients | 231 | 20.8 | 13 | 1.2 | 6 | 0.02 | NA | NA |
| Patients with 2 or more compulsory admissions in the same year | 241 | 0.2 | 13 | 0.01 | 6 | 0.001 | NA | NA |
In total there were 103 260 acute admissions in the facilities for which admission data were available (n=292), with 1 227 676 hospital days. In private facilities admissions totalled 35 880 (n=53), with 1 252 049 bed-days (n=47). In the 284 public facilities providing data on individual patients, there were 70 062 admitted patients in total; in private facilities admitted patients numbered 23 097. The admission/patient ratio ranged from 1.34 in university psychiatric clinics to 1.45 in general hospital units and 1.66 in the community mental health centres, in private facilities the ratio was 1.55.
In public facilities there were 22 893 (32.7%) patients having their first-ever admission to a given facility (but possibly previously admitted to other public or private facilities); 22.3% of admitted patients were at their second admission during the year, and 8.7% had had three or more admissions to the same facility (representing ‘revolving-door’ patients). In private facilities the percentage of patients having their first-ever admission was even higher (40.9%; n=9446); the numbers of patients with two and three or more admissions were 3414 (14.8%) and 1911 (8.3%) respectively.
A mean percentage of 15.6% (s.d.=12.5) of admitted patients in the 259 general hospital units that provided this information came from outside the catchment area; a similar percentage held for university clinics (n=12; 18.5%, s.d.=19.1), but this figure was lower for the 24 h community centres (n=16; 3.9%, s.d.=6.7). In the few private facilities with a defined catchment area (n=7) the percentage of patients coming from outside this area was low (10.2%, s.d.=23.3).
Compulsory admissions
The percentage of compulsory admissions was 12.9% (n=12 793), with a total of 114 570 hospital days. Over the course of the year, 1.4% (n=966) of patients had had two or more compulsory admissions. Figure 2 shows admission rates and percentages of compulsory admissions in public facilities in the four geographical areas, and also the number of public and private beds per 10 000 inhabitants. Where public beds are scarce, as in the south of Italy, compulsory admissions are almost twice as frequent as in other areas. An inverse relationship is also apparent between the numbers of public beds (lowest) and private beds (highest) in the south.
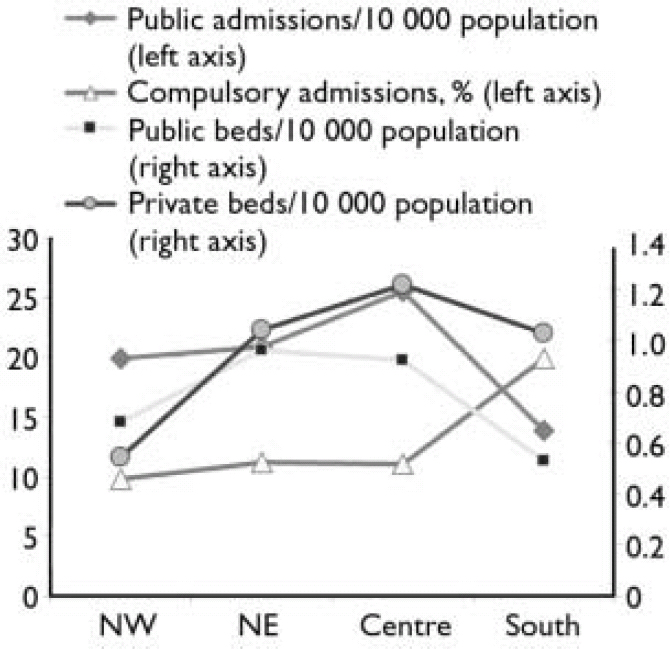
Fig. 2 Admissions per 10 000 inhabitants and percentage of compulsory admissions (left axis) in public facilities in north-west, north-east, central and southern regions of Italy. The number of private and public beds per 10 000 inhabitants are also shown (right axis).
DISCUSSION
This study is the first survey of acute inpatient services conducted in Italy on a nationwide scale. Our results should be interpreted keeping in mind that 24 h home treatment is available in very few areas of the country. Few units specific for alcohol and drug detoxification, or for eating disorders are operating in Italy, and there is no specialised unit for early intervention. There are only six forensic mental hospitals in Italy, all but one of which are run by the Ministry of Justice. Specialised in-patient units admitting only adolescents are rare; in most cases adolescents with severe behavioural disorders requiring in-patient care are treated in general hospital psychiatric units.
Availability of acute in-patient beds
In Italy the number of psychiatric public acute beds shows marked variation between regions; overall, public beds represent 45.8% of all acute in-patient beds. Moreover, almost all private facilities have no defined catchment area, and admit patients from different parts of the country; correlations between public and private facilities on a regional scale should therefore be considered with caution. All private in-patient facilities were built long before the reform law. Although in the north of the country the proportions of public and private beds are similar, in the central and southern regions the percentage of private beds is higher, and in the south the ratio of private to public beds is approximately 2:1. This indicates a very uneven distribution of public and private beds across the country.
It should be highlighted that private inpatient facilities are very different from the former mental hospitals, in terms of size (the 99 public mental hospitals active in 1978 each had 642 beds on average), physical characteristics (mental hospitals were generally old-fashioned and physically inadequate, with large numbers of patients per room, and low standards of diet, clothing and medical care) and case typology (most mental hospital patients were long-stay with admissions often lasting years, many were compulsory). It is therefore impossible to equate current private in-patient facilities with the former mental hospitals.
However, public and private facilities tend to admit a different case mix, as demonstrated by the presence of involuntary patients only in public facilities and by the exclusion criteria operated by private facilities which tend to rule out patients with challenging behaviour (e.g. violent or suicidal behaviour or comorbid substance misuse). A national census day of all inpatients (n=7984) in acute, public and private facilities, conducted on 8 May 2003, found large differences between public and private facilities for the age and gender distribution of in-patients: more men under 35 years old had been admitted to public facilities, whereas women aged 65 years or over had more frequently been admitted to private facilities (further information available on request).
International comparison of the number of psychiatric beds is difficult (Health and Consumer Protection Directorate General, 2004; World Health Organization, 2005), because the very definition of ‘psychiatric bed’ is often unclear. World Health Organization (WHO) Mental Health Atlas data (World Health Organization, 2005) reveal that in western Europe the number of acute public in-patient beds shows substantial variation between 9.0 (Finland) and 0.3 (Greece) per 10 000 inhabitants. However, it is often difficult from WHO data to draw a clear-cut distinction between acute and long-term beds. Moreover, private and forensic beds are not included in the WHO statistics, although private beds can account for a substantial proportion of the total number of psychiatric beds, as in Italy. Although there are also six forensic mental hospitals in Italy, in 2002 the number of forensic beds was very low (0.22/10 000) compared with Sweden (1.43/10 000), The Netherlands (1.14/10 000), and Germany (0.78/10 000), and only slightly higher than in England (0.18/10 000) and Spain (0.15/10 000) (Reference Priebe, Badesconyi and FiorittiPriebe et al, 2005). Therefore, the overall rate of acute beds in Italy (1.72/10 000) is one of the lowest in western Europe.
Logistic and environmental characteristics of in-patient facilities
Many facilities suffer from major logistic and architectural limitations: 3% of general hospital psychiatric units are located in basements; 42% of them have no single bedrooms; and many facilities have a considerable proportion of rooms with three or four beds (hospital rooms with more than four beds are forbidden in Italy). More than a third of general hospital units have no outdoor area for in-patients, nearly 40% have no living room other than a dining room, and some general hospital units and university clinics have no room specifically designated for clinical activities. Private facilities show a mixed picture, including both negative and positive aspects.
The unsatisfactory physical features of many general hospital psychiatric units raise serious problems. Indeed, the paramount influence of the physical in-patient setting environment on clinical and interpersonal variables – including patient and staff satisfaction – has long been recognised (Reference Gutkowski, Ginath and GuttmannGutkowski et al, 1992; Reference HorsburghHorsburgh, 1995; Royal College of Psychiatrists, 1998; Reference Tyson, Lambert and BeattieTyson et al, 2002).
Length of stay
Private facilities presented a high average length of stay. This finding, together with other features of private facilities such as the case mix and the staffing levels, raises some doubts about their definition as acute care services. The longer stay of patients in university clinics compared with general hospital units may be due in part to a different case mix (e.g. complex cases referred for additional evaluation and treatment). The longer stay in 24 h community mental health centres is due to a difference between these services and general hospital units or university clinics – the community centres are more frequently used as flexible tools in response to a variety of critical patient needs (crisis resolution, housing needs, employment problems, family conflicts, etc.) rather than just to treat acute episodes of illness (Reference Dell'Acqua and MezzinaDell'Acqua & Mezzina, 1988; Reference Norcio, Baldi and Dell'AcquaNorcio et al, 2001).
Studies of local services in Italy have consistently shown a shorter duration of in-patient stay in public facilities compared with other European countries (Reference McCrone and LorussoMcCrone & Lorusso, 1999; Reference Sytema, Burgess and TansellaSytema et al, 2002). The median length of stay in general hospital units found in our study (11.4 days) was notably lower than that found in England in 2003 (18 days; Reference GloverGlover, 2007).
Open v. locked doors
Most general hospital units (nearly 80%) and two-thirds of university clinics had locked doors. In contrast, almost none of the community centres had a locked-door policy. Although most private facilities did not have doors always locked, they did not admit involuntary patients. In England, a 1-day survey of 118 acute psychiatric units, conducted during unannounced visit, found that only 9% of the units were locked (Reference Ford, Durcan and WarnerFord et al, 1998). Bowers et al (Reference Bowers, Crowhurst and Alexander2002), in a survey of 87 acute units in the London area, found only 25% of units to be constantly locked and 45% locked only occasionally. In another survey involving 24 in-patient services in five European countries (Austria, Hungary, Romania, Slovakia and Slovenia), located in both mental and general hospitals, only 21.4% of 4191 in-patients evaluated on census day were found to be accommodated in locked units (Reference Rittmannsberger, Sartorius and BradRittmannsberger et al, 2004). In brief, locked units admitting acute patients seem to be more common in Italy than in other European countries; since there are fewer beds, these units tend to admit a selected in-patient population with challenging behaviours, which can partly account for this finding.
Staffing
In public facilities the staff/patient ratio ranged from 1.44 to 5.17 showing that facilities for acute patients rely greatly on human resources; in contrast, ratios for private facilities were markedly smaller. The number of staff working in Italian public facilities is higher than that found in other countries, although some of the differences may be explained by the type of professionals included in the count. In the UK, the ratio of staff to resident beds in acute in-patient facilities was 1.27 (Reference Lelliott, Audini and KnappLelliott et al, 1996), whereas studies conducted in the USA found staff/resident ratios ranging from 0.32 to 2.08 (Reference Coleman and PaulColeman & Paul, 2001), or higher than 3.3 (Reference DonatDonat, 2003); this variability suggests that there are no strict quantitative standards for staff.
The low staffing level in private facilities (0.45 staff/patient ratio) can be partly explained by a daily variation in the number of staff on site, with fewer staff present during the night shifts, because the larger size of private facilities makes possible specific organisational arrangements (e.g. one nurse present in a ward can be available in case of emergency in another ward).
Furthermore, varying case mix and facility type function may also account for observed variability in staff: nearly all general hospital psychiatric units accept compulsory admissions and provide psychiatric consultations to other hospital wards, whereas private facilities admit many patients not requiring intensive, acute care but rather needing long-term assistance and support; data from the second phase of our study, with some 3000 patients admitted to public and private facilities individually evaluated, will shed light on this issue. Official staffing requirements in Italy are currently established by regions and this issue will be given further attention.
Finally, specific professional roles (clinical psychologists, occupational therapists, etc.) are rather uncommon, suggesting the need to strengthen effective multidisciplinary teams.
Activity data
We found 19.8 admissions in public facilities per 10 000 inhabitants; if we include private admissions, we have a total rate of 26.7 psychiatric admissions per year per 10 000 inhabitants. The public admission rate is substantially lower than that found in England for the age group 16–64 years in 1999–2000 (32/10 000 inhabitants; Reference Thompson, Shaw and HarrisonThompson et al, 2004). The difference, however, is less than expected, given the remarkable difference in bed rates. This can be explained by longer average stay and possibly lower bed occupancy in the English services. The occupation index in Italian public facilities was around 90%.
Admission rates show marked variation across different areas – a finding already reported in Italy even in a comparison of neighbouring areas (Reference De Girolamo, Mors and Rosside Girolamo et al, 1988) – related to variability in exclusion criteria and to the range and quality of community services. Current variability in Italian admission rates might be reduced by the use of more consistent admission criteria and more fair availability of beds across different areas.
Involuntary admissions
Compulsory admissions represent 13% of all admissions per year in Italy, but the rate per 10 000 inhabitants is only 2.5. According to a recent review, the percentage of compulsory admissions in relation to all admissions ranges from a low of 3.2% in Portugal to a high of 30% in Sweden, with a median value of 13.2% (Reference Salize and DressingSalize & Dressing, 2005). Yet, in the same European survey the rate per 10 000 inhabitants ranged from a low of 0.6 to a high of 21.8 with a median value of 7.4, which is three times the Italian rate.
In the survey of 24 different European sites by Rittmannsberger et al (Reference Rittmannsberger, Sartorius and Brad2004), 11.4% of in-patients had been admitted under compulsion. Latest UK data show a rate of about 5.5 compulsory admissions per 10 000 inhabitants for England (Department of Health, 2001). Analyses of temporal trends show substantial stability in the percentages of compulsory admissions in the past two decades (Reference Guaiana and BarbuiGuaiana & Barbui, 2004).
Implications of the study
There is no evidence that a balanced system of mental healthcare can be provided without acute beds (Reference Thornicroft and TansellaThornicroft & Tansella, 2004). Despite the importance, of acute in-patient care, its quantitative and qualitative features remain largely unexplored and many problems still await appropriate solutions (Reference Quirk and LelliottQuirk & Lelliott, 2001; Reference Lelliott and QuirkLelliott & Quirk, 2004) – and this holds true in Italy as elsewhere. Our findings highlight the need for a thorough revision of the role and the function of Italian acute care services within the framework of a comprehensive and evidence-based mental health policy.
Acknowledgements
This paper is dedicated to the memory of Ian Falloon, in gratitude for his outstanding contribution to the PROGRES projects since their beginning. The study was supported by a grant from the Ministry of Health. Special thanks are due to Dr Paul Lelliott, Dr Stephen Priebe and Dr Richard Warner for their valuable comments. Dr Giorgio Bignami provided continuous support throughout the National Mental Health Project, during which this study was conceived; Ms Elena Cuomo has provided valuable bibliographic help during the whole project.
The PROGRES–Acute group includes the following national and regional coordinators and consultants: F. Amaddeo, A. Barbato, G. Borsetti, R. Bracco, R. Canosa, M. Casacchia, I. Casula, P. Ciliberti, A. Colotto, A. D'Aloise, G. de Girolamo, G. Dell'Acqua, M. De Palma, W. Di Munzio, A. Gaddini, G. Grassi, N. Longhin, M. Miceli, R. Miglio, P. Morosini, M. Nicotera, M. Percudani, B. Norcio, A. Picardi, R. Potzolu, E. Rossi, P. Rucci, G. Santone, S. Schiaffino, F. Scotti, R. Tomasi and E. Zanalda. Researchers include: G. Agostani, F. Basile, F. Basilico, N. Battino, L. Bavero, G. Bazzacco, L. Biscaglia, R. Borio, S. Buttacavoli, B. Caporali, F. Cappelletti, L. Caserta, L. Cifarelli, P. Congia, M. Dazzi, L. Elia, A. Galli, R. Gangi, P. Ghirardo, L. Giordano, S. Goldoni, A. Guidoni, G. Morelli, M. Nassisi, A. Pettolino, L. Pinciaroli, G. Pitzalis, C. Sighinolfi, G. Spinetti, A. Trequattrini, U. Unterfrauner, K. Wolf and L. Zecca.


eLetters
No eLetters have been published for this article.