Introduction
The study of chemical parameters stored in solid precipitation that accumulates on polar ice sheets provides a unique tool for obtaining information on the chemical composition of the past atmosphere from recent decades to the last climatic cycles. Methane and carbon dioxide occur as trace gases encapsulated in air bubbles within the ice. Aerosols and water-soluble gases, which are trapped in the ice lattice, are shorter-lived atmospheric species, and their interpretation in terms of past atmospheric chemistry is more complex. There are three important questions, concerning (1) the relationship linking the composition of the atmosphere and that of the snow at the time of deposition, (2) the geographical significance of high-latitude solid-precipitation records for these short-lived atmospheric species, and (3) the reactivity of the atmosphere at high latitudes.
Initiated in 1983 at Neumayer and in 1987 at Mawson (Fig. 1), programmes dedicated to the chemistry of aerosols present in the boundary layer of coastal Antarctic regions have been extended through the Coastal Antarctic Aerosol and Snowfall Chemistry (CAASC) programme toDumont d’Urville and Halley since 1991. The main objective of these programmes was to obtain a general statement about the chemistry of aerosols in these high-southern-latitude regions and to document the cleanest part of the Earth’s lower atmosphere (Reference Wolff, Legrand and WagenbachWolff and others, 1998). In addition to these year-round aerosol studies, the recent Sulphur Chemistry in the Antarctic Troposphere Experiment (SCATE) programme carried out during summer 1994 at Palmer station was dedicated to establishing a comprehensive database for understanding the chemistry of the sulphur cycle at high southern latitudes (Reference Berresheim and EiseleBerresheim and Eisele, 1998).

Fig. 1. Map of the Antarctic showing site locations.
In this paper, we first summarise major findings of recent atmospheric programmes for sulphur (dimethylsulphide (DMS), sulphate and methanesulphonate (MSA)) - and nitrogen (ammonium and nitrate)-derived species present in the atmospheric boundary layer of coastal Antarctic regions. We then examine long-term ice records, particularly the Vostok record which covers the last four climatic cycles, in the light of our improved understanding of the sulphur and nitrogen atmospheric cycles in high-southern-latitude regions.
The Nitrogen Cycle
Nitrate
Apart from N2O, a long-lived trace gas encapsulated in air bubbles, nitrate and, to a lesser extent, ammonium are the major nitrogen species trapped in polar ice. Nitrate ice-core data are relatively easy to analyze, so a large number of them exists, including those from deep ice cores spanning the last ice age. Nitrate in polar ice, however, remains an enigma (Reference Legrand and KirchnerLegrand and Kirchner, 1990; Reference Wolff and DelmasWolff, 1995), while its records have been proposed as a proxy of solar activity (modulated by odd nitrogen in the upper stratosphere), lower stratospheric temperatures and free tropospheric sources including lightning. Based on the similarity between the atmospheric nitrate seasonal cycle and the seasonal cycle of 210Pb at Mawson, Reference Savoie, Prospero, Larsen and SaltzmanSavoie and others (1992) suggested a continental source for nitrate present in the boundary layer of this coastal Antarctic site. Another study at Neumayer failed to confirm this similarity between nitrate and 210Pb (Reference Wagenbach, Wolff and BalesWagenbach, 1996). Furthermore, a strong depletion of the 15N/14N ratio is seen in atmospheric nitrate samples collected at Neumayer in early spring/summer, arguing in favor of a non-tropospheric contribution to the nitrate budget of the boundary layer at this coastal Antarctic station (Reference Wagenbach, Wolff and BalesWagenbach, 1996).
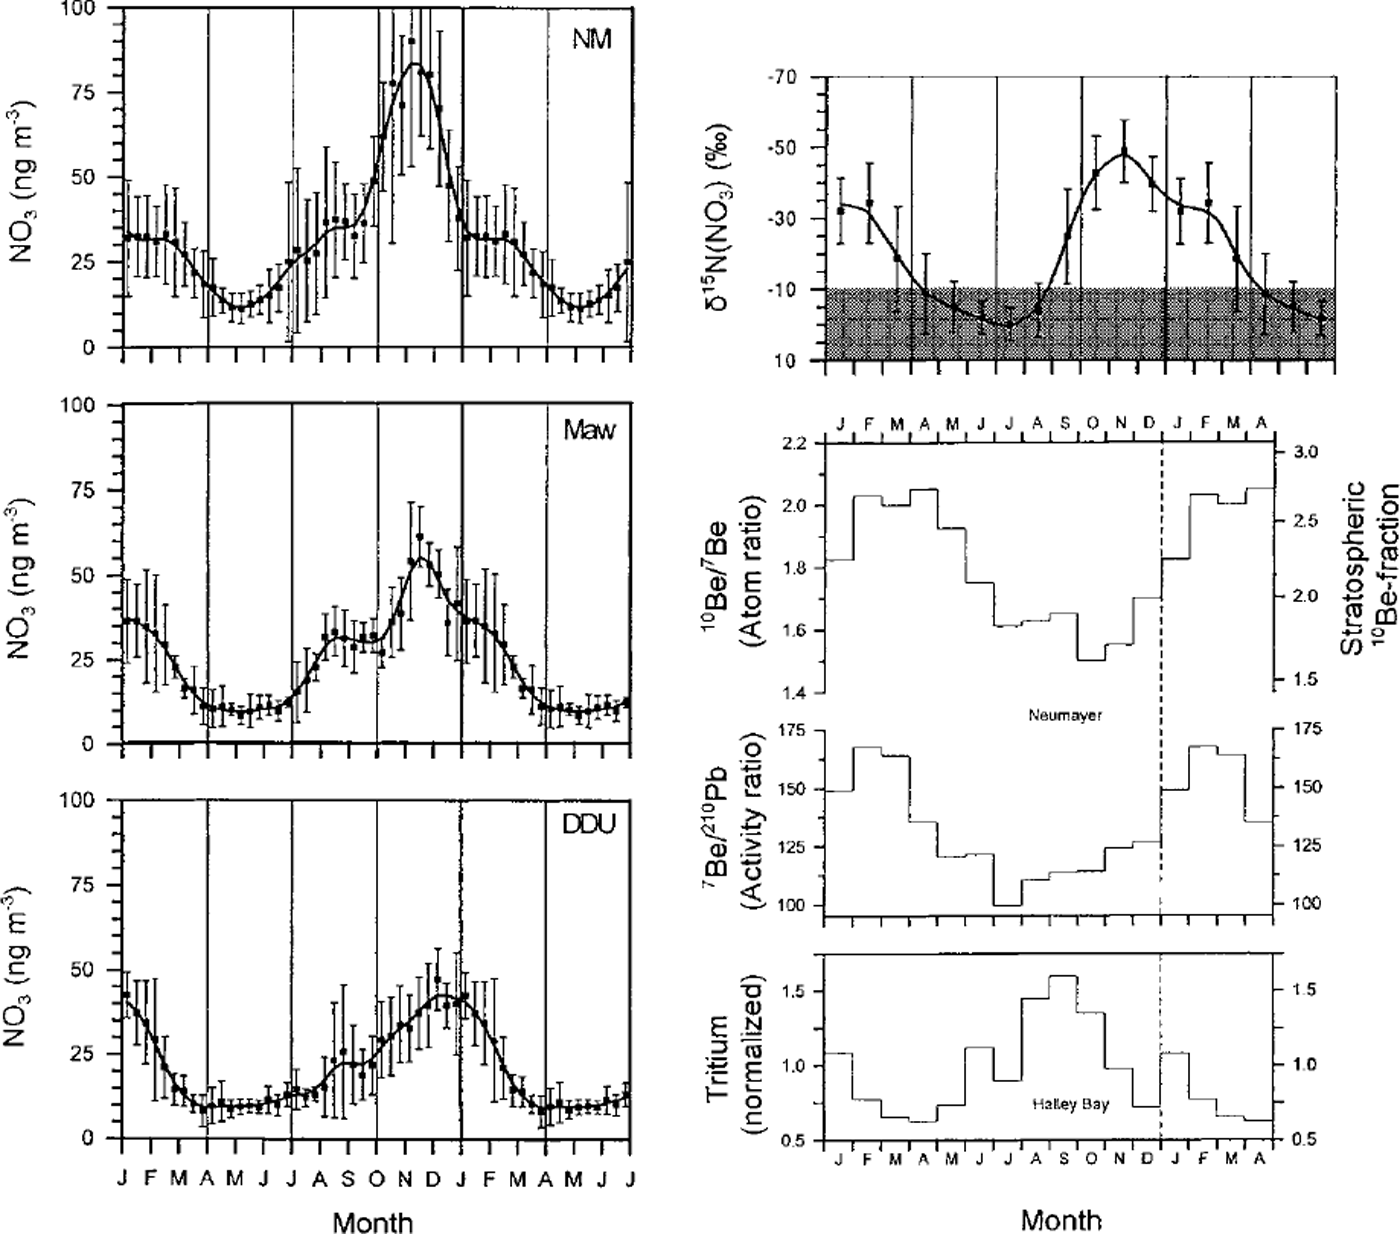
The mean seasonal nitrate pattern in the atmospheric boundary layer of coastal Antarctic sites (Fig. 2) reveals a quasi-constant background level near 10 ng m−3 from April to June and a seasonal maximum from spring to midsummer. Based on concurrent measurements of 7Be, 10Be, 210Pb and δ15 N in aerosols at Neumayer and tritium in precipitation at Halley (Fig. 2), Reference Wagenbach, Legrand, Fischer, Pichlermayer and WolffWagenbach and others (1998) concluded that the main part of the spring/summer seasonal nitrate maximum is stratospheric in origin, with a secondary peak in winter and late summer due to sedimentation of polar stratospheric clouds (PSCs) and stratospheric air-mass intrusion, respectively. Provided that the air-snow relationship of nitrate is well understood, the possibility exists of reconstructing some aspects of the past chemistry and climatology of the stratosphere, including the nitrogen stratospheric budget and the intensity of the stratosphere-troposphere exchanges. An additional complication is the recent finding that alkyl nitrates, possibly of marine origin, dominate the odd nitrogen budget at coastal sites in summer (Jones and others, 1999). This reopens the question of possible non-stratospheric sources for material that ends up as nitrate in ice.

Fig. 2. Left: Mean annual nitrate cycles at Dumont d’Urville (DDU; 1991-94), Neumayer (NM; 1983-95), and Mawson (Maw; 1987-90) (adapted from Reference Wagenbach, Legrand, Fischer, Pichlermayer and WolffWagenbach and others, 1998). Right: Seasonal pattern of the stratospheric aerosol input at Neumayer indicated by the enhancement of the 10Be/7Be (1983-85) or 7Be/210Pb (1983-93) ratios; PSC-related material indicated by enhanced tritium content (normalised to the individual annual means) in Halley precipitation (1983-93); and mean annual cycle of δ15 Nm nitrate (1986-92) at Neumayer (shaded area here refers to the overall range of δ15 N commonly observed in tropospheric nitrate) ( adaptedfrom Reference Wagenbach, Legrand, Fischer, Pichlermayer and WolffWagenbach and others, 1998). Vertical bars refer to the ±16 standard deviation in the interannual variability.
A previous study of nitrate present in the Vostok ice (0-2200 m depth) deposited over the last climatic cycle (Reference Legrand, Lorius, Barkov and PetrovLegrand and others, 1988) shows that nitrate concentrations, close to 20ngg−1 during the warm climatic stages, were enhanced in glacial ice. High nitrate levels in glacial ice coincide with large enhancements of mineral dust content. Thus, Reference Legrand, Lorius, Barkov and PetrovLegrand and others (1988) concluded that the enhancement of the nitrate content in glacial ice may reflect efficient scavenging of HN03 by dust particles at these times. Investigation of nitrate in shallow snow layers at Vostok revealed a rapid decrease of concentrations with depth, from 100 ngg−1 close to the surface to 20 ngg−1 at 2 m depth (Reference Mayewski and LegrandMayewski and Legrand, 1990). This observation strongly suggests that a large part of the nitrate initially trapped in the Vostok snow deposits as volatile nitrate like HN03 , and is thereafter slowly re-emitted toward the atmosphere via processes that are not yet clearly understood (see Reference Mulvaney, Wagenbach and WolffMulvaney and others, 1998 for updated discussion). Because the impurity content of the glacial ice is very different from that at the present, we can speculate that the intensity of the HN03 reemission may have changed at Vostok during ice ages with respect to the situation at present (Reference Wolff and DelmasWolff, 1995; Reference Legrand, Leopold, Domine, Wolff and BalesLegrand and others, 1996). Thus, an alternative explanation for the enhancement of nitrate levels in glacial ice at Vostok may be that the enhanced dust input in the ice deposited during the ice age limited the re-emission of nitrate with respect to the situation at present.
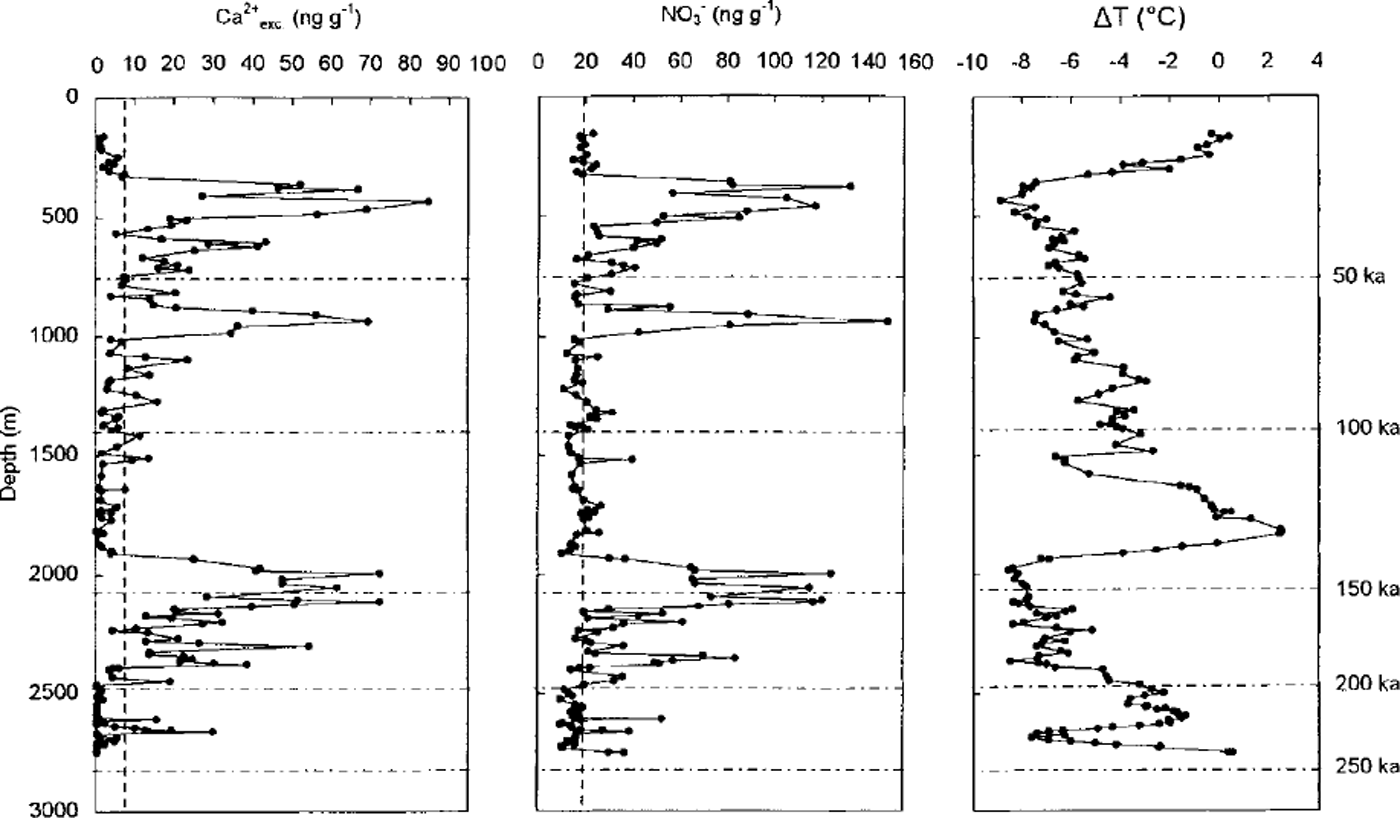
In Figure 3, we report the nitrate and non-sea-salt calcium (denoted Ca2+ exc) profiles for Vostok, extended to the last two climatic cycles (0-2755m depth). Figure 3 confirms that a nitrate level close to 20 ngg−1 characterised the Vostok interglacial ice and that higher nitrate contents were present in dust-rich ice (i.e. high Ca2+ exc content) deposited during the two ice ages. Whatever the reason for the observed increase of nitrate in glacial ice containing a large amount of dust, it remains difficult to interpret the meaning of these dust-rich ice layers for the atmospheric nitrogen oxide budget over Antarctica in the past. Nevertheless, as seen in Figure 3, numerous Vostok ice samples deposited during the ice ages contain <20ngg−1 of nitrate in spite of Ca2+ exc levels higher than those observed in interglacial ice (i.e. 1.7 ± 1.9ngg−1). Hence, we examine the Vostok nitrate profile by considering only samples containing a relatively low dust amount. For those samples containing <15ngg−1 of Ca2+ exc, we tentatively try to estimate the residual effect of the dust input. As reported in Figure 4, a linear regression of N03- and Ca2+ exc yields [NO3 –] = 4.0 + 1.542 [Ca2+ exc.] (r2 = 0.65 for 54 samples) in samples containing >20 ng g−1 of Ca2+ exc. In order to estimate the residual effect of dust on nitrate levels present in ice layers containing <15 ng g−1 of Ca2+ exc, we correct total nitrate content by subtracting 1.542 [Ca2+ exc]. The remaining part of nitrate (denoted NO3- res. may be more representative of changes of the nitrogen oxide cycle in the past. As seen in Table 1, NO3- res. levels are lower in ice corresponding to cold climates and low snow-accumulation rates. Reduced snow-accumulation rates during the ice age may cause a larger re-emission of nitrate after deposition. However, Reference Legrand and DelmasLegrand and Delmas (1988) reported a mean nitrate content of 18.5 ± 8.0 ng g-1 in Holocene ice deposited at Dome C, a site characterised by a mean annual snow accumulation of 34 kg m−2. They also observed lower nitrate concentrations (–16 ng g−1) in Dome C glacial ice containing <15 ng g−1 of calcium. These nitrate levels in the Dome C ice are very similar to those observed at Vostok, suggesting that the nitrate content of ice deposited over the high Antarctic Plateau is not modulated by small changes of the snow-accumulation rate.

Fig. 3. Vostok depth profiles of nitrate and non-sea-salt calcium (Ca2+ exc) contents along with temperature change (δT) with respect to present (depicted by the deuterium profiles from Jouzel and others, 1996) over the last two climatic cycles. Horizontal dashhed lines refer to mean Holocene levels of nitrate (20 ng g1) and Ca2+ exc. (3ng g1)

Fig. 4. Nitrate vs Ca2+ exc. levels of the Vostok ice deposited over the last two climatic cycles. Triangles refer to samples being dust-rich (Ca2+ exc levels >20ng g-1), circles to samples having <20 ng g-1 of Ca2+ exc. Dashed line refers to the linear regression between NO3 – and Ca2+ exc of Vostok samples having >20 ng g-1 of Ca2+ exc.
Table 1. Vostok ice samples having a moderate dust content (<15ng g-1 of Ca2+ exc)

Thus, lowered snow-accumulation rates during the ice age cannot explain lowered NO3 - res. levels observed in Vostok glacial ice. While not proofs, the preceding considerations suggest that atmospheric nitrate levels may have been reduced during the ice age with respect to present climatic conditions over central Antarctica. Such a conclusion is consistent with the expected effects of global cold climatic conditions on the stratospheric odd nitrogen budget. At present, the stratospheric nitrogen oxide reservoir is mainly built up from N20 surface emissions. One key parameter modulating the main natural N 2 0 source (soils) is related to the humidity of soils. Thus, as with methane, a decrease of this source is expected during the ice age due to drier climatic conditions over source regions (Reference CiceroneCicerone, 1989). Measurements of N20 in ice air bubbles indeed indicated a decrease of tropospheric concentrations during the ice age (Reference Zardini, Raynaud, Scharffe and SellerZardini and others, 1988; Reference Leuenberger and SiegenthalerLeuenberger and Siegenthaler, 1992). On the other hand, because of a decreasing effect of greenhouse trace gases such as C02 during the ice age, we can speculate that the lower polar stratosphere was warmer than at present. This last effect may have induced a less frequent occurrence of PSCs within the Antarctic vortex during ice ages. The water-vapor budget of the stratosphere itself may also have changed during cold climates, because of lowered methane concentrations. Less frequent occurrence of PSCs during ice ages may have weakened the exchange of odd nitrogen from the stratosphere into the polar troposphere and hence decreased nitrate concentrations of glacial ice.
When considering only samples having a moderate dust content, the Vostok glacial ice contained some 20% (down to 50%, if we correct for the dust effect) less nitrate than ice deposited during warm climates. This is consistent with a stratospheric origin of nitrate present in the Antarctic boundary layer which may have been weakened under cold climatic conditions by a lowered N20 stratospheric loading and/or by less efficient transport from the stratosphere due to reduced frequency of PSCs in a warmer lower stratosphere. Clearly further work is required to confirm these conclusions, which should include the study of deep ice cores with significantly different snow accumulation rates.
Ammonium
Unlike nitrate, ammonium is present in Antarctic ice at levels close to a few ng g"1 or less. Thus, reliable ammonium ice-core data remain very rare and no geochemical information has yet been extracted by studying ammonium in deep Antarctic ice cores. However, by itself the observation of an ammonium level close to lngg−1 in Antarctic ice appeared inconsistent with ammonium atmospheric levels of tens of ng m−3 observed at Mawson (coastal Antarctica) by Reference Savoie, Prospero, Larsen and SaltzmanSavoie and others (1992). Atmospheric measurements carried out in the framework of the CAASC programme show that very high ammonium atmospheric concentrations (several hundreds of ng m−3) are related to the proximity of penguin colonies from which ammonia is emitted following the bacterial decomposition of uric acid (Reference Legrand, Ducroz, Wagenbach, Mulvaney and HallLegrand and others, 1998). In Antarctic stations which are not exposed to penguin-colony emissions, such as Neumayer, mean annual ammonium concentrations are close to a few ng m−3, with a maximum in January-March in phase with the increase of biogenic sulphur species. Based on these Neumayer data, Reference Legrand, Ducroz, Wagenbach, Mulvaney and HallLegrand and others (1998) suggested that ammonium present in these regions may be related to ammonia oceanic emissions occurring south of 50° S in summer. Finally, the ammonia neutralisation of acidic sulphur aerosols remains very weak, as depicted by NH4 +/(MSA+SO42-) weight ratios close to 2.5% (i.e. a molar ratio of 0.13) observed in summer aerosols at Neumayer.
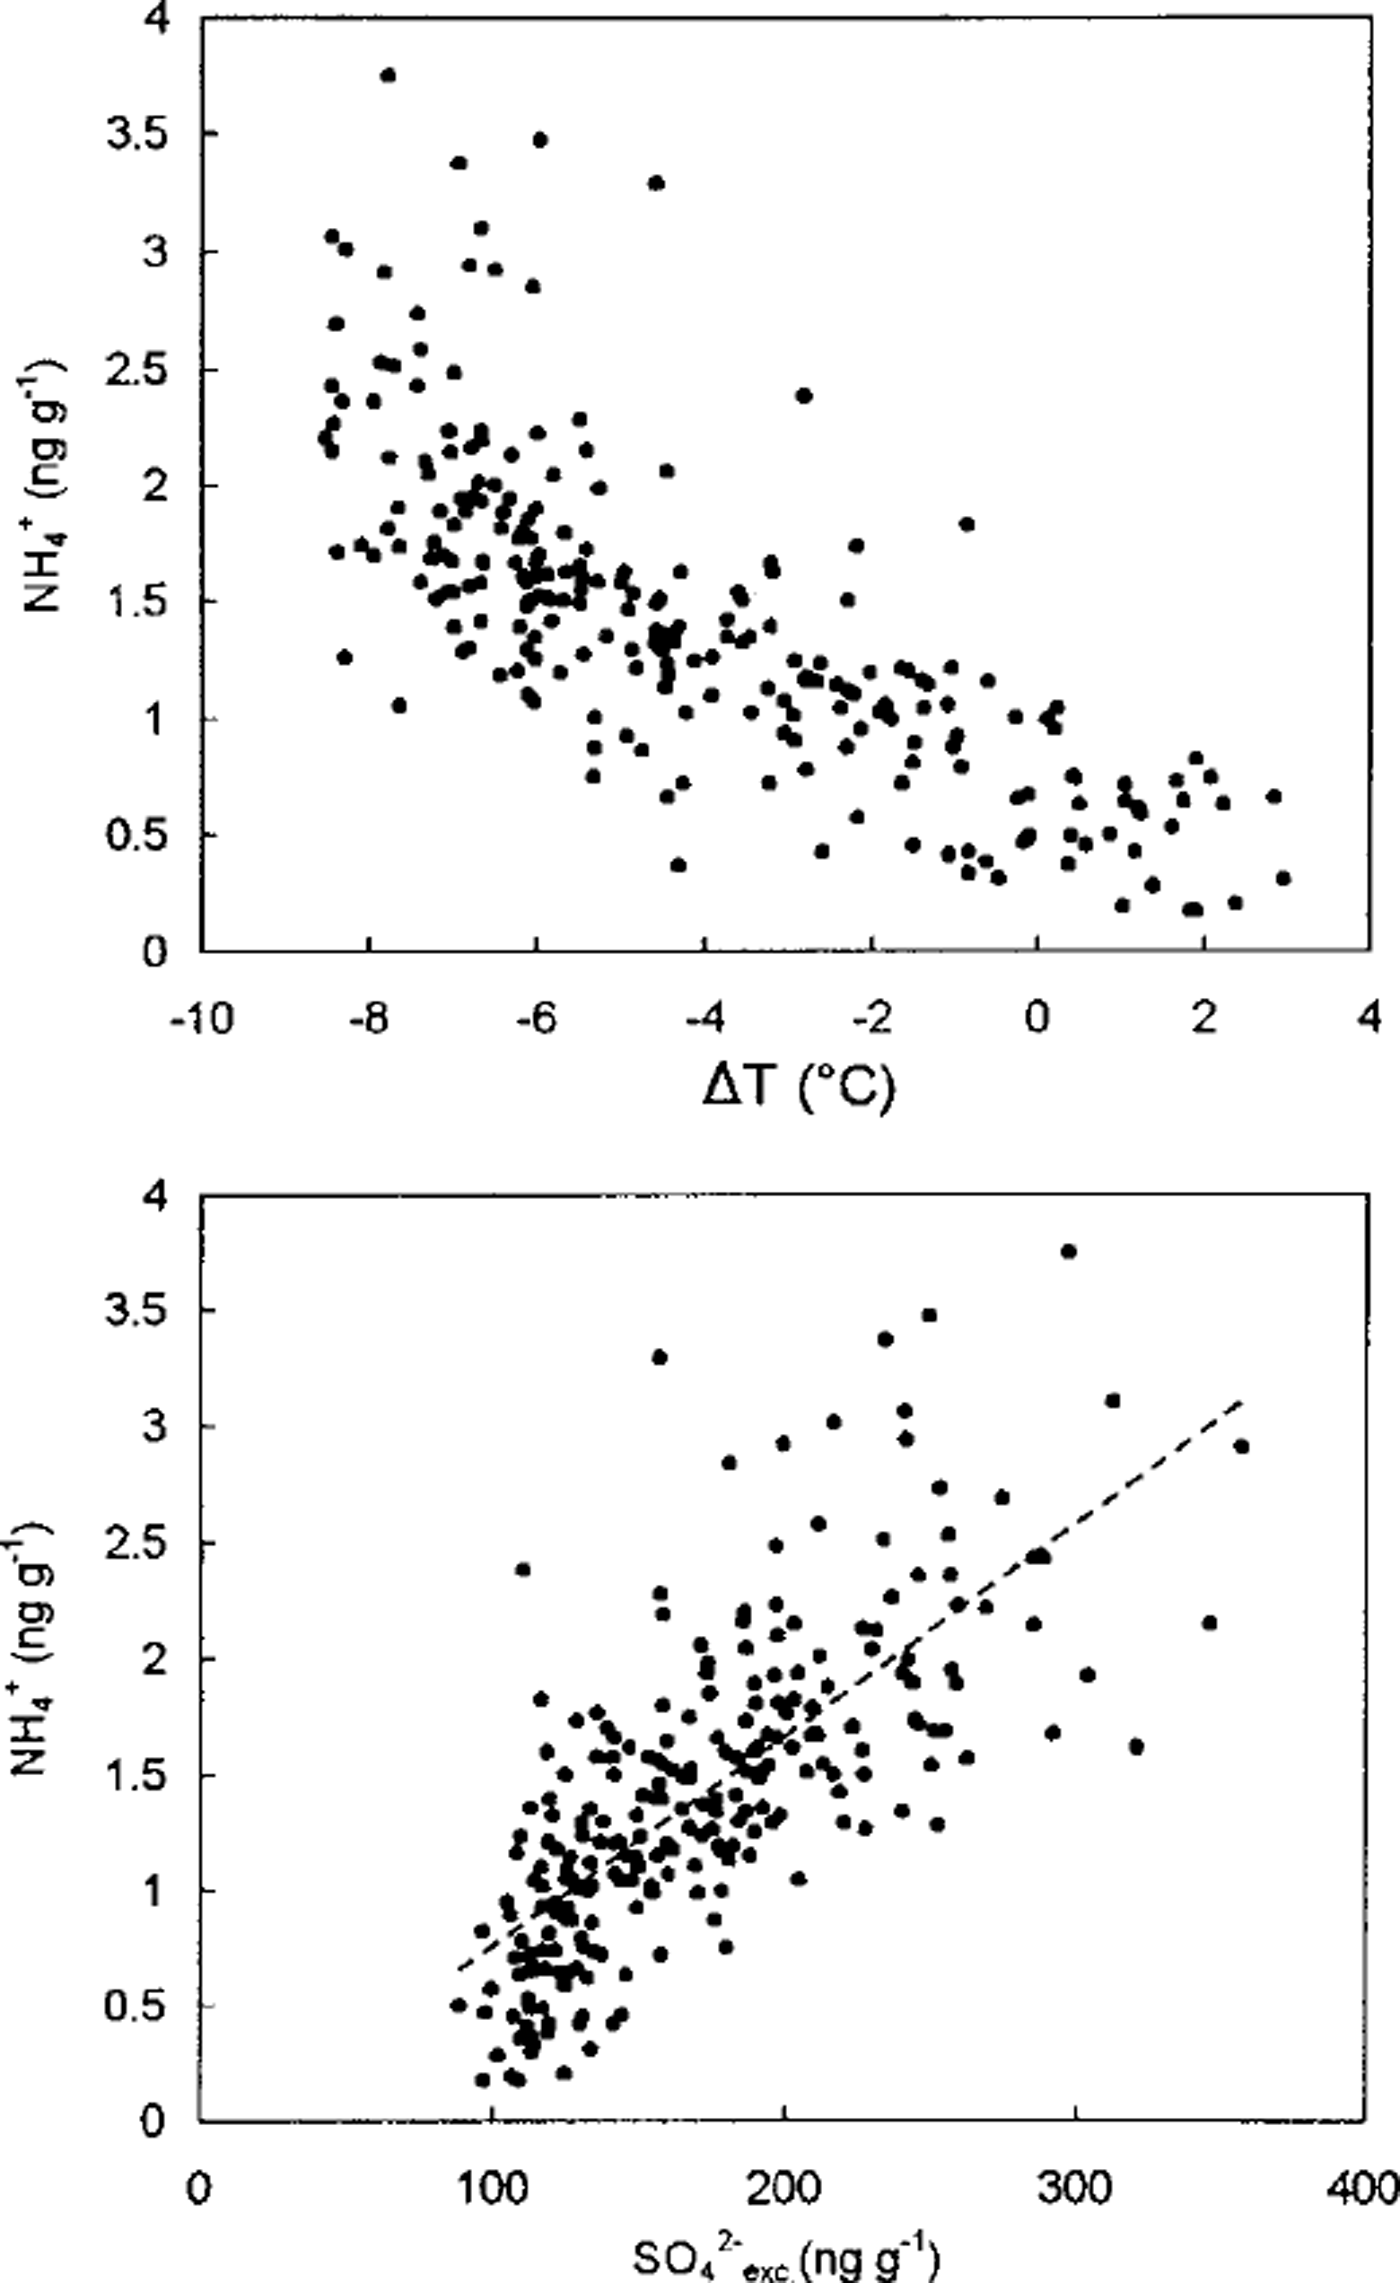
Previous studies of ammonium in the deep Vostok (Reference Legrand, Lorius, Barkov and PetrovLegrand and others, 1988) and Dome C (Reference Legrand and DelmasLegrand and Delmas, 1988) ice cores indicate that ammonium concentrations range from 1 to 3 ng g"1. Although these two studies tend to show a slightly higher mean ammonium content during the ice age with respect to the one in interglacial ice, the ion-chromatography (IC) working conditions employed for these measurements did not guarantee the reliability of a change of 1-2 ngg−1 of ammonium. In Figure 5, we report ammonium data from Vostok that were obtained using new IC working conditions that have been improved. First, all ice samples were melted just before analysis in airtight glass bottles to prevent the acidic meltwater from uptaking ammonia present in the ambient atmosphere of the laboratory. Moreover, these measurements were made using a new (CS12) separator column recently developed by the Dionex Ion Chromatography Corporation, which unlike the previously used columns efficiently separates ammonium and sodium peaks. The overlapping of ammonium and sodium peaks which occurred when using the old cation separator columns was the main cause of uncertainties because of increased sodium content in glacial ice with respect to interglacial ice. From Figure 5 which shows measurements of ammonium in Vostok ice samples, obtained using the CS12 column, we observe that ammonium levels were three times lower in interglacial ice (0.6±0.35ngg−1) than in ice deposited during very cold climatic conditions (2.0 ± 0.5 ng g−1). These data indicate, for the first time, that the ammonium profile of deep ice cores contains a climatic signal. Figure 5 shows that higher ammonium levels observed in glacial ice coincide with high non-sea-salt sulphate (denoted SO4 2- exc) levels. The increase of SO4 2- e xc. levels in Vostok glacial ice is accompanied by an increase of MSA level, suggesting that DMS emissions may have been strengthened during the ice age (Reference Legrand, Feniet-Saigne, Saltzman, Germain, Barkov and PetrovLegrand and others, 1991). The linear regression of NH4 + and SO4 2- exc. yields [NH4 +] = -0.14 + 0.009 [SO4 2- exc] (r2 = 0.60 for 241 samples), indicating a mean NH4 + /(MSA + SO4 2- exc) weight ratio close to 1% in the Vostok ice deposited during both warm and cold climates (Fig. 5). Such ammonium data in the Vostok ice are consistent with a marine biogenic origin of ammonium and indicate that the degree of ammonia neutralisation of sulphur acidic species previously remained very low. If real, these preliminary ammonium levels of old ice deposited over central Antarctica suggest that continental sources do not contribute significantly to the Antarctic ammonium budget.

Fig. 5. Ammonium concentrations of Vostok ice measured by using a CS12 Dionex column (see text) as a function of ST (temperature change with respect to the mean Holocene value depicted by the deuterium profiles from Petit and others, 1999d) and non-sea-salt sulphate contents.
The Sulphur Cycle
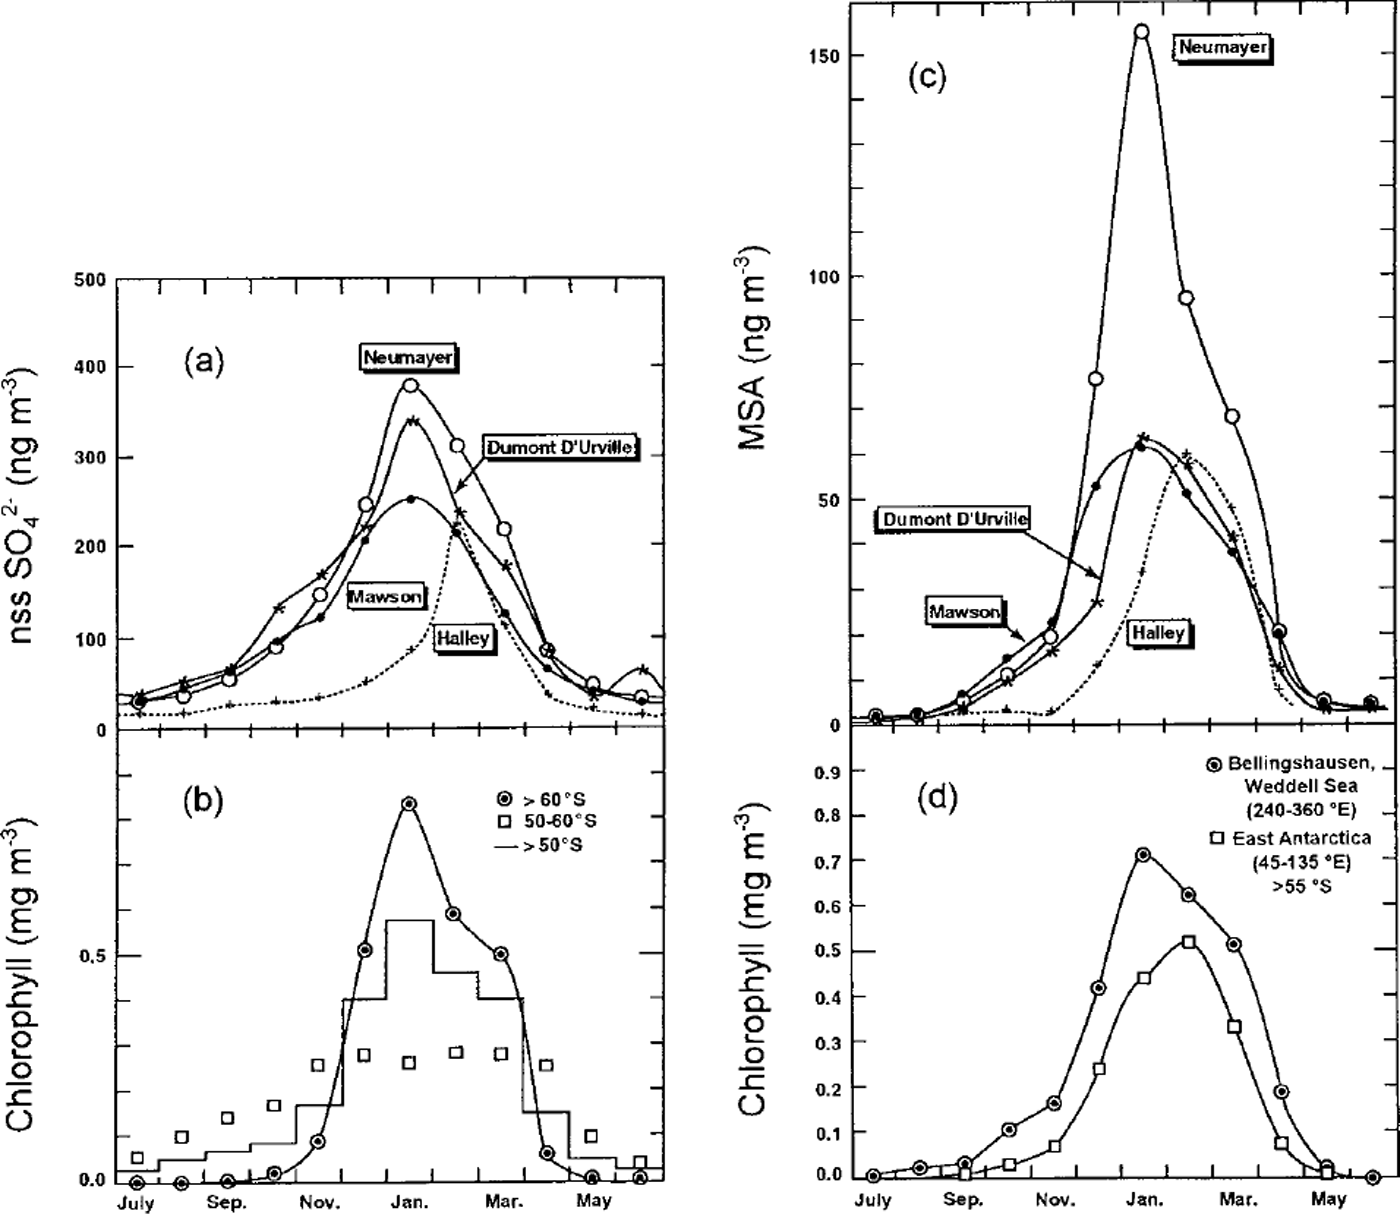
The study of sulphur-containing species (MSA and SO4 2- exc.) in the marine boundary layer of coastal Antarctica achieved in the framework of the CAASC programme has shown well-marked seasonal cycles with maxima in the summer seasons. The seasonal cycle of these two sulphur species at sites facing different oceanic sectors has been compared with the chlorophyll content of the Southern Ocean by Reference MinikinMinikin and others (1998). In September-November, MSA and SO4 2- exc. are similarly enhanced over their low winter (May-August) background levels (Fig. 6). In November-January, SO4 2- exc. concentrations are multiplied by a factor of two, whereas those of MSA are again enhanced by more than a factor of three, a particularly large increase taking place at Neumayer. Comparing these seasonal variations of MSA and SO4 2- exc. atmospheric concentrations with seasonal changes of chlorophyll contents of the surface ocean (see Fig. 6), Reference MinikinMinikin and others (1998) concluded that marine source regions influencing the biogenic sulphur cycle in these regions are primarily located south of 50° S, with an increasing contribution of emissions from regions located south of 60° S in summer. The increase of chlorophyll concentrations south of 55° S is mainly driven by sea-ice-cover changes (Reference MinikinMinikin and others, 1998). The difference in the timing of the summer recovery of MSA and SO42- exc (Fig. 6) indicates that MSA levels are very sensitive to marine emissions taking place south of 60° S, suggesting that the summertime oxidation of DMS emitted in these regions is in favour of MSA. Reference Legrand and PasteurLegrand and Pasteur (1998) discussed the MSA/SO4 2- exc. weight ratio in aerosols from coastal Antarctic sites which appears to be mainly controlled by MSA levels, reaching maxima (20-30%) in mid- to late summer. Factors responsible for high MSA/SO4 2- exc values are not yet understood and may involve parameters such as the air temperature and the relative humidity, in addition to ambient oxidant concentration (Reference Legrand and PasteurLegrand and Pasteur, 1998).

Fig. 6. Monthly mean concentrations of non-sea-salt sulphate(here denoted nssSO42-) at coastal Antarctics site (a), and chlorophyll concentrations in the surface ocean in various latitude belts from 1978-86 satellite observations (b). Monthly mean concentrations of MSA at coastal Antarctic sites ( c), and chlorophyll concentrations in the surface ocean from latitudes higher than 55° S in the Weddell and East Antarctic oceanic sectors (d). Adapted from Reference MinikinMinikin and others (1998).
In the framework of the SC ATE programme, an extended study of the sulphur cycle including aerosol and gas-phase measurements has been carried out in summertime at Palmer station. One major conclusion of these observations is that strong vertical exchanges governed by low-pressure cells circling around the Antarctic coastline strongly influence the chemistry of the boundary layer. First, because of the long photochemical lifetime of DMS in these regions (a few days; Reference JeffersonJefferson and others, 1998) associated with convective activity over the ocean, a large fraction of DMS can be upward-transported above the boundary layer (Reference DavisDavis and others, 1998). There, DMS is slowly oxidised into several sulphur species, and because of the low aerosol-scavenging at this altitude, a reservoir of various sulphur species is built up. Reference JeffersonJefferson and others (1998) suggested that downwelling episodes may bring accumulated gas-phase MSA to the boundary layer where it is rapidly converted into particulate MSA and may contribute to the elevated particulate MSA level observed in the Antarctic boundary layer.
One of the major observations made in deep Antarctic ice cores was an enhancement of SO4 2- exc. and MSA concentrations in glacial ice with respect to interglacial ice at Vostok (Reference Legrand, Feniet-Saigne, Saltzman, Germain, Barkov and PetrovLegrand and others, 1991). The increase of both MSA and SO4 2- exc. during cold climate suggests that DMS emissions may have been enhanced at that time. The cause of the enhanced MSA/S04 2- exc. values in glacial ice remains more complex. Given the complexity of chemical and meteorological factors controlling this ratio value, it is still difficult to provide a convincing explanation for these past variations of MSA/SO42- exc. over the Antarctic Plateau. At this stage, we point out that the larger increase of MSA with respect to that of SO4 2- exc may suggest an increase of DMS emissions at the border of the sea ice in the past. However, such a conclusion remains valid only if we assume that photochemical and meteorological conditions prevailing in the past have not substantially modulated the ratio.
Conclusion
As pointed out by previous studies, the glacial ice at Vostok containing a large amount of dust exhibits more nitrate than the ice deposited during warm climates. Conversely, the ice deposited at Vostok during the ice age and having a moderate dust content contains less nitrate than the interglacial ice. This is consistent with a stratospheric origin of nitrate in the Antarctic atmospheric boundary layer, as recently suggested by studies of nitrate in the present-day atmosphere at coastal Antarctic sites. The Vostok profile confirms the very low ammonium content of Antarctic ice. For the first time, a climatic signal is revealed by an Antarctic ice record with enhanced ammonium concentrations during the ice age. This increase of ammonium concentrations in glacial Antarctic ice is correlated with an enhancement of MSA and sulphate levels, suggesting a marine biogenic origin for ammonia in these high-latitude regions. Recent atmospheric studies of biogenic sulphur species (MSA and sulphate) suggest that marine areas influencing coastal Antarctic regions are at present mainly located south of 50° S, with those located south of 60° S having a major role for MSA levels. Both MSA and sulphate concentrations are enhanced in glacial ice compared to interglacial ice at Vostok. Given our present poor understanding of factors influencing the MSA to non-sea-salt sulphate ratio, it remains difficult to evaluate the respective role of marine emissions taking place at mid- and high latitudes during cold climates.


