


Introduction
Consumers are increasingly concerned about sustainability of meat products they purchase (Midan 2021). However, sustainability is a broad term that encompasses an array of issues including economics, environmental impacts, and social dimensions of livestock and meat production. Although there is no universal definition of sustainability, most definitions emphasize balancing three pillars of sustainability: environmental, social, and economic (USDA 2024). For instance, the U.S. Department of Agriculture (USDA) defined sustainability as the balancing between satisfying human needs; improving environmental quality, resources, and ecosystem services; and improving the standard of living of workers, farmers, ranchers, and society while sustaining the economic viability of farms (USDA 2024).
Sustainability may include impacts of livestock and meat production on human health and welfare; greenhouse gas production; water quality; biodiversity; industry labor; and rural communities (Broom Reference Broom2010, Reference Broom2021). Because of the complexity and multidimensional nature of sustainability of meat products, a challenge facing the livestock and meat industry as well as policy makers is prioritizing sustainability initiatives. Addressing specific sustainability concerns often includes added costs and trade-offs among individual metrics. Production decisions can be complementary across sustainability pillars such as improved animal health management increasing producer profitability while enhancing animal welfare. Alternatively, trade-offs among sustainability pillars can occur such as higher producer profitability without regard to environmental impacts on land or water. More information is needed to understand individual preference rankings for policies and strategies for the industry to produce sustainable meat.
This study addresses current knowledge gaps by ranking respondent preferences for individual components of the three pillars of sustainability. In particular, we measure individual preferences for alternative beef sustainability policies using a best–worst scaling (BWS) approach. Understanding beef sustainability policies residents prefer is important for both producers and policy makers as they strive to address societal preferences in the food system. Caputo and Lusk (Reference Caputo and Lusk2020) suggest that due to consumer concerns and pushback, policymakers may struggle to implement new food policies. Broom (Reference Broom2010) confirms policies and retail firms’ standards of practice for animal production are driven by consumers. For example, consumer pressure has led to the development of animal welfare laws in the United States, the European Union, and several other nations (Broom Reference Broom2010).
While consumer preferences for traditional beef attributes have been studied extensively in the literature using ranking or willingness-to-pay methods, people’s preferences for sustainability policies are often ignored and less frequently studied. This study contributes to the existing beef policy literature by determining individual preferences for beef sustainability policies in the context of alternative policies using the BWS approach.
The issue of sustainability of livestock and beef production is likely to continue to gain importance given the economic significance of beef production and growing global demand for beef as a source of protein. Cattle production is a notable contributor to the U.S. economy and global food security (Rotz et al. Reference Rotz, Asem-Hiablie, Place and Thoma2019). Cattle production is the largest agricultural sector in the U.S., consistently generating the highest overall cash revenues for agricultural commodities (USDA-ERS 2022). According to the U.S. Department of Agriculture – Economic Research Service (USDA-ERS), the beef industry generated $72.9 billion in cash receipts in 2021 and was projected to generate about 17% of cash receipts in the U.S. agricultural sector in 2022 (USDA-ERS 2022). Also, rapidly increasing world population projected by the United Nations (UN) to reach 8.5 billion in 2030 and 9.7 billion in 2050 (United Nations 2022) is forecasted to consume 73% more meat by 2050 (Salvage Reference Salvage2011). As a result, rising beef demand is expected to incentivize increasing cattle production globally in the coming decades (Buckley et al. Reference Buckley, Newton, Gibbs, McConnel and Ehrmann2019).
Corollary, sustainability of beef production is critical for the long-term viability of the industry. Cattle production has been noteworthy in the sustainability dialogue because of its greenhouse gas emissions, land usage and water impacts, and biodiversity concerns (Buckley et al. Reference Buckley, Newton, Gibbs, McConnel and Ehrmann2019; Schmiess and Lusk Reference Schmiess and Lusk2022). And there has been growing pressure on the beef industry to demonstrate sustainable production methods (Gordon Reference Gordon2020; Greenwood Reference Greenwood2021), in addition to well-established expectations to produce affordable, high-quality, safe, healthy, and nutritional beef products (Tonsor et al. Reference Tonsor, Mintert and Schroeder2010). Designing industry strategies and policies that effectively balance sustainability goals and public interests is a challenging task.
Background
Currently, no standard unit of measurement for sustainability prevails because it is multi-dimensional. Sustainability encompasses a broad spectrum of issues ranging from “climate change to corporate social responsibility” (Midan 2021, p. 2), which creates a large debate platform among policymakers, producer associations, and consumer groups. Recent literature has focused on sustainability of industry social systems, environmental preservation, and economic growth for policy decisions (Buckley et al. Reference Buckley, Newton, Gibbs, McConnel and Ehrmann2019; Casagranda et al. Reference Casagranda, Wiśniewska-Paluszak, Paluszak, Mores, Moro, Malafaia, de Azevedo and Zhang2023; Rotz et al. Reference Rotz, Asem-Hiablie, Place and Thoma2019; USRSB 2022). However, the balance of all three pillars (i.e., environment, social, and economic) contributes to overall sustainability of an economy and its economic organizations (Casagranda et al. Reference Casagranda, Wiśniewska-Paluszak, Paluszak, Mores, Moro, Malafaia, de Azevedo and Zhang2023).
Policies in the meat industry are usually influenced by consumer preferences or pressures (Broom Reference Broom, Smulders and Algers2009, Reference Broom2010). For instance, California’s Proposition 12 addressing animal welfare was approved by more than 62% of voters indicating strong public support (Bursey and Thomas Reference Bursey and Thomas2018). Recent examples of policies addressing livestock sustainability have also been noted in the European Union (Broom Reference Broom2010). Sustainability policies often are affected by trade partners as well as domestic consumers. For example, Broom (Reference Broom2010) cites Thailander egg producers raising birds in accordance with U.S. requirements and Brazilian hog producers adhering to UK animal welfare standards.
The Global Roundtable for Sustainable Beef (GRSB) and the United States Roundtable for Sustainable Beef (USRSB) are two organizations proposing policies seeking to improve sustainability efforts of the cattle and beef industry. GRSB and USRSB are multi-stakeholder organizations that include policy makers, farmers, processors, retailers, regulators, and researchers (GRSB 2021; USRSB 2022). Developed to provide guidelines/policies for sustainable beef production, GRSB covers topics including animal welfare, natural resource management, and community involvement. USRSB is a multi-stakeholder program established to advance, support, and communicate sustainability improvements throughout the U.S. beef value chain (USRSB 2022).
The array of industry and policy initiatives to increase sustainability of beef are not free. Achieving stated goals can take additional investment and add costs to existing production methods. Determining how consumers rank various beef sustainability enhancing options and policies is important to prioritize areas for future sustainability investment. Knowing preference rankings of individuals ultimately determines any policy’s efficacy in changing behavior (Caputo and Lusk Reference Caputo and Lusk2020). Through ranking individual preferences for sustainable beef policies and actions, this study provides important data and analysis to inform the debate. While existing studies provide important information about overall consumer food product preferences and values, past research has not specifically focused on ranking beef sustainability policy preferences. This study helps to fill this void.
Methods and procedures
Beef sustainability policies evaluated
Selecting appropriate policies is important in assessing people’s preferences in a best–worst scaling study because alternatives are selected relative to each other. The nine beef sustainability policies that were chosen for this study for each sub-pillar of sustainability are displayed in Table 1. We relied upon academic research (Broom Reference Broom2010, Reference Broom2021; Casagranda et al. Reference Casagranda, Wiśniewska-Paluszak, Paluszak, Mores, Moro, Malafaia, de Azevedo and Zhang2023) and beef industry literature such as Beef Quality Assurance, GRSB, and USRSB (BQA 2023; GRSB 2021; Midan 2021; USRSB 2022) for selecting alternative policies to consider.
Table 1. Beef sustainability policy options evaluated

Policies and strategies were selected to specifically reflect issues related to each of the three pillars of sustainability – environmental, economic, and social shown in Table 1. Three sustainability policies from each pillar were selected, giving a total of nine alternatives.
Survey design: Best–worst scaling
To determine the relative importance assigned to each beef sustainability policy option by U.S. residents, we used a BWS survey design method (Finn and Louviere Reference Finn and Louviere1992; Flynn and Marley Reference Flynn and Marley2007; Marley and Louviere Reference Marley and Louviere2005). The BWS paradigm has been applied to study consumer preferences and rankings across a range of sectors including the food industry (Ajewole et al. Reference Ajewole, Dennis, Schroeder and Bergtold2021; Bazzani et al. Reference Bazzani, Gustavsen, Nayga and Rickertsen2018; Caputo and Lusk Reference Caputo and Lusk2020; Cohen Reference Cohen2009; Erdem et al. Reference Erdem, Rigby and Wossink2012; Lusk and Briggeman Reference Lusk and Briggeman2009; Wolf and Tonsor Reference Wolf and Tonsor2013); health care (Cheung et al. Reference Cheung, Wijnen, Hollin, Janssen, Bridges, Evers and Hiligsmann2016; Flynn et al. Reference Flynn, Louviere, Peters and Coast2008; Howell et al. Reference Howell, Wong, Rose, Tong, Craig and Howard2016; Louviere and Flynn Reference Louviere and Flynn2010); risky decisions (Ajewole et al. Reference Ajewole, Dennis, Schroeder and Bergtold2021; Erdem and Rigby Reference Erdem and Rigby2013); and other issues (Komatsu et al. Reference Komatsu, Pongoliu, Sakakibara and Ohdoko2022). The BWS framework requests respondents to choose the “best” and “worst” options from a choice set that contains a subset of options (Louviere et al. Reference Louviere, Flynn and Marley2015). By offering multiple-choice sets to respondents and altering the subset of alternatives, it is possible to determine an exhaustive ranking of the policies. BWS framework is also able to measure subjective quantities with well-known measurement features that are simple to interpret and apply since it eliminates numerous rating scale issues (Louviere et al. Reference Louviere, Flynn and Marley2015).
The master blocks for sustainable beef policies were designed to capture the main and first-order interaction effects using a Balanced Incomplete Block Design (BIBD) (Louviere et al. Reference Louviere, Flynn and Marley2015). The design resulted in 18 BWS choice sets, with four policy alternatives (options) each. The BIBD is desirable because of its balanced and orthogonal properties (Caputo and Lusk Reference Caputo and Lusk2020; Erdem and Rigby Reference Erdem and Rigby2013; Flynn and Marley Reference Flynn and Marley2014). This design is reliable, correctly captures extreme possibilities, and lessens the burden that numerous questions place on respondents (Ajewole et al. Reference Ajewole, Dennis, Schroeder and Bergtold2021).
The design had 98% block design efficiency, where the full block was subdivided into three sub-blocks, with each sub-block containing six choice sets. Each respondent answered six choice sets depending on the block they were randomly assigned to reduce respondent fatigue. This design allowed each policy option to appear in the choice sets an equal number of times and in equal proportion to all the other sustainability policies. The sequence of the sustainability policy alternatives within each BWS choice set was randomized across respondents to avoid ordering effect biases.
In this study, the conventional labels of “best” and “worst” were changed to “most important” and “least important” to reflect importance rankings of alternatives. Respondents were asked to select one policy as the most important and one as the least important among other policies for each BWS choice set. Preceding the BWS questions was the statement: “Thinking about the sustainability of beef you buy, which attribute below is most important and which is least important to you? (Please select the most and least important to you from the lists on the following pages)”.Footnote 1 Figure 1 presents an example of one of the BWS choice sets.

Figure 1. Example of BWS choice set used in the survey.
Empirical approach
The relative importance of beef sustainability policies to respondents is analyzed based on random utility theory (McFadden Reference McFadden and Zarembka1974). In the BWS case, respondents chose a pair of items one as best and one as worst from three or more items in each choice set that maximize the difference between the two items (Caputo and Lusk Reference Caputo and Lusk2020; Finn and Louviere Reference Finn and Louviere1992; Lusk and Briggeman Reference Lusk and Briggeman2009). Assume we have J items in each choice set, i.e., four beef sustainability policies in this study, then we have J × (J − 1) possible BW pairs a respondent could choose (12 in this case).
By the random utility theory, an individual’s relative preference for one item over another item depends on how frequently the item is chosen over the other. Following Caputo and Lusk (Reference Caputo and Lusk2020) the indirect utility, U, an individual $i$
derives from the chosen BW pairs in each BWS choice set
$i$
derives from the chosen BW pairs in each BWS choice set $n$
is the difference between the utility of selecting the
$n$
is the difference between the utility of selecting the $k$
best and
$k$
best and $w$
worst policies including the error term, which can be denoted as:
$w$
worst policies including the error term, which can be denoted as:
 $${{U_{ikn}} = {V_{kw}} + {\varepsilon _{ikn}}}$$
where ${V_{kw}} = {\beta _{kn}} - {\beta _{wn}}$
, where
${V_{kw}} = {\beta _{kn}} - {\beta _{wn}}$
, where $\beta $
is a vector of estimated importance parameters for the best
$\beta $
is a vector of estimated importance parameters for the best $k$
and worst
$k$
and worst $w$
policies, respectively, in relation to a policy that is identified by normalizing its parameter to zero and
$w$
policies, respectively, in relation to a policy that is identified by normalizing its parameter to zero and ${\varepsilon _{ikn}}$
is the stochastic component of the expected utility for individual
${\varepsilon _{ikn}}$
is the stochastic component of the expected utility for individual $i$
. The likelihood individuals choose item
$i$
. The likelihood individuals choose item $k$
as best and
$k$
as best and $w$
as worst, from a BWS choice set
$w$
as worst, from a BWS choice set $n$
of J items is the probability that the utility differences between the chosen items (
$n$
of J items is the probability that the utility differences between the chosen items ( ${U_{ikn}}$
and
${U_{ikn}}$
and ${U_{iwn}}$
) is higher than all other J × (J − 1) − 1 possible differences in that choice set (Caputo and Lusk Reference Caputo and Lusk2020; Lusk and Briggeman Reference Lusk and Briggeman2009).
${U_{iwn}}$
) is higher than all other J × (J − 1) − 1 possible differences in that choice set (Caputo and Lusk Reference Caputo and Lusk2020; Lusk and Briggeman Reference Lusk and Briggeman2009).
Alternative econometric models can be estimated from the utility function depending on assumptions made regarding the error term. We assumed each element of the random term ${\varepsilon _{ikn}} = \left( {{\varepsilon _{ikn}}, \cdots {\varepsilon _{iKN}}} \right)$
is iid type-I extreme value suggesting using the random parameters (or mixed) logit (MXL) model for panel data, where observations are repeated for the same individual, with the expectation of heterogeneity in respondent preferences.
${\varepsilon _{ikn}} = \left( {{\varepsilon _{ikn}}, \cdots {\varepsilon _{iKN}}} \right)$
is iid type-I extreme value suggesting using the random parameters (or mixed) logit (MXL) model for panel data, where observations are repeated for the same individual, with the expectation of heterogeneity in respondent preferences.
In analyzing beef sustainability policy preferences, it is important to consider methods that account for heterogeneity among individuals (Train Reference Train2002). The MXL model considers population heterogeneity which may be associated with individual demographics leading to varying preferences. The MXL model considers individual heterogeneity by allowing preference parameters to vary randomly across respondents (Boxall and Adamowicz Reference Boxall and Adamowicz2002). The probability that an individual $i$
chooses
$i$
chooses $k$
as “best” and
$k$
as “best” and $w$
as “worst” in the sequence of the BW choices n = (1, 2, …, N) is the product of logit probabilities evaluated at
$w$
as “worst” in the sequence of the BW choices n = (1, 2, …, N) is the product of logit probabilities evaluated at $\beta $
:
$\beta $
:
 $${{L_{ij}}\left( {{\beta _{ij}}} \right) = \mathop \prod \limits_{n = 1}^N {{{e^{\left( {{\beta _{ik,n}} - {\beta _{iw,n}}} \right)}}} \over {\mathop \sum \nolimits_{m = 1}^J \mathop \sum \nolimits_{l = 1}^J {e^{({\beta _{im,n}} - {\beta _{il,n) - J}}}}}}}$$
The unconditional probability is obtained by taking the integral of ${L_{ij}}\left( {{\beta _{ij}}} \right)$
over all
${L_{ij}}\left( {{\beta _{ij}}} \right)$
over all ${\beta _i}$
.
${\beta _i}$
.
 $${{P_{ij}} = {L_{ij}}\left( {{\beta _i}} \right)f\left( {{\beta _i}} \right)d{\beta _i}}$$
where $f\left( {{\beta _i}} \right)$
denote the density function of the parameters
$f\left( {{\beta _i}} \right)$
denote the density function of the parameters ${\beta _i}$
. We estimate the MXL model using simulated maximum likelihood with 1,000 Halton draws. The results across repeated draws are averaged.
${\beta _i}$
. We estimate the MXL model using simulated maximum likelihood with 1,000 Halton draws. The results across repeated draws are averaged.
Given that the vector of the predicted parameters from the MXL model can take any sign, they are zero-centered (Caputo and Lusk Reference Caputo and Lusk2020; Train Reference Train2002). Hence, we estimated the share of preference (SP) for each beef sustainability policy j, following Lusk and Briggeman (Reference Lusk and Briggeman2009), Caputo and Lusk (Reference Caputo and Lusk2020), and Ajewole et al. (Reference Ajewole, Dennis, Schroeder and Bergtold2021). By doing so, we avoid potential confounding effects between the estimated parameters and scale-related issues in the MXL model and provide a clear explanation of the relative importance of the calculated parameters (Train Reference Train2002). The SP for policy j = 1,…,J is estimated as:
 $${S{P_j} = {{{e^{{{\hat \beta }_j}}}} \over {\mathop \sum \nolimits_{k = 1}^J {e^{{{\hat \beta }_k}}}}}}$$
where ${\hat \beta _j}$
are the estimated parameters for policy j from equation (3). The SP is a ratio scale that indicates the relative importance a respondent gives to one policy over another when comparing alternative options. All SPs sum to 1 or 100% across all policy alternatives. The SP of each policy outcome can be compared within (J = 9) sustainability policies.
${\hat \beta _j}$
are the estimated parameters for policy j from equation (3). The SP is a ratio scale that indicates the relative importance a respondent gives to one policy over another when comparing alternative options. All SPs sum to 1 or 100% across all policy alternatives. The SP of each policy outcome can be compared within (J = 9) sustainability policies.
Furthermore, we determine how individual demographics and socioeconomics are associated with preference shares. We estimate individual-specific posterior estimates conditioned on each individual’s choices made, using the MXL model estimated population parameters as priors and each respondent’s choices. The share of preferences of each individual for each policy was calculated using the posterior estimates and their relationships with other socioeconomic and demographic characteristics. We achieved this by utilizing a fractional multinomial logit (FML) model, which enables us to simulate multiple shares of each individual’s policy preferences. See Papke and Wooldridge (Reference Papke and Wooldridge1996) and Caputo and Lusk (Reference Caputo and Lusk2020) for FML model details.
Sampling and data
The data were collected through a nationally representative survey conducted in March 2023 of U.S. residents.Footnote 2 The survey was conducted through an online poll managed by dynata™. The survey was entered by 3,783 possible respondents of which 416 answered they did not consume meat and were thus taken out of the survey. Of 3,367 respondents who finished the survey, 366 appeared to rush through the survey or provided incomplete answers based on an attention test question included in the survey.Footnote 3 Inattentive respondents were excluded from our analysis, leaving 3,001 usable responses. Survey participants were required to be at least 18 years old and residing in the U.S. The sample demographics closely aligned with 2022 U.S. Census demographic data.Footnote 4
Summary statistics and variable definitions are presented in Table 2. About 52% of the respondents were female similar to the 2022 U.S. Census of 50.9% female persons. About 39% of respondents were in the most prevalent age range of 30–49 years old, and close to half had completed college. About 39% of the sample annual household income group was $25,000–$74,999 (U.S. Census median household income in 2022 dollars was $75,149), with 45% above and 16% below this category. Also, 65% of the sample indicated not having children under the age of 18 years living at home. The most prevalent political party affiliation was Democrat, represented by 38% of respondents, followed by 34% who belonged to a party other than Democrat or Republican.
Table 2. Independent variable definitions and summary statistics, 3,001 respondents

a Census data includes only those 18 years and above.
b Source: U.S. Political Affiliation: https://ballotpedia.org/Partisan_affiliations_of_registered_voters
Every state in the U.S. has at least one respondent. Respondents were grouped into four geographic regionsFootnote 5 with the South representing 35%, followed by the Northeast, West, and Midwest ranging from about 24% to 18%, respectively. About 73% were white, 13% represented Black or African Americans (both similar to the 2022 U.S. Census), 5% were Asian or Pacific Islanders, and other and multiraced individuals represented 9%. We compared proportions for some of the demographics that can be benchmarked (e.g., age, gender, income, etc.) to the 2022 U.S. Census Bureau American Communities Survey data (5-year estimates) (US Census Bureau 2022), reported in Table 2.
Using the respondents’ reported frequency of beef intake, we divided what we refer to as “low beef eaters” from “high beef eaters”. About 55% of respondents were low beef eaters, who ate two or fewer meals per week that included beef, whereas high beef eaters ate three or more meals per week that included beef. We asked respondents to rate their level of acquaintance with farming. About 22% of the sample said they were very familiar, and 47% said they were moderately familiar with farming.
Results and discussion
Table 3 presents parameter estimates of respondent preferences for beef sustainability policy importance from the MXL model. The importance of eight policy alternatives were evaluated relative to affordability of beef,Footnote 6 which was normalized to zero for estimation purposes. Results are presented in descending order of relative importance for each policy.
Table 3. Mixed logit model parameter estimates

Notes: Standard errors in parentheses.
*** indicates the mean importance of the policy is statistically different from affordability of beef policy at the 1% significance level (p < 0.01).
The standard deviation parameters (Table 2) were all statistically significant (0.01 level), indicating heterogeneity among consumer preferences for beef industry sustainability policies. A larger standard deviation suggests greater heterogeneity, implying respondents exhibit greater variation in their preferences to the policy. For instance, greenhouse gas emissions of cattle production have the highest variation (1.41) among the alternatives relative to the reference category affordability of beef, suggesting that individuals differ more in their preference for greenhouse gas emissions of cattle production policy than any other policy. In contrast, individuals differ less in preference rankings of cattle and beef production impact on water quality and cleanliness policy relative to the other policies with a standard deviation of 0.55, only about 40% that of greenhouse gas emission variation.
Share of preferences and correlations of policies
Figure 2 presents shares of preferences for the various policies estimated using MXL modeling. All shares were statistically different from zero at the 0.01 level. Affordability of beef had the largest share of preference at 16%. This indicates consumers are more concerned about the cost of beef they purchase relative to other sustainability concerns. The importance of beef affordability to respondents indicates any sustainability policy that increases (reduces) cattle or beef cost of production will directly reduce (increase) utility to the most consumers of any of the sustainability options presented. However, another noteworthy result is that five other alternatives have preference shares of 10%-14% indicating several options have relatively similar preference strength.

Figure 2. Share of preferences for beef sustainability policies.
Notes: Standard errors are the bars in red. All share of preference values are statistically significantly different from zero at the 1% significance level.
The second-ranked preference of animal welfare at 14% share is slightly less than the top concern of affordability. Animal welfare and care standards the industry maintains are important to citizens and policies advocating animal welfare efforts are likely to have consumer support consistent with recent voting results of California’s Proposition 12. The USRSB (2022) defines animal welfare as the cumulative effects of cattle health, nutrition, care, and comfort as outlined by GRSB, USRSB, USDA (USRSB 2022), and BQA (BQA 2023). Midan (2021) found similar results where most meat consumers were more concerned with animal welfare standards than environmental footprint of meat production. Also, this result is in line with findings that an important aspect of sustainability is animal welfare (Broom Reference Broom2021).
Cattle and beef production impact on water quality and cleanliness has the third highest share of preference just slightly below animal welfare at 13% of respondents considering it most important. This policy aims to reduce adverse impacts of cattle and beef production on water quality and cleanliness. Relatedly, about 11% (sixth-ranked) of respondents most preferred cattle and beef producer conservation of water and land. Nitrates, bacteria, organic debris, and suspended particles are among substances that typically pollute water sources near cattle farms, which can cause odor, change in water color, and/or taste (Pfost et al. Reference Pfost, Fulhage and Casteel2001). Given the relatively high level of importance citizens place on water quality, the beef industry is advised to prioritize this issue in managing and promoting sustainability initiatives. These findings confirm increasing concerns of beef production and associated activity impacts on water (Broom Reference Broom2021).
Beef production that supports local communities where cattle farms are located was considered the fourth-most important policy with approximately 11% of respondents ranking it most important. Ranking with preference shares ranging from 9% to 11% were USDA sustainability certification of beef retail product packaging; cattle and beef producer conservation of water and land; wage levels and working conditions for beef industry workers; and economic viability of small cattle farming operations. Greenhouse gas emissions of cattle production had the lowest share of preference by a sizable amount, with only 6% of people indicating greenhouse emissions of cattle production were most important. The fact greenhouse gas emissions in beef production are a low ranked policy preference is consistent with consumer beef attribute desirability rankings from prior work where low-carbon beef ranked lowest among alternatives (Schroeder et al. Reference Schroeder, Osman, Lancaster and White2023). Kilders and Caputo (Reference Kilders and Caputo2023) also found low-carbon beef had a small market share (about 3–5%) relative to other beef alternatives. Policy preferences and consumer food attribute preferences are not always consistent (Paul et al. Reference Paul, Lusk, Norwood and Tonsor2019). However, greenhouse gas emissions in cattle and beef production policy and product preferences are consistent providing strong evidence of a low level of broad consumer concern with this issue.
The share of preferences enables comparing relative strengths of results. For example, the affordability of beef is nearly three times as important as greenhouse gas emissions of cattle production (15.8%/5.8% = 2.7). Although all the policies were considered important by some segments of respondents, comparing each category (environmental, economic, and social) of sustainability gives further insight into preference rankings.
We compared the pillars of sustainability evaluated, presented in Appendix Figure A1. Economic policies have the largest share of preference (about 36% respondents) while the least preferred policies were environmental sustainability policies (about 29%). This confirms Tonsor (Reference Tonsor2023) monthly beef demand monitor results, where environmental policies are ranked low relative to social and economic issues. This shows preferences for general policies, but they differ from preferences for specific attributes. For instance, even though overall environmental policies ranked lowest, cattle and beef production impact on water quality and cleanliness, an environmental policy, was ranked third most important. The composition of each pillar can be found in Table 1.
For environmental policies, cattle and beef production impact on water quality and cleanliness was valued as the most important policy among the environmental sustainability policies (13% share), at about twice as important as greenhouse gas emissions of cattle production (6% share), which was valued as the least important policy. This is not surprising considering the low concern of greenhouse gas emissions attributes to consumers compared to other beef attributes or policies in the literature (Kilders and Caputo Reference Kilders and Caputo2023; Schroeder et al. Reference Schroeder, Osman, Lancaster and White2023; Tonsor Reference Tonsor2023).
Affordability of beef was the most important among the economic policies (16% share), about twice as important as the other two economic policies. Economic viability of small cattle farming operations was the least preferred policy in the economic pillar. Affordability here can also be considered as the price of beef products. This result indicates that consumers place more importance on the price of beef products they would purchase over other economic aspects of beef sustainability. For instance, older people and high-income consumers were more likely to support policies that would make beef production support local communities relative to affordability.
For social policies, animal welfare treatment of cattle was the most important (14% share), at one-and-half times more important as other social policies. Wage level and working conditions was the least preferred in this pillar (9% share). Animal welfare issues have been considered as one of the most important beef quality consumers consider in their purchasing decisions especially both in the U.S. and the European Union (Broom Reference Broom2010). Therefore, it is not surprising that this policy is preferred to other social sustainability issues. Social policies were more closely ranked relative to each other than individual economic and environmental sustainability policies.
Using the individual-specific estimates from the MXL model, we estimated correlations between respondents’ choices of beef sustainability policies, presented in Appendix Table A2. Every value estimate indicates a unique construct because all correlations across estimates are less than 0.5 consistent with the findings of Lusk and Briggeman (Reference Lusk and Briggeman2009) across food values in general. Small positive correlations (all less than 0.16) are present between greenhouse gas emissions, cattle and beef production impact on water quality and cleanliness, and conservation of water and land. This indicates environmental concerns tend to be associated with each other in respondent preferences.
Determinants of sustainability policy preferences by demographics (marginal effects)
The average partial effects (marginal effects) of the explanatory variables on the share of preferences were calculated using the estimated FML model, which was estimated to obtain determinants of sustainability policy preferences. Since all the demographics and socioeconomic variables are binary, marginal effects are the difference of the index function when the independent variable is equal to one or equal to zero. Figures 3, 4, 5 and 6 present marginal effects of each of the eight sustainability policies excluding the reference category. Every alternative policy has at least three statistically significant (0.05 level) demographic factors associated with a preference share. Thus, diverse preferences for beef sustainability attributes are moderately related to demographic characteristics.

Figure 3. Marginal effects from the multinomial fractional logit model for animal welfare and wage levels and working conditions policies.

Figure 4. Marginal effects from the multinomial fractional logit model for greenhouse gas emissions and USDA sustainability certification policies.

Figure 5. Marginal effects from the multinomial fractional logit model for economic viability and support local communities policies.

Figure 6. Marginal effects from the multinomial fractional logit model for conservation of water and land and water quality and cleanliness policies.
In each chart, when the confidence interval does not cross the red line, the marginal effect is statistically significantly different from zero (0.05 level). However, if the confidence interval crosses the red zero line, it means the marginal effect is not statistically significant. For instance, in Figure 3, high beef eater is not statistically significant while male is statistically significant for animal welfare.
For animal welfare of cattle (Figure 3), people between the ages of 30–49 and 50–65, Asian or Pacific Islander, and other races are more likely to have higher share of preferences for this policy relative to the baseline. Preference shares decrease for males, people with income between $25,000 and $150,000, those familiar with farming, and Republicans. For instance, males, income levels between $75,000 and $150,000, familiar with farming, and Republican share of preference for animal welfare policy decreases by approximately 3, 2, 2, and 2 percentage points, respectively, while respondents between the age of 30–49, 50–65, Asian, and other races are more likely to increase the share of preference for this policy by about 2 percentage points each relative to their respective baseline.
The shares of preference for wage levels and working conditions for beef industry workers policy increases for male respondents by only about 0.005, while unlikely to be supported by people between the ages of 30–65 vs the base (Figure 3). Shares of preferences regarding greenhouse gas emissions of cattle production (Figure 4) are lower for those who consume beef three or more times per week, are 30 and older, have annual income greater than $150,000, and are Republicans or other political parties besides Democrats. College graduates and those residing in the Midwest and Western states are more likely to support this policy. The strongest influence on preference share is associated with individuals who identify as Republicans, with about 3.5 percentage point decrease compared to the baseline. These findings are consistent with Caputo and Lusk (Reference Caputo and Lusk2020) in the general food space.
Preferences for economic viability of small cattle farming operations (Figure 5) are higher for males, those with an annual income higher than $75,000, those familiar with farming, and Republican and other political parties besides Democrat. However, respondents who reside in the Western U.S. and Black or African Americans have reduced preferences for the economic viability of small cattle farming operations.
Beef sold supporting local communities where cattle farms are located has several statistically significant demographic factors as determinants of its share of preferences (Figure 5). Factors increasing respondent preferences are high beef consumers, people who are 65 years of age and above, annual income above $24,999, having a child under 18 years of age, familiarity with farming, Republicans, and other political party besides Democrat. College graduates, Western residents, and Black or African Americans have a lower share of preferences for such policy relative to their respective baselines.
While the general share of preferences for cattle and beef production impact on water quality and cleanliness is about 2.4 percentage points higher than cattle and beef producer conservation of water and land, they have nearly the same demographic determinants associated with shares of preferences (Figure 6). Republicans and males are more likely to support water and land conservation, and water quality and cleanliness policies. Conversely, respondents who are 30 years and older have lower shares of preference for both cattle and beef producer conservation of water and land and cattle and beef production impact on water quality and cleanliness policies. However, respondents who reside in the Western U.S. are more likely to strongly support water and land conservation policy, and those who live in the Northeast are less likely to support water and land conservation policy.
Finally, the response of demographic preferences to USDA sustainability certification on beef retail product packaging reveals both younger (age 30–49) and older (age 50 and above) support this policy (Figure 4). On the other hand, respondents who are familiar with farming, belong to other political parties besides Republican and Democrat, and are Asian or Pacific Islanders are less likely to support USDA sustainability certification on beef retail product packaging.
Policy implications
This study provides several implications for beef sustainability policy. Affordability of beef products is the most important sustainability factor to the greatest share of respondents. As such, we advise maintaining affordability of beef be a persistent focus of any industry and policy sustainability decision making. Implementing any sustainability policy initiative without considering its impact on the cost of beef production and thus beef price, is ill-advised because any policy that adds costs harms consumers. This important cost–benefit trade-off should be assessed in any sustainability initiative. This also suggests investing resources developing production technologies that increase industry efficiency and cost competitiveness benefit the most consumers. Even more, new technologies that improve animal welfare and enhance environmental impacts of beef production, especially on water quality, that also reduce cost of beef production synergistically increase consumer preferences.
Animal welfare is a highly ranked concern. Consumers will largely endorse policies directed toward enhancing and ensuring animal welfare. Policy regarding animal welfare focused on advancing animal health technologies for example that reduce animal stress; improve animal health and well-being; and thus, increase production efficiency may also increase beef affordability and complementarily benefit consumers. Animal welfare policy that alternatively increases costs of production without an offsetting gain in production efficiency creates a trade-off for consumers. Such a policy may be preferred by those who are of utmost concerned about animal welfare, but if such a policy is compulsory and costly to adopt, it will increase beef prices for everyone harming consumers, especially those for which affordability of beef is the priority. Alternatively, policy facilitating voluntary animal welfare assurances could benefit both producers and consumers through segmented and differentiated premium-priced welfare-enhanced product offerings.
Greenhouse gas emissions in cattle and beef production have received considerable attention in recent years in both corporate food company board rooms and policy venues. Deciphering the reasons for this is beyond the scope of this paper. However, our results indicate greenhouse gas emissions are not a priority for many U.S. residents. Of the nine sustainability policy options, greenhouse gas emissions of cattle and beef production ranked notably lower than others with only a 6% top preference share. Industry and policy efforts directed at monitoring and managing greenhouse gas emissions without other complementary benefits are low priority. That said, as technology to reduce greenhouse gas emissions continues to be explored, technology that could enhance production efficiency and lower production costs while reducing greenhouse gas emissions would be much more efficacious with consumers than greenhouse gas reducing technology and/or regulations that increase costs of production.
A final important result is respondent preferences for beef sustainability policies are heterogenous which presents both opportunities and challenges for the industry. The degree of respondent choice variation is evidenced by the fact that no one policy was favored as most important by a sizeable majority. With eight different policy options having roughly 10–16% preference shares, divergence of opinions on priority rankings is prevalent. This suggests sustainability policies might be most successful if they are considered together in bundles. A combination of policies that strive to complement preferences rather than compete or offset each other is going to match more preferences than single-focused initiatives.
Conclusions
Sustainable beef production has received notable attention in recent years from policy makers, food companies, consumer groups, producers, and researchers. With an intermix of social, economic, and environmental pillars, particular aspects of sustainable production can be complementary or conflicting with each other. Furthermore, private and societal values of various sustainability initiatives may widely differ, motivating potential policy intervention. However, efficacious public policy, especially in the presence of at times conflicting impacts across sustainable metrics, must be made with trade-offs in mind. Understanding how consumers rank various beef sustainability policy options and carefully assessing trade-offs is essential for informing policy debates.
Using survey data from 3,001 U.S. residents, this study assessed U.S. consumer preferences for beef sustainability policies. Our assessment used BWS, which compels respondents to make trade-offs among policy options presented to obtain ranked importance among alternative choices. Consumers strongly prefer policies that do not increase retail prices as beef affordability is the highest-ranked sustainability issue. This is important for policy makers to understand as many consumers will not embrace sustainability policies that result in increased production costs leading to higher beef prices. This is also important for downstream beef processors, retailers, and food service establishments to recognize. If costly sustainability initiatives of cattle producers are driven by downstream firms these downstream companies will ultimately see reduced consumer demand for these more expensive products.
Concerns about greenhouse gas emissions associated with beef production have elevated recently. Policy efforts to measure, monitor, and manage greenhouse gas emissions of cattle and beef production are prominent. However, U.S. consumers rank greenhouse gas emissions in cattle production as lowest in importance by a sizeable margin of nine sustainability policy concerns explored. Other policy priorities matter more to most consumers even within the environmental pillar such as water quality. This suggests downstream beef processing and marketing firms demonstrating corporate responsibility might be well served to focus more on water quality concerns in beef production than greenhouse gas emissions.
Overall, this study helps policy makers recognize trade-offs as they strive to design policy aligning with individual preferences while advancing sustainable beef production. Future research assessing how the cattle and beef industry can further enhance sustainability, addressing concerns most important to consumers and keeping in mind that beef affordability is a priority, is warranted.
Data availability statement
The codes and data that support the findings will be available upon the acceptance of this paper by the editor(s).
Acknowledgements
We acknowledge partial funding support for this study from the Kansas Beef Council. The findings presented are solely those of the authors and do not necessarily represent those of the Kansas Beef Council.
Funding statement
This research was supported partially by the Kansas Beef Council (Grant Number 008598 – BH1215 KBC).
Competing interests
None.
Appendix A
Table A1. Multinomial logit (MNL) model parameter estimates and share of preferences

Notes: Standard errors in parentheses, *** indicates the mean importance of the policy is statistically different from affordability of beef policy at the 1% significance level (p < 0.01).
Table A2. Pearson (pairwise) correlations between beef sustainability policies from individual specific MXL estimates

Note: *** and ** indicate the estimate is statistically significant at the 0.01 and 0.05 significance level, respectively.
Table A3. Fractional multinomial logit model parameter estimates

Note: Numbers in parentheses are robust standard errors. ***, **, and * indicate the marginal effect value is statistically significant at 1% (p < 0.01), 5% (p < 0.05), and 10% (p < 0.1) levels, respectively.
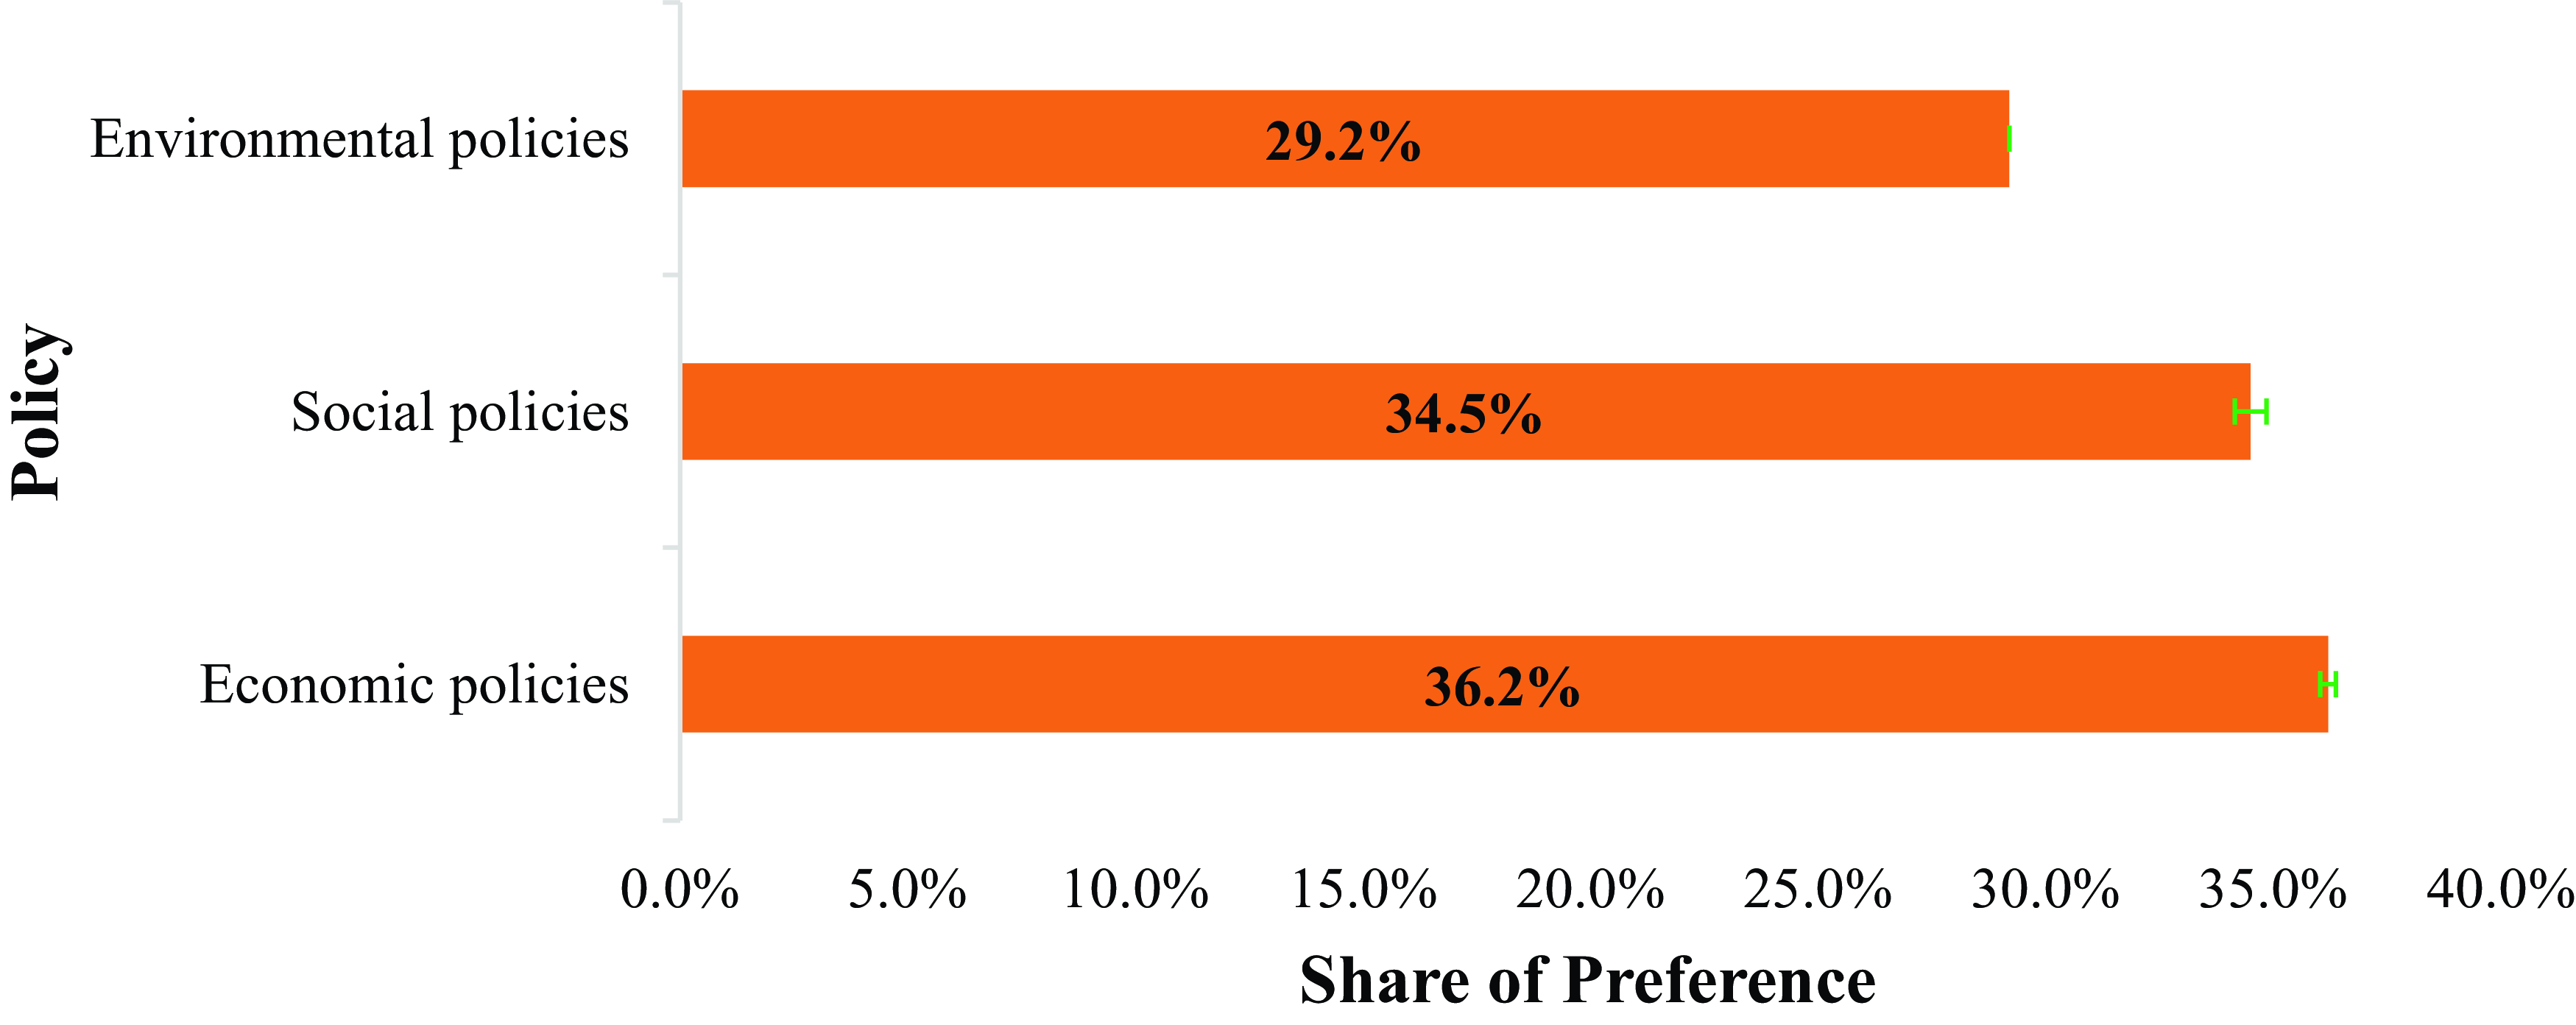
Figure A1. Share of preferences for each pillar of sustainability policies.


 Open access