1. Introduction
The warming of the troposphere due to increases in greenhouse-gas concentrations is expected to be associated with cooling in the stratosphere and mesosphere (see. e.g., Port-man and others, 1995). The tenuous nature of illese atmospheric regions leads to predictions of enhanced variations associated with anthropogenic change, and the possibility that “climate change” may be easier to detect. The polar mesopause is the coldest region of the Earth's atmosphere and is of particular interest. It is located between the radia-tively heated regions of the stratopause (ozone absorption of solar ultraviolet radiation) and the lower thermosphere (absorption of solar extreme ultraviolet radiation). The mesopause is a region whose seasonal temperature balance is dominated by dynamical processes. It is coolest in the summer, and in the polar regions.
For a doubled CO2 atmosphere, the upper mesosphere is predicted to cool by 6-12 K, although competing dynamical and radiative processes make such predictions difficult and seasonally dependent (Reference Rind, Suozzo, Balachandran and PratherRind and others, 1990; Reference Portman, Thomas, Solomon and GarciaPortman and others, 1995). Increased observations of polar mesospheric clouds, ice clouds that form in the polar mesopause region near 85 km, have been interpreted as a signal of anthropogenic change (Reference ThomasThomas, 1996). The polar mesopause region is the highest altitude at which clouds form. While polar mesospheric clouds are radiatively thin, they provide surfaces for heterogeneous chemical reactions that are important at lower altitudes in the ozone-hole development.
An analysis of 16 years of mid-latitude, middle atmosphere temperatures determined using a lidar technique (Keckut and others, 1995) found statistically significant cooling, at a rate of 0.4 Κ a−1 at 65 km, near the highest altitude reliably monitored. A cooling rate of such magnitude is in excess of current model predictions. This result offers the possibility that cooling may be easier to detect at still higher altitudes. Contrary to this, Lübken and others (1996) reported measurements of the temperature of the Arctic mesopause region, and indicated that at an altitude of 82 km the temperature has remained constant to within 2 Κ over a 30 year interval, during mesospheric cloud events.
The hydroxyl (OH) airglow layer near 87 km provides the lowest altitude at which passive, spectroscopic techniques can be used to monitor the temperature of the atmosphere. The Antarctic mesopause region is of additional interest because of its location above the ozone hole. Mesospheric temperature variations may occur as the dynamics of the region alters in association with the expected recovery of ozone over the next 50 years.
Our initial attempts to derive temperatures with sufficient accuracy for climate-change studies have focused on spectra of the OH (6-2) band recorded in 1990 (Greet and others, 1998). Efforts to define the accuracy of the measurements have received particular emphasis, because associated with a predicted enhanced anthrogenic response in this atmospheric region is enhanced variability. Based on the techniques and error analysis derived from the 1990 OH (6-2) spectra, in this paper we report and compare the 1990 results with temperatures derived from spectra recorded in 1995 and 1996.
2. Instrumentation and Data
Hydroxyl airglow emissions are used extensively for studies of the upper mesosphere. The hydroxyl emission has a number of bands, and by comparing the intensity of two or more lines from different upper states within the same band, the rotational temperature of the molecule can be determined. By assuming the OH molecules are in thermal equilibrium with the atmosphere, this rotational temperature can be interpreted as the kinetic atmospheric temperature of the emission region.
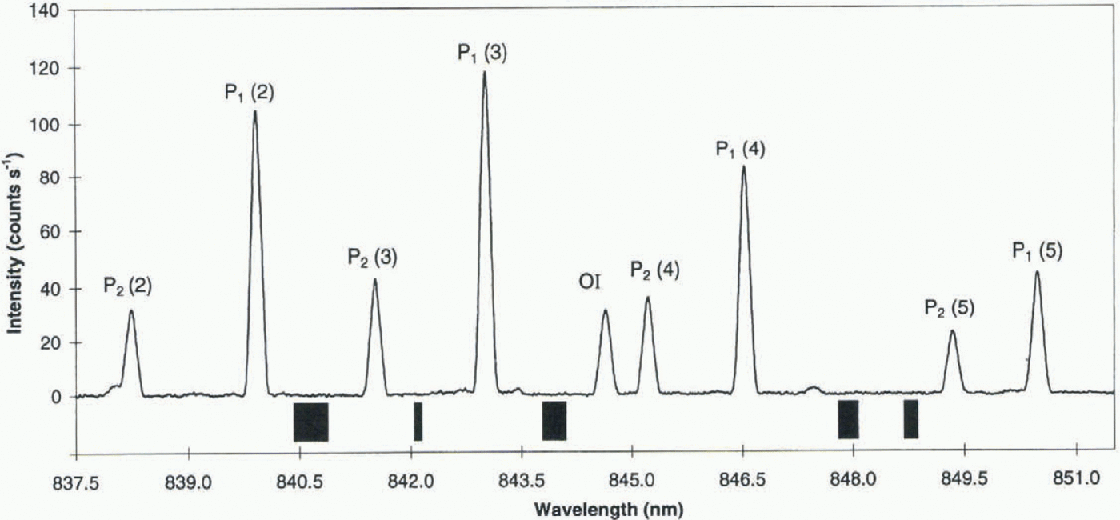
The OH (6-2) band spectra used in this analysis were collected with a Czerny-Turner spectrometer (CZT) operating with a 6° field-of-vicw at Davis, Antarctica, Figure 1 shows an averaged spectrum of the OH (6-2) band region with the major features marked. Temperatures are derived from the P1(2), P1 (4) and P1 (5) intensities. The P,(3) line is not utilised in the temperature analysis, because of the blending with this line of an unthermalised OH (5-1) component (Greet and others, 1998).
In 1990 the optical axis of the CZT was elevated 30° above the southeastern horizon (azimuth 130° E), away from the most aurorally active region of the sky. This reduced auroral contamination of the OH airglow emissions and enhanced the measured signal (looking off-vertically, monitors a broader emitting region). in 1995 and 1996 the instrument observed in the zenith in common with other instrumentation. The principal emitting region monitored in 1990 is 69.4° S, 80.9° E.
A relatively narrow instrument bandwidth of 0.15 nm was used in all years. A cooled GaAs photomulliplier tube was used for photon detection. Τhe CZT was operated in 1990 without an appropriate higher-order blocking filter. This resulted in allowance being necessary to remove additional auroral contamination of the major features by second-order N2 + 1NG band emissions. This was not a problem for the 1995 and 1996 spectra, which were, however, recorded from a more aurorally active region of the Davis sky.
An instrument spectral response has been determined for each year. The variability in the calibration scans across the year is used to determine an instrument-calibration uncertainty associated with each year's data. The quartz halogen lamp associated with the 1990 and 1995 calibrations, was itself calibrated only in 1996. We make the assumption that this lamp has maintained its spectral response over the years. The quartz-halogen lamp has been operated below its rating, only in association with the CZT, and on a limited number of occasions: only nine scans in 1990, and fewer in its two other years of operation prior to calibration. The quartz-halogen-lamp-determined instrument responses over the years 1990, 1995 and 1996 are consistent to within 2% over the observed wavelength range. This amounts to an equivalent temperature variation due to the varying instrument response of approximately 2 K. Over the time interval 1990-96, individual components (grating, photomulliplier and pre-filters) have changed, but not the type of the principal components that exhibit spectral variability across this wavelength region (the grating and photomultiplier). We are now monitoring the spectral response of this quartz-halogen lamp in order to quantify the assumption of spectral consistency-Spectra are generally accumulations of five sequential wavelength scans. in 1990 the wavelength range covered was from λ837.5-λ856.0 nm, and each spectrum took about 1 hour to acquire. in 1995 and 1996 the scans were terminated at λ851.5 nm, and the time to acquire the spectra was reduced to 40 min.
Greet and others (1998) select as a reference set of spectra from the 1990 data those that were collected during the best observing conditions (Sun >18° below horizon, no moon, no cloud, low level of auroral activity). An expanded dataset was then chosen using selection criteria near the upper limit of the range of values in the reference dataset. The average temperatures for the reference and expanded datasets were consistent within 1K (Greet and others, 1998). The selection criteria for the expanded dataset, which are used in this comparison, are:
The Sun was > 18° below the horizon.
A linear fit across five background regions, identified by the black bands below the spectra in Figure 1, has a slope of <0.6 counts s−1 nm−1. This criterion removes extreme moon and variable-cloud influences.
The uncertainty in the temperature estimate due to counting statistics is < 7 K.This eliminates spectra with significantly reduced intensities due to cloud cover.
The weighted standard deviation of the temperature, as calculated from different line pair ratios, is < 10 K.
OI/P1 (3) < 2. The OI emission at λ844.6 nm (see Fig. 1) is aurorally sensitive. This criterion eliminates extreme auroral influences.
Data acquisition is limited by day length at Davis. During 1990, spectra were collected over the interval 31 March-27 September (day-of-year (DoY) 90-270). in 1995

Fig. 1. The OH (6-2) spectral region, showing the principal emissions.

Fig. 2. Temperatures and error estimates as derived from individual spectra from 1990, 1995 and 1996. Errors plotted are the maximum of the weighted standard deviation of the temperatures derived from the individual line ratios, and the weighted average statistical error. Also shown is the MSISE-90 model seasonal variation at 87 km. for the appropriate year and viewing aspect.
and 1996 the intervals are 12 March—30 September (DoY 71-273) and 11 March-23 September (DoY 71 267), respectively. in 1995, spectra from 27 May-2 August (DoY 147— 214) are not utilised, as subsequent analysis revealed that the instrument bandwidth was considerably degraded (0.22 nm) over this interval. in 1996, a significant data gap (28 June 21 July; DoY 179 202) resulted when effort was directed toward spectral calibration of the CZT in all its past operating modes. in 1990, campaigns were centred on new moon periods. There was no such restriction in 1995 and 1996. There arc 276 spectra in the 1990 dataset, 418 in 1995 and 989 in 1996.
3. Temperatures and Error Estimates
Figure 2 shows separately the temperatures determined each year. The temperatures plotted are the weighted average of the temperatures derived from the P1 (2)/P1(4), P1 (2)/ P1 (5) and P1 (4)/P1 (5) ratios. The weighting accotints for the

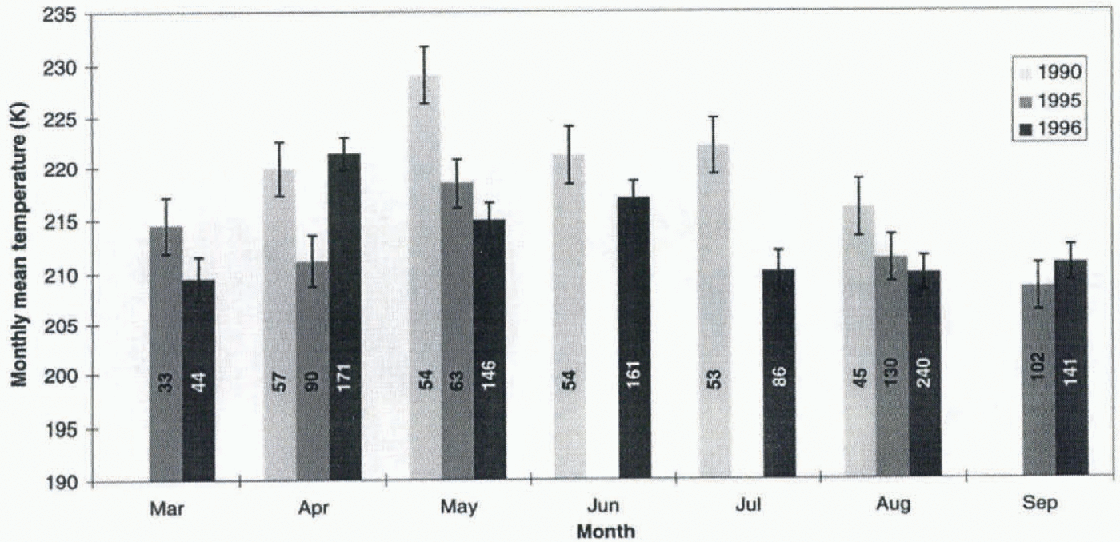
Fig. 3. Monthly average temperatures, error estimates and number of spectra averaged. A minimum of 30 spectra is required for inclusion.
relative statistically determined accuracy of each ratio, and the sensitivity of that ratio to the temperature. Errors plotted are the maximum of the weighted standard deviation of the temperatures derived from the individual line ratios, and the weighted average statistical error. Also shown in Figure 2 is the MSISE-90 model seasonal variation at 87 km, for the appropriate year and viewing aspect. Figure 3 shows a histogram of the monthly averages of the temperatures determined when at least 30 spectra were available for determining an average.
The largest error in the absolute determination of the temperatures results from the variation in published values of the transition probabilities necessary for deriving the temperature. We have used Reference Turnbull and LoweTurnbull and Lowe (1989) transition probabilities. Temperatures are approximately 7 Κ lower if Reference MiesMies' (1974) transition probabilities are used, and 12 Κ lower if Reference Langhoff, Werner and P. Rosmus.Langhoff and others' (1986) values are used. We are presently undertaking the necessary measurements and realistically expect that the absolute error in the temperature determination can be reduced to < 5 K. While a better understanding of the atmosphere is possible from more accurate determinations of the temperature, this is not a difficulty in determining climate change. For climate-change studies it is only essential that the same transition probabilities are used across the years compared.
The average “counting” error for a spectrum (an error estimate based on the number of photons counted and the contaminations subtracted, but assuming that all intensities arc measured simultaneously) amounts to 4 Κ in 1990 and 5 Κ in 1995 and 1996. The slightly larger value in the later years results from lower intensities associated with zenith rather than off-zenith observations. The error in the mean temperature values is significantly reduced (by the square root of the number of spectra) by averaging the temperatures derived from large numbers of spectra.
The greatest source of error associated with a spectrum results from the time taken to acquire the spectrum. The intensity of the lines used to determine the temperatures is not determined simultaneously, and the possibility of the intensity changing while scanning from one line to the next was estimated by Greet and others (1998), by comparison with photometer observations of intensity variations of an individual line, to result in an average uncertainty of 7 K. This result is consistent across the 3 years' data presented here, as the spectrometer wavelength step-size and d well-time parameters are consistent. Because the scan direction is always from shorter to longer wavelengths, a general decrease in intensity across the night hours is estimated to result in a 1 K reduction in the average temperatures derived. Again, this effect is consistent across the years. As of 1997 a different data-collection procedure has been adopted. This involves stepping directly between the features whose intensities are required for the temperature determinations. This will enable this source of error to be eliminated in future datasets.
An auroral correction to contamination in the 1990 data lowers the average temperatures by 3 K. The correction in 1995 and 1996 is reduced, due to use of an appropriate order-separating filter.
The uncertainty in the instrument-response calibration, determined from the variation in the spectral-response calibration scans over each separate year, is 2 Κ for 1990 and 1995 and <1K for 1996. This error is not reduced by increased sampling, and is the largest source of error in the past datasets affecting their use in climate-change investigations. By increasing the temperature stability of the GaAs photomultiplicr tube, we have been able to reduce this source of error in the 1997 calibrations to <0.3 K.
The uncertainties in the average temperatures are estimated as the square root of the sum of the squares of: the standard error in the mean of the temperatures averaged; the uncertainty in the instrument-response correction; the standard error associated with the time taken to acquire the spectra (limited to a minimum value of 1 K); and an estimated auroral correction uncertainty (half the average correction). These values are the errors in the monthly averages shown in Figure 3, and the errors listed in association with the mid-winter average temperatures below.
The mid-winter average temperature for May-July (MJJ) is 224±2K for 1990 (DoY 121-312), and 215 ±2 Κ for 1996 (DoY 122-313). A 1995 mid-winter average is not appropriate due to the large data gap during this interval.
4. Discussion
It is apparent from figures 2 and 3 that there are considerable temperature variations on time-scales longer than 1 day (planetary scale). These variations are capable of affecting the monthly averages (see, e.g., the high value for April 1996 (DoY 92-121)), and will have some influence on seasonal values. Whether interannual variability in planetary-scale variations is capable of causing the large difference measured between the 1990 and 1996 mid-winter averages can only be determined by measurements across further years.

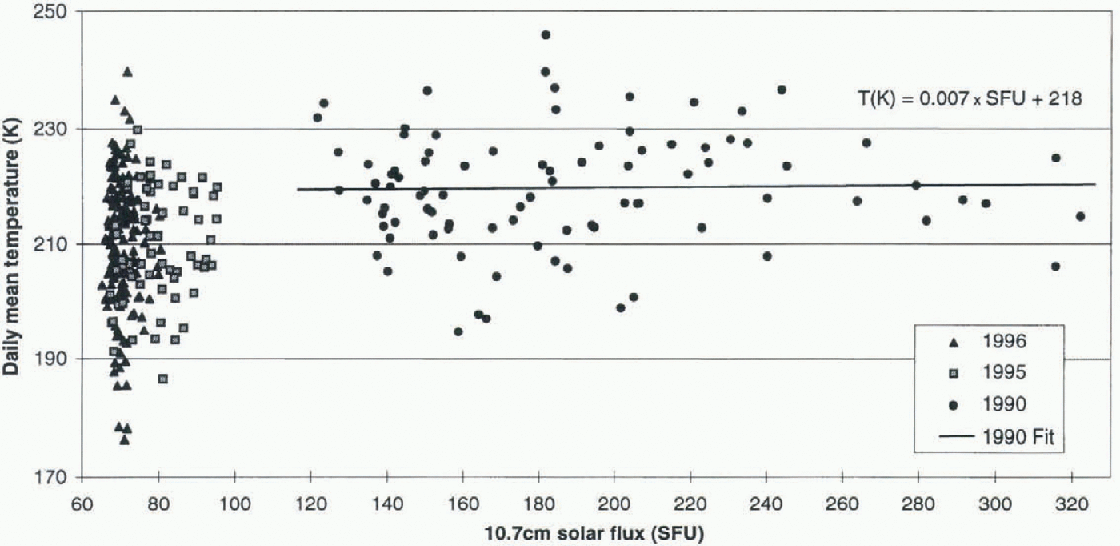
Fig. 4. The mean daily temperature plotted against the 10.7 cm solar Jinx. A trend line is fitted to the 1990 data.
The MSISE-90 model indicates that the different viewing aspect can account for a difference only of the order of 1 K, not the 9 Κ measured.
There have been reports in the literature of the dependence of OH temperatures on the level of solar activity. For example, Reference Sahai, Giers, Cogger, Fagundes and GarbeSahai and others (1996) reported a strong positive relationship between OH temperatures and the 10.7 cm solar flux. The 1990 MJJ average 10.7 cm flux is 166 solar flux units (SFU), while in 1996 the MJJ average is 70 SFU. The association reported by Sahai and others (1996) would imply a temperature difference of 28 K. Figure 4 plots the Davis daily-averaged OH layer temperatures against 10.7 cm solar flux, with the individual years delineated. Considerable variation in the level of solar activity is found in the 1990 data. An insignificant, slightly positive dependence between 10.7 cm flux and temperature is found in the 1990 data. This would account for < 1 Κ of the temperature difference recorded between 1990 and 1996. Again, further measurements are necessary to reconcile the difference in solar-activity dependence between our temperatures and those reported by other researchers.
The calibration of our 1990 data relics on the stability over time of the quartz-halogen lamp. For the reasons indicated previously, we believe this is a valid assumption, but future measurements are necessary to definitively determine the stability of this lamp.
Conclusions
A significant temperature decrease of the order of 9 Κ has been measured between the 1990 and 1996 mid-winter temperatures of the OH-emitting region around 87 km above Davis. The cause of the difference remains uncertain, but is amenable to resolution by future measurements.
The limited results so far obtained support the assertion that the Antarctic mesopause region is of interest for its “climate-change” susceptibility.
We have implemented data-collection, instrument-calibration and analysis procedures for an ongoing spectroscopic programme at Davis that allows measurement of monthly, OH-emission-region, temperatures to an accuracy of the order of 1 K.
A more extensive dataset is required to delineate the natural variability in this tenuous region.


