


1. Introduction
The COVID-19 pandemic has forced countries to make difficult trade-offs. For example, vaccination prioritization strategies and decisions to ration treatment required weighing the relative health benefits to different people. Decisions about the extent and length of school and business shutdowns required balancing the reductions in deaths and morbidity against socioeconomic costs. Are conventional benefit–cost approaches suitable to make these kinds of trade-offs? This article challenges the use of benefit–cost analysis (BCA) in the economic evaluation of pandemic risks whose impacts are heterogeneously distributed across the population. In particular, this article argues in favor of an alternative method, social welfare analysis (SWA). The main advantage of SWA is that it enables ethical concerns about the distribution of impacts to be incorporated in the evaluation exercise in a transparent way (Adler et al., Reference Adler, Bradley, Ferranna, Fleurbaey, Hammitt, Turquier, Voorhoeve, Wilkinson and Savulescu2023). Although this article focuses on the economic evaluation of pandemic risks, its implications are wider and relate to any policy with heterogeneous impacts across the population.
This article explores the differences between BCA and SWA in the evaluation of pandemic-related policies. To illustrate the difference between the two methods, I estimate the maximum willingness-to-pay (WTP) for a pandemic preparedness intervention that is designed to prevent a pandemic similar to the COVID-19 one. Pandemic preparedness investments include, e.g. the development of vaccines against pandemic-potential pathogens (Saville et al., Reference Saville, Cramer, Downham, Hacker, Lurie, Van der Veken, Whelan and Hatchett2022), establishing guidelines for the optimal global distribution of vaccines, therapeutics, protective equipment and other resources (Emanuel et al., Reference Emanuel, Persad, Kern, Buchanan, Fabre, Halliday, Heath, Herzog, Leland, Lemango, Luna, McCoy, Norheim, Ottersen, Schaefer, Tan, Heath Wellman, Wolff and Richardson2020), and strengthening epidemic surveillance systems. To determine the maximum WTP for pandemic preparedness, I consider the perspective of a supranational benevolent decision maker who aims at improving the well-being of the global population. The social value of preventing a COVID-19-like pandemic depends on the adopted value framework (BCA vs. SWA). In particular, it depends on the method to monetize health impacts and on the procedure to aggregate monetary impacts across the global population.
BCA determines the value of an intervention by converting all its health and non-health impacts into monetary equivalents based on individuals’ WTP to avoid those impacts, and then summing up those monetary equivalents. Estimates of value-per-statistical-life (VSL) are typically used to monetize the value of mortality risk reductions (Hammitt, Reference Hammitt2000). VSL represents the monetary equivalent of saving one (unidentified) life among a group of identical people. VSL estimates are derived from individuals’ stated or revealed willingness to trade small changes in income for small changes in mortality risk (Viscusi, Reference Viscusi2018). For example, if individuals are willing to pay $10 to reduce their risk of premature death by 1 in a million, then the monetary value of saving one statistical life is $10 million. In other words, if each member of a group of 1 million people, identical in all relevant ways, considers it in their best interest to pay $10 to reduce the expected number of deaths within the group by one, then the value of preventing one death is $10 million. In principle, VSL measures are heterogeneous across the population, reflecting the preferences and circumstances of different individuals (e.g., age, income, overall mortality risk) (Viscusi, Reference Viscusi2010). Empirical VSL estimates are available for several countries and they can serve as proxies for countries with unavailable estimates, with appropriate adjustments for differences in income and other characteristics (Hammitt & Robinson, Reference Hammitt and Robinson2011; Viscusi & Masterman, Reference Viscusi and Masterman2017).
Application of BCA to the evaluation of pandemic-preparedness interventions unfolds as follows. Suppose that we are interested in determining the optimal investment in pandemic preparedness to prevent the effects of a future potential pandemic. Let us further assume that such an investment is expected to prevent $ {D}_c $
deaths in country
$ {D}_c $
deaths in country $ c $
and that it will avoid country-specific income losses in the amount
$ c $
and that it will avoid country-specific income losses in the amount $ \$\Delta {Y}_c $
. The overall cost of the investment is
$ \$\Delta {Y}_c $
. The overall cost of the investment is $ \$X $
, and country c is contributing
$ \$X $
, and country c is contributing $ \${x}_c\ge 0 $
to its financing, with
$ \${x}_c\ge 0 $
to its financing, with $ {\sum}_c\${x}_c=\$X $
. A supranational benevolent authority has to decide whether such an investment is beneficial. According to BCA, the net value of the investment is equal to
$ {\sum}_c\${x}_c=\$X $
. A supranational benevolent authority has to decide whether such an investment is beneficial. According to BCA, the net value of the investment is equal to $ {\sum}_c\left({D}_c\ast VS{L}_c+\$\Delta {Y}_c\right)-{\sum}_c\${x}_c $
, where the term in parentheses is the monetary benefit for country
$ {\sum}_c\left({D}_c\ast VS{L}_c+\$\Delta {Y}_c\right)-{\sum}_c\${x}_c $
, where the term in parentheses is the monetary benefit for country $ c $
. Thus, the investment is considered beneficial as long as its overall cost
$ c $
. Thus, the investment is considered beneficial as long as its overall cost $ \$X $
is lower than the sum of the country-specific monetary benefits.
$ \$X $
is lower than the sum of the country-specific monetary benefits.
Such a BCA rationale has well-known shortcomings. Since BCA sums up individuals’ monetary equivalents, the distribution of the costs of the intervention has no relevance for the benefit–cost calculus (Robinson et al., Reference Robinson, Hammitt and Zeckhauser2016). Thus, it does not matter whether the investment is paid by individuals in high-income countries or by individuals in low-income countries. Presumably, many people would find the latter morally reproachful, i.e. they would attach higher value to interventions that are paid by wealthy nations than to interventions that have the same distribution of monetary benefits and the same total monetary cost but whose cost is borne by poor countries.Footnote 1 However, BCA is based on the principle that “a dollar is a dollar is a dollar.” As a consequence, monetary losses borne by low-income individuals have the same moral importance as monetary losses experienced by high-income individuals, even though the former may reduce the individuals to poverty while the latter may represent a small nuisance. Here, I focused on the distribution of the cost of the intervention, but the same principle applies to the distribution of income gains $ \$\Delta {Y}_c $
.
$ \$\Delta {Y}_c $
.
Another consequence of the “a dollar is a dollar is a dollar” principle is that the health burden – e.g. a reduction in expected remaining lifespan of Y years, or a Y% reduction in one’s quality of life for Z years – suffered by a well-off person tends to count more than an identical health burden suffered by a less well-off individual. This is due to the adoption of income-dependent VSL metrics. VSL is typically increasing in income since WTP is driven by individuals’ ability to pay. In other words, well-off individuals are likely to place higher monetary values on mortality risk reductions than less well-off individuals not necessarily because they value life more, but because they have more resources and are thus more willing to trade money for changes in risk.Footnote 2 Suppose that there are two alternative pandemic preparedness interventions (e.g., two different mechanisms of allocating vaccines worldwide). They both cost $ \$X $
and they both prevent
$ \$X $
and they both prevent $ D $
deaths globally. However, the first intervention saves only people in high-income countries, while the second intervention saves only people in low-income countries. Since VSL in high-income countries is larger than VSL in low-income countries and BCA takes an unweighted sum of individuals’ net benefits, the first intervention would be considered more beneficial than the latter.
$ D $
deaths globally. However, the first intervention saves only people in high-income countries, while the second intervention saves only people in low-income countries. Since VSL in high-income countries is larger than VSL in low-income countries and BCA takes an unweighted sum of individuals’ net benefits, the first intervention would be considered more beneficial than the latter.
To mitigate concerns for discrimination, practical guidelines for the conduct of BCA suggest to use population-average VSLs, independent of individuals’ characteristics such as income or age (Robinson, Reference Robinson2007). However, it is also common practice to use different VSL estimates for different countries based on their national income (Viscusi & Masterman, Reference Viscusi and Masterman2017; Robinson et al., Reference Robinson, Hammitt and O’Keeffe2019). As the pandemic preparedness example illustrates, that choice matters when evaluating interventions with supranational impacts (e.g., when determining the global value of developing new vaccines). In particular, comparisons of the burden of a pandemic across countries would place a larger value on negative health impacts experienced in high-income countries compared to the same health impacts borne by lower-income countries.
One possible solution is to adopt a global VSL estimate for all countries (Cadarette et al., Reference Cadarette, Ferranna, Cannon, Abbas, Giannini, Zucker and Bloom2023), similarly to what is typically done at the national level. Although easy to implement, the use of a single VSL estimate at the national or global level neglects potentially ethically justifiable reasons for attaching different moral values to risk reductions accruing to different people. For example, it is often considered ethically and economically reasonable to treat people in different age groups differently (Ferranna et al., Reference Ferranna, Hammitt, Adler, Bloom, Sousa-Poza and Sunde2023). From a societal perspective, the death of a young person is often considered worse than the death of an old person, and not only because the former has a longer remaining life expectancy than the latter. There exists a relatively large public health literature supporting the “fair innings” principle (Harris, Reference Harris1985; Williams, Reference Williams1997; Bognar, Reference Bognar2015). The principle states that saving the life of a younger person is fairer than saving the life of an older person when each would gain the same extension in longevity because older individuals have already lived a long life and, as such, they have less claim to scarce resources.Footnote 3 This issue is particularly important in the case of COVID-19, since mortality risk increases with age. Therefore, even though the dependence of WTP on income can have unacceptable ethical consequences, the use of a single VSL may also be ethically problematic. Adopting a constant value-per-statistical-life-year (VSLY) instead of a constant VSL addresses differences in remaining life expectancy between young and old people (Hammitt, Reference Hammitt2007). However, we still have the problem of how to select this constant VSLY and whether there should be cross-country differences based on income. Moreover, fair innings concerns would still play no role in the BCA results.
SWA does not face the same ethical challenges as BCA. SWA proceeds by estimating the impact of the pandemic on individuals’ well-being, and then aggregating those impacts through a social welfare function. The aggregation rule identifies the normative assumptions about distributive justice (Adler, Reference Adler2019). For example, the utilitarian social welfare function assumes that total welfare is equal to the sum of individuals’ well-being. If marginal well-being is decreasing in income, the utilitarian approach is sensitive to inequalities in income. Thus, monetary impacts experienced by low-income individuals are morally more important than similar monetary impacts experienced by high-income individuals. Another popular welfare function is the prioritarian one, which assumes that total welfare is equal to the sum of a concave transformation of individuals’ well-being. Thus, the prioritarian approach is concerned with the distribution of well-being across the population, attaching higher value to well-being increments that accrue to the worse-off individuals (e.g., low-income individuals, but also individuals in poor health or young individuals).
As an approximation, SWA reduces to a weighted sum of individuals’ net monetary benefits (Adler, Reference Adler2016). The weights reflect the relative moral importance of net benefits accruing to different individuals, and their form depends on the adopted welfare framework. Applied to the pandemic preparedness example, SWA would find the intervention beneficial if and only if $ {\sum}_c{\omega}_c\left({D}_c\hskip0.35em \ast \hskip0.35em VS{L}_c+\$\Delta {Y}_c-\${x}_c\right)\ge 0 $
, where
$ {\sum}_c{\omega}_c\left({D}_c\hskip0.35em \ast \hskip0.35em VS{L}_c+\$\Delta {Y}_c-\${x}_c\right)\ge 0 $
, where $ {\omega}_c $
is the moral weight attached to net benefits experienced in country
$ {\omega}_c $
is the moral weight attached to net benefits experienced in country $ c $
. Therefore, under SWA, both the distribution of costs and the distribution of benefits matter. In particular, interventions paid for by poor countries will typically have lower net benefits than similar interventions paid for by rich countries. And saving lives in rich countries will not necessarily be considered more beneficial than saving an equal number of lives in poor countries.
$ c $
. Therefore, under SWA, both the distribution of costs and the distribution of benefits matter. In particular, interventions paid for by poor countries will typically have lower net benefits than similar interventions paid for by rich countries. And saving lives in rich countries will not necessarily be considered more beneficial than saving an equal number of lives in poor countries.
Using data on the mortality and income consequences of the COVID-19 pandemic, I estimate the value of avoiding a future COVID-19-like pandemic using both the BCA rule, $ {\sum}_c\left({D}_c\hskip0.35em \ast \hskip0.35em VS{L}_c+\$\Delta {Y}_c-\${x}_c\right) $
, and the approximated social welfare one,
$ {\sum}_c\left({D}_c\hskip0.35em \ast \hskip0.35em VS{L}_c+\$\Delta {Y}_c-\${x}_c\right) $
, and the approximated social welfare one, $ {\sum}_c{\omega}_c\left({D}_c\hskip0.35em \ast \hskip0.35em VS{L}_c+\$\Delta {Y}_c-\${x}_c\right) $
. In addition, I determine the distribution of the pandemic burden across countries under the two approaches. When using the social welfare approach, I derive two different sets of weights: The first set of weights corresponds to the utilitarian aggregation rule and the second one identifies the prioritarian aggregation rule. I show that considerations about the distribution of the costs of the hypothetical intervention to prevent a COVID-19-like pandemic play a major role in the estimate of the welfare value: The more progressive is the distribution of the costs, the larger are the net benefits of preventing the pandemic. In contrast, under BCA, the value of preventing the pandemic is indifferent to the distribution of the intervention costs. In addition, compared to SWA, BCA tends to underestimate the burden suffered by low-income countries relative to high-income countries.
$ {\sum}_c{\omega}_c\left({D}_c\hskip0.35em \ast \hskip0.35em VS{L}_c+\$\Delta {Y}_c-\${x}_c\right) $
. In addition, I determine the distribution of the pandemic burden across countries under the two approaches. When using the social welfare approach, I derive two different sets of weights: The first set of weights corresponds to the utilitarian aggregation rule and the second one identifies the prioritarian aggregation rule. I show that considerations about the distribution of the costs of the hypothetical intervention to prevent a COVID-19-like pandemic play a major role in the estimate of the welfare value: The more progressive is the distribution of the costs, the larger are the net benefits of preventing the pandemic. In contrast, under BCA, the value of preventing the pandemic is indifferent to the distribution of the intervention costs. In addition, compared to SWA, BCA tends to underestimate the burden suffered by low-income countries relative to high-income countries.
There is a long tradition of scholarly work advocating for the use of SWA (or its weighted-BCA approximation) in policy evaluation (e.g., Arrow, Reference Arrow1963, Drèze & Stern, Reference Drèze, Stern, Auerbach and Feldstein1987, Blackorby & Donaldson, Reference Blackorby and Donaldson1990, and, more recently, Adler, Reference Adler2012). One problem with SWA is that it requires an interpersonally comparable measure of individual well-being. As argued in Adler (Reference Adler2016) and Fleurbaey and Abi-Rafeh (Reference Fleurbaey and Abi-Rafeh2016), the reluctance to adopt SWA in policy evaluation is likely due to difficulties in measuring and ranking well-being levels across the population, especially when individuals hold heterogeneous preferences. Different approaches have been developed to measure well-being (see Adler & Decancq, Reference Adler, Decancq, Adler and Norheim2022 for a review), and in this article I will focus on one specific approach (von Neumann-Morgenstern utilities). However, due to data limitations, I will also assume homogeneous preferences across countries and calibrate only one set of preference parameters. The assumption of homogeneous preferences is common in practical applications of SWA (Adler, Reference Adler, Adler and Norheim2022), and it implies interpersonally comparability of individual well-being metrics.
In contrast, BCA does not require a method for comparing well-being across individuals. BCA uses monetary values to compare benefits and costs across individuals, and the sum of individuals’ costs and benefits determines whether the policy yields a potential Pareto improvement (Kaldor–Hicks efficiency criterion). The logic is that, when the net benefits of a policy are positive, then there are enough resources for the “winners” to compensate the “losers,” such that everyone will at the end be better off with the policy than without it. There is a large literature on the advantages and drawbacks of this view (e.g., Arrow, Reference Arrow1963; Harberger, Reference Harberger1978; Kaplow, Reference Kaplow2004; Boadway, Reference Boadway, Adler and Fleurbaey2016; Hammitt, Reference Hammitt2021). One well-recognized issue is that the compensation is hypothetical: There is no evidence that the “losers” are compensated through transfers, adjustments to the tax systems or other policies. In this article, I take the view that it is not possible to separate efficiency and equity in policy evaluation (Adler, Reference Adler2016; Fleurbaey & Abi-Rafeh, Reference Fleurbaey and Abi-Rafeh2016). If the impacts of a policy are heterogeneously distributed across the population, then the policy will have an (intended or unintended) effect on equity. BCA is not agnostic about distributive justice. On the contrary, by looking at the simple sum of individuals’ WTPs, BCA is implicitly taking the moral stance that monetary benefits to the wealthy are as socially valuable as monetary benefits to the less wealthy. Even though SWA is more challenging to perform than BCA, SWA enables ethical concerns about the distribution of impacts to be incorporated in the evaluation exercise.
A few caveats before proceeding. Because of data limitations, this article focuses only on two pandemic impacts: COVID-19 deaths and income losses. The estimated global burden of the COVID-19 pandemic is conservative as additional impacts (e.g., non-COVID-19 deaths, morbidity, mental health and education losses) are ignored. Additionally, the application focuses on between-country differences in pandemic impacts, while within-country inequalities are neglected. This will lead to conservative estimates of the global pandemic burden when using a social welfare approach since the distribution of impacts across the global population is likely to be more unequal than the average distribution of impacts across countries. For example, the adoption of country-average income losses neglects that the pandemic caused some people to fall into poverty. A distribution-sensitive welfare approach would consider this outcome morally wrong, thereby increasing the overall value of preventing the pandemic.
This article is structured as follows. Section 2 summarizes the literature most closely related to this article. Section 3 introduces a stylized model to estimate the global value of preventing a COVID-19-like pandemic and derives three measures of such a value: the BCA value based on country-specific VSL measures, the utilitarian value, and the prioritarian one. Section 4 describes the data required for the analysis and presents the estimation results. I estimate the global value of preventing the pandemic and its distribution across all countries with available data. Section 5 concludes and discusses the main limitations of this article.
2. Related literature
The health, social, and economic costs of the COVID-19 pandemic are staggering. As of September 2023, almost 7 million COVID-19 deaths have been recorded globally (WHO, 2023), while estimates of excess mortality (including both estimates of undocumented COVID-19 deaths and deaths from other causes) are in the ballpark of 26 million deaths (The Economist, 2023).Footnote 4 Global Gross Domestic Product (GDP) reduced by 3.1% in 2020 (IMF, 2021). Almost 1.6 billion students worldwide were affected by school closures because of the COVID-19 pandemic, and average learning loss amounted to roughly 35% of a school year’s worth of learning (Betthäuser et al., Reference Betthäuser, Bach-Mortensen and Engzell2023). The pandemic drove massive unemployment and permanent business closures (Baek et al., Reference Baek, McCrory, Messer and Mui2021, Fairlie et al., Reference Fairlie, Fossen, Johnsen and Droboniku2023) and disrupted global supply chains (Guerrieri et al., Reference Guerrieri, Lorenzoni, Straub and Werning2022). It also imposed a sizable mental health toll due to isolation, fear of contagion and loss of family and friends (Giuntella et al., Reference Giuntella, Hyde, Saccardo and Sadoff2021).
The impacts of the pandemic have been very unequal across the population. On the one hand, COVID-19 mortality risk sharply increases with age (Pijls et al., Reference Pijls, Jolani, Atherley, Derckx, Janna, Gregor and Hendricks2021). Due to differences in population age structure, high-income countries typically registered more COVID-19 deaths than lower-income countries. On the other hand, the COVID-19 pandemic has exacerbated existing inequalities through: patterns of infection and death that disproportionately affect disadvantaged populations (e.g., the overproportion of minorities and low-income individuals among essential workers); socioeconomic differences in healthcare access and in ability to invest resources to control the pandemic, including the purchase of vaccines and treatments; and inadequate income relief programs to equitably share the economic burden of the pandemic (Stantcheva, Reference Stantcheva2022). Overall, the pandemic seems to have led to an increase in global income inequality (Mahler et al., Reference Mahler, Yonzan and Lakner2022).Footnote 5
In the evaluation of pandemic-related policies, two main approaches have emerged: BCA based on VSL measures (e.g., Gollier, Reference Gollier2020; Greenstone & Nigam, Reference Greenstone and Nigam2020; Thunstrom et al., Reference Thunstrom, Newbold, Finnoff, Ashworth and Shogren2020), and utilitarian social welfare functions (e.g., Hall et al., Reference Hall, Jones and Klenow2020; Quaas et al., Reference Quaas, Meya, Schenck, Bos, Drupp and Requate2021; Glover et al., Reference Glover, Heathcote, Krueger and Ríos-Rull2023). A few papers discuss nonutilitarian social welfare approaches (e.g., Ferranna et al., Reference Ferranna, Sevilla, Bloom, Adler and Norheim2022; Adler et al., Reference Adler, Bradley, Ferranna, Fleurbaey, Hammitt, Turquier, Voorhoeve, Wilkinson and Savulescu2023). Here, I review only the articles that estimate the burden of the pandemic.Footnote 6
Cutler and Summers (Reference Cutler and Summers2020) use a BCA approach and estimate that the expected cost of the COVID-19 pandemic in the United States amounted to more than $16 trillion. That figure is based on a population-average VSL estimate of $7 million, and on the inclusion of losses due to premature death, long-term health impairments, mental health impairments and the economic recession. In a similar vein, Viscusi (Reference Viscusi2020) adopts income-adjusted VSL measures for different countries and estimates that the global COVID-19 mortality burden in the first half of 2020 amounted to $3.5 trillion, with the United States experiencing 25% of the total deaths but 41% of the monetary burden. The global estimate is found by assuming a population-average VSL of $11 million for the United States and a global income elasticity of 1 (i.e., the ratio of VSL to national income is constant across countries). In particular, the use of income-adjusted VSL measures implies that the mortality burden in the United States is valued more than the mortality burden in other countries. This ethically challenging result is not robust to social welfare evaluation methods.
The closest analysis to this article is Decerf et al. (Reference Decerf, Francisco, Mahler and Sterck2021), who estimate the global burden of the pandemic by adopting a utilitarian welfare function that depends solely on the number of people alive and on whether they are in poverty or not. The welfare loss of the pandemic is the weighted sum of the number of years lost to premature COVID-19 death and the number of additional years spent in poverty because of the pandemic. The trade-off between mortality and poverty is given by a single normative parameter. The estimated welfare loss depends largely on the increase in poverty caused by the pandemic, especially in lower-income countries. Given that the welfare metric is the number of years of life and each year of life is valued equally, impacts in high-income countries are not inflated compared to similar impacts in lower-income countries. However, the welfare measure is sensitive to differences in life expectancy across countries.
There exists also a small literature focusing on the costs of future pandemics. Fan et al. (Reference Fan, Jamison and Summers2018) and Glennerster et al. (Reference Glennerster, Snyder and Tan2023) both employ VSL measures to price pandemic risks and find that the expected global annual losses from pandemic risk range from $500 billion (2013 values) to $700 billion (2021 values), respectively. The larger estimate provided by Glennerster et al. is in part due to risk updates following the COVID-19 pandemic and to the inclusion of educational losses in the calculus. Martin and Pindyck (Reference Martin and Pindyck2021) consider a utilitarian framework and estimate that the WTP to avoid major pandemics is 10% or more of annual consumption and partly driven by the risk of macroeconomic contractions. With a utilitarian welfare framework, the value of non-marginal health risks positively depends on background income risk under commonly used parameterization of the utility function.
This article focuses on the inability of BCA to account for the distributional impacts of a pandemic. Three other shortcomings of BCA have been highlighted in the literature on pandemic policies. First, morbidity consequences can be sizable (think, e.g., at long-COVID), and it is unclear how to evaluate reductions in morbidity for emerging or previously unexplored health risks (Kniesner & Sullivan, Reference Kniesner and Sullivan2020; Robinson et al., Reference Robinson, Sullivan and Shogren2021). Second, BCA based on standard VSL estimates overestimates the value of preventing a large number of deaths (Hammitt, Reference Hammitt2020). VSL is the marginal rate of substitution of income for mortality risk, but pandemics entail non-marginal health risk changes. In particular, standard VSL estimates tend to overestimate individuals’ WTP to reduce non-marginal risks. When the risk change is large, income constraints play an important role as individuals might be required to deplete their resources to pay for the risk reduction. Third, pandemic risks are novel and subject to large uncertainties (Berger et al., Reference Berger, Berger, Bosetti, Gilboa, Hansen, Jarvis, Marinacci and Smith2021). However, issues of deep uncertainty and ambiguity are not featured in BCA. Although all these shortcomings are important, this article focuses exclusively on the distributional aspect.
3. Evaluation frameworks
The section introduces a simplified framework to assess the value of a hypothetical intervention to prevent the impacts of a pandemic similar to the COVID-19 one. The COVID-19 pandemic has affected people’s lives along multiple dimensions, from exposing individuals to severe health risks to disrupting work habits and social relations. Impacts have also been heterogeneously distributed across the population, with older people, minorities and socioeconomic vulnerable populations often bearing the brunt of the pandemic. Notwithstanding the plethora of impacts of the pandemic, in the following I will focus only on two major impacts: deaths and income losses. This choice is dictated by data constraints and it is not meant to downplay the importance of other impacts (e.g., non-COVID-19 deaths, long-COVID, worsening of mental health, undernutrition, disruption to routine immunization and educational losses). Additionally, since consistent data across countries are missing, I disregard the within-country distribution of pandemic impacts, and focus only on between-country differences in deaths and income losses.
3.1. A stylized model
The starting point for the analysis is a measure of individual well-being. Generally speaking, well-being is assumed to depend on a bundle of attributes that are important to individuals (e.g., income, physical and mental health, longevity, quality of the environment and social relations). Since the only COVID-19 impacts included in the analysis are death and income losses, I assume that individuals’ well-being depends only on income and longevity.
Well-being and its dependence of the bundle of attributes can be measured in several ways (Adler & Fleurbaey, Reference Adler and Fleurbaey2016; Adler & Decancq, Reference Adler, Decancq, Adler and Norheim2022), including: reports of life satisfaction or experience of emotions (Layard & De Neve, Reference Layard and De Neve2023); attainment of a list of objective goods or “capabilities” (e.g., being healthy, having meaningful social relations) (Sen, Reference Sen1999; Nussbaum, Reference Nussbaum2011); adjusting individual income by the value of nonmarket attributes based on the individual’s preferences for those attributes (Fleurbaey et al., Reference Fleurbaey, Luchini, Muller and Schokkaert2013); and employing utility functions that represent individuals’ risk preferences regarding alternative probability distributions of attributes over a lifetime (von Neumann-Morgenstern utility function) (Adler, Reference Adler2019). In this article, I measure well-being through a von Neumann-Morgenstern utility function. Additionally, I assume that individuals have homogeneous preferences, i.e. there exists a single utility function for the whole population. I will not test the robustness of the results to other measures of well-being or to heterogeneous preferences.
Furthermore, I assume that the well-being metric of interest is lifetime well-being rather than sub-lifetime well-being. As a consequence, judgments about who is worse-off in a society are based on individuals’ entire life trajectory and not only on their current or future circumstances. Lifetime well-being is additive in period utility and the marginal utility of income is diminishing, so that a dollar raises the utility of a poor individual more than it does that of a rich individual. To make computations tractable, I assume no time discounting and no economic growth.
Let us consider a representative individual in country $ c $
. Let
$ c $
. Let $ {y}_c $
be the income of the representative individual. With probability
$ {y}_c $
be the income of the representative individual. With probability $ {p}_c $
, the individual dies at age
$ {p}_c $
, the individual dies at age $ {l}_c $
(i.e., they live for
$ {l}_c $
(i.e., they live for $ {l}_c $
years), and with probability
$ {l}_c $
years), and with probability $ 1-{p}_c $
the individual dies prematurely at age
$ 1-{p}_c $
the individual dies prematurely at age $ {a}_c<{l}_c $
(i.e., they live for
$ {a}_c<{l}_c $
(i.e., they live for $ {a}_c $
years). The period utility function is
$ {a}_c $
years). The period utility function is $ u\left({y}_c\right) $
, with
$ u\left({y}_c\right) $
, with $ {u}^{\prime}\left({y}_c\right)>0 $
and
$ {u}^{\prime}\left({y}_c\right)>0 $
and $ {u}^{\prime \prime}\left({y}_c\right)<0 $
. The period utility in the death state is zero.
$ {u}^{\prime \prime}\left({y}_c\right)<0 $
. The period utility in the death state is zero. $ {N}_c $
is the number of people living in country
$ {N}_c $
is the number of people living in country $ c $
. Expected lifetime utility for the representative individual in the absence of the pandemic is equal to:
$ c $
. Expected lifetime utility for the representative individual in the absence of the pandemic is equal to:
 $$ {V}_c^{NP}={p}_c{l}_cu\left({y}_c\right)+\left(1-{p}_c\right){a}_cu\left({y}_c\right)\hskip6.119996em $$
VSL at age $ {a}_c $
derives from the marginal rate of substitution between survival and income at age
$ {a}_c $
derives from the marginal rate of substitution between survival and income at age $ {a}_c $
. Given (1),
$ {a}_c $
. Given (1), $ VS{L}_c=\frac{\partial {V}_c/\partial {p}_c}{\partial {V}_c/\partial {y}_c\left({a}_c\right)}=\frac{\left({l}_c-{a}_c\right)u\left({y}_c\right)}{u^{\prime}\left({y}_c\right)} $
, with
$ VS{L}_c=\frac{\partial {V}_c/\partial {p}_c}{\partial {V}_c/\partial {y}_c\left({a}_c\right)}=\frac{\left({l}_c-{a}_c\right)u\left({y}_c\right)}{u^{\prime}\left({y}_c\right)} $
, with $ {y}_c\left({a}_c\right) $
denoting income at age
$ {y}_c\left({a}_c\right) $
denoting income at age $ {a}_c $
. VSL is increasing in remaining life expectancy
$ {a}_c $
. VSL is increasing in remaining life expectancy $ \left({l}_c-{a}_c\right) $
: Individuals who live longer can reap the benefits of the risk reducing intervention for more years and thus have a larger WTP for the intervention. VSL is also increasing in income
$ \left({l}_c-{a}_c\right) $
: Individuals who live longer can reap the benefits of the risk reducing intervention for more years and thus have a larger WTP for the intervention. VSL is also increasing in income $ {y}_c $
. First, the numerator increases in income as, by assumption, better living standards increase well-being, i.e.
$ {y}_c $
. First, the numerator increases in income as, by assumption, better living standards increase well-being, i.e. $ {u}^{\prime}\left({y}_c\right)>0 $
. Second, the denominator decreases in income since the marginal value of money decreases in income, i.e.
$ {u}^{\prime}\left({y}_c\right)>0 $
. Second, the denominator decreases in income since the marginal value of money decreases in income, i.e. $ {u}^{\prime \prime}\left({y}_c\right)<0 $
. This leads to the contentious result that higher-income individuals attach larger value to a given health benefit than lower-income individuals because they have a larger ability to pay than their lower-income counterpart.
$ {u}^{\prime \prime}\left({y}_c\right)<0 $
. This leads to the contentious result that higher-income individuals attach larger value to a given health benefit than lower-income individuals because they have a larger ability to pay than their lower-income counterpart.
Suppose that the pandemic causes the death of $ {D}_c $
people in country
$ {D}_c $
people in country $ c $
, thereby reducing the survival probability of the representative individual by
$ c $
, thereby reducing the survival probability of the representative individual by $ {d}_c=\frac{D_c}{N_c} $
. In addition, the pandemic reduces country’s income by
$ {d}_c=\frac{D_c}{N_c} $
. In addition, the pandemic reduces country’s income by $ \Delta {Y}_c $
. Let
$ \Delta {Y}_c $
. Let $ \Delta {y}_c=\frac{\Delta {Y}_c}{N_c} $
be the per-capita income loss. Let us assume that only the income at age
$ \Delta {y}_c=\frac{\Delta {Y}_c}{N_c} $
be the per-capita income loss. Let us assume that only the income at age $ {a}_c $
is affected.Footnote 7 Expected lifetime utility with the pandemic is equal to:Footnote 8
$ {a}_c $
is affected.Footnote 7 Expected lifetime utility with the pandemic is equal to:Footnote 8
 $$ {V}_c^P=\left({p}_c-{d}_c\right)\;{l}_cu\left({y}_c\right)+\left(1-{p}_c+{d}_c\right){a}_cu\left({y}_c\right)-u\left({y}_c\right)+u\left({y}_c-\Delta {y}_c\right) $$
The individual’s WTP at age $ {a}_c $
to avoid the pandemic impacts is the amount of money
$ {a}_c $
to avoid the pandemic impacts is the amount of money $ x $
such that the individual is indifferent between suffering the pandemic impacts and not suffering the pandemic impacts but paying
$ x $
such that the individual is indifferent between suffering the pandemic impacts and not suffering the pandemic impacts but paying $ x $
. Expected lifetime utility in the latter is equal to:
$ x $
. Expected lifetime utility in the latter is equal to: $ {V}_c^{NP}(x)={p}_c{l}_cu\left({y}_c\right)+\left(1-{p}_c\right){a}_cu\left({y}_c\right)-u\left({y}_c\right)+u\left({y}_c-x\right) $
. The individual’s WTP
$ {V}_c^{NP}(x)={p}_c{l}_cu\left({y}_c\right)+\left(1-{p}_c\right){a}_cu\left({y}_c\right)-u\left({y}_c\right)+u\left({y}_c-x\right) $
. The individual’s WTP $ x $
is determined by solving
$ x $
is determined by solving $ {V}_c^{NP}(x)-{V}_c^P=0 $
and it is approximately equal to:Footnote 9
$ {V}_c^{NP}(x)-{V}_c^P=0 $
and it is approximately equal to:Footnote 9
 $$ {d}_c\frac{\left({l}_c-{a}_c\right)u\left({y}_c\right)}{u^{\prime}\left({y}_c\right)}+\Delta {y}_c={d}_c VS{L}_c+\Delta {y}_c $$
The value in (3) represents the individual monetary equivalent of the pandemic burden for people living in country $ c $
.
$ c $
.
3.2. Benefit–cost analysis
BCA determines the social value of preventing the pandemic by summing individuals’ WTP to avoid the pandemic impacts. Given (3), the BCA value is given by:
 $$ Valu{e}^{BCA}={\sum}_c{N}_c\left({d}_c VS{L}_c+\Delta {y}_c\right) $$
BCA is unconcerned with the distribution of WTP in the population. Health and economic impacts experienced by low-income countries have the same moral importance as impacts experienced by high-income countries, where impacts are measured by individuals’ WTP. Let us consider a pandemic preparedness intervention that costs $ \$X $
. Such an intervention is expected to prevent a pandemic similar to the COVID-19 one. According to BCA, the global benefits of the intervention are equal to
$ \$X $
. Such an intervention is expected to prevent a pandemic similar to the COVID-19 one. According to BCA, the global benefits of the intervention are equal to $ {\sum}_c{N}_c\left({d}_c VS{L}_c+\Delta {y}_c\right) $
, and the intervention is beneficial as long as
$ {\sum}_c{N}_c\left({d}_c VS{L}_c+\Delta {y}_c\right) $
, and the intervention is beneficial as long as $ {\sum}_c{N}_c\left({d}_c VS{L}_c+\Delta {y}_c\right)-\$X\ge 0 $
.
$ {\sum}_c{N}_c\left({d}_c VS{L}_c+\Delta {y}_c\right)-\$X\ge 0 $
.
3.3. Utilitarian SWA
Let us now consider the value of prevention estimated through a utilitarian social welfare function. The utilitarian aggregation rule sums individuals’ lifetime well-being. Utilitarian welfare without the pandemic is equal to:
 $$ {W}_U^{NP}={\sum}_c{N}_c{V}_c^{NP}={\sum}_c{N}_c\left\{{p}_c{l}_cu\left({y}_c\right)+\left(1-{p}_c\right){a}_cu\left({y}_c\right)\right\} $$
Utilitarian welfare with the pandemic is equal to:
 $$ {W}_U^P={\sum}_c{N}_c{V}_c^P={\sum}_c{N}_c\left\{\left({p}_c-{d}_c\right)\;{l}_cu\left({y}_c\right)+\left(1-{p}_c+{d}_c\right){a}_cu\left({y}_c\right)-u\left({y}_c\right)+u\left({y}_c-\Delta {y}_c\right)\right\} $$
In welfare terms, the utilitarian value of preventing the pandemic is given by:
 $$ \Delta {W}_U={W}_U^{NP}-{W}_U^P={\sum}_c{N}_c\left\{{d}_c\left({l}_c-{a}_c\right)u\left({y}_c\right)+u\left({y}_c\right)-u\left({y}_c-\Delta {y}_c\right)\right\} $$
Taking a first-order approximation of $ \Delta {W}_U $
around
$ \Delta {W}_U $
around $ \Delta {y}_c=0 $
, the utilitarian value is equal to a weighted sum of individuals’ WTP, where the weight depends on the marginal utility of income:Footnote 10
$ \Delta {y}_c=0 $
, the utilitarian value is equal to a weighted sum of individuals’ WTP, where the weight depends on the marginal utility of income:Footnote 10
 $$ \Delta {W}_U\simeq {\sum}_c{N}_c{u}^{\prime}\left({y}_c\right)\left\{{d}_c VS{L}_c+\Delta {y}_c\right\} $$
Given the diminishing marginal utility of income assumption, the introduction of weights has two consequences compared to the BCA formula (4). First, income losses $ \Delta {y}_c $
in low-income countries are attached a larger moral weight than comparable losses in high-income countries. This is because the former reduces the well-being of low-income individuals more than the well-being of high-income individuals. Second, the well-being impact of reducing mortality in country
$ \Delta {y}_c $
in low-income countries are attached a larger moral weight than comparable losses in high-income countries. This is because the former reduces the well-being of low-income individuals more than the well-being of high-income individuals. Second, the well-being impact of reducing mortality in country $ c $
,
$ c $
, $ \left({l}_c-{a}_c\right)u\left({y}_c\right) $
, does not depend on individuals’ marginal value of money. Therefore, saving a life in high-income countries is not valued more than saving a similar life in lower-income countries only because the former has a larger ability to pay than the latter.Footnote 11
$ \left({l}_c-{a}_c\right)u\left({y}_c\right) $
, does not depend on individuals’ marginal value of money. Therefore, saving a life in high-income countries is not valued more than saving a similar life in lower-income countries only because the former has a larger ability to pay than the latter.Footnote 11
Expression (5) represents the utilitarian impact of the pandemic in welfare terms. To compare such a value with the cost of a hypothetical pandemic preparedness intervention, it is easier to transform the welfare value in monetary terms. This can be done by dividing the marginal utility of income $ {u}^{\prime}\left({y}_c\right) $
by the marginal utility of a benchmark income level. Note that the chosen normalization will have a first-order impact on the size of the estimated value: The larger the benchmark income, the lower the corresponding marginal utility, and the larger the utilitarian value of preventing a pandemic.Footnote 12
$ {u}^{\prime}\left({y}_c\right) $
by the marginal utility of a benchmark income level. Note that the chosen normalization will have a first-order impact on the size of the estimated value: The larger the benchmark income, the lower the corresponding marginal utility, and the larger the utilitarian value of preventing a pandemic.Footnote 12
To determine the benchmark income level for the normalization, I compute the maximum amount that the benevolent supranational decision-maker would be willing to request to the global population to finance an intervention that prevents the pandemic impacts.Footnote 13 Let $ X $
be such an amount, and let
$ X $
be such an amount, and let $ {\sigma}_c $
be the proportion paid by an individual in country
$ {\sigma}_c $
be the proportion paid by an individual in country $ c $
, with
$ c $
, with $ {\sum}_c{N}_c{\sigma}_c=1 $
. The societal WTP
$ {\sum}_c{N}_c{\sigma}_c=1 $
. The societal WTP $ X $
for the intervention represents the monetary equivalent of the utilitarian value of the intervention. The societal WTP
$ X $
for the intervention represents the monetary equivalent of the utilitarian value of the intervention. The societal WTP $ X $
is such that utilitarian welfare without the pandemic but with the investment
$ X $
is such that utilitarian welfare without the pandemic but with the investment $ X $
is equal to utilitarian welfare with the pandemic:
$ X $
is equal to utilitarian welfare with the pandemic:
 $$ \hskip-5em {\sum}_c{N}_c\left\{{p}_c{l}_cu\left({y}_c\right)+\left(1-{p}_c\right){a}_cu\left({y}_c\right)-u\left({y}_c\right)+u\left({y}_c-{\sigma}_cX\right)\right\} $$
 $$ \hskip10em ={\sum}_c{N}_c\left\{\left({p}_c-{d}_c\right){l}_cu\left({y}_c\right)+\left(1-{p}_c+{d}_c\right){a}_cu\left({y}_c\right)-u\left({y}_c\right)+u\left({y}_c-{\Delta y}_c\right)\right\} $$
Solving for $ X $
and taking a first-order approximation around
$ X $
and taking a first-order approximation around $ {\Delta y}_c=0 $
and
$ {\Delta y}_c=0 $
and $ X=0 $
, we get an expression for the monetary equivalent of the utilitarian benefits to prevent a pandemic:
$ X=0 $
, we get an expression for the monetary equivalent of the utilitarian benefits to prevent a pandemic:
 $$ Valu{e}^U\simeq {\sum}_c{N}_c\frac{u^{\mathrm{\prime}}({y}_c)}{\sum_c{N}_c{\sigma}_c{u}^{\mathrm{\prime}}({y}_c)}\{{d}_cVS{L}_c+\Delta {y}_c\} $$
The utilitarian weights are normalized by dividing them by the weighted sum of the marginal utilities of income. The weighted sum reflects the distribution of the intervention costs. In other words, the benchmark income $ \hat{y} $
for the normalization is such that
$ \hat{y} $
for the normalization is such that $ {\sum}_c{N}_c{\sigma}_c{u}^{\prime}\left({y}_c\right)=u^{\prime}\left(\hat{y}\right) $
. For example, if the costs of the pandemic preparedness intervention are equally distributed across the world population, then
$ {\sum}_c{N}_c{\sigma}_c{u}^{\prime}\left({y}_c\right)=u^{\prime}\left(\hat{y}\right) $
. For example, if the costs of the pandemic preparedness intervention are equally distributed across the world population, then $ {\sigma}_c=\frac{1}{N} $
, with
$ {\sigma}_c=\frac{1}{N} $
, with $ N={\sum}_c{N}_c $
. If the costs are distributed proportionally to income, then
$ N={\sum}_c{N}_c $
. If the costs are distributed proportionally to income, then $ {\sigma}_c=\frac{y_c}{\sum_c{N}_c{y}_c} $
. Note that the more regressive is the distribution of costs (i.e., the larger the proportion
$ {\sigma}_c=\frac{y_c}{\sum_c{N}_c{y}_c} $
. Note that the more regressive is the distribution of costs (i.e., the larger the proportion $ {\sigma}_c $
paid by individuals in low-income countries is), the higher is the denominator of (6), and the smaller is the corresponding utilitarian value of the intervention. Thus, compared to the BCA value (4), the utilitarian value depends not only on the distribution of pandemic impacts, but also on the distribution of the costs of the hypothetical intervention to prevent such a burden. Said differently, we cannot evaluate the benefits of preventing a pandemic without considering how the costs of the prevention policy are distributed. From a utilitarian point of view, preparing for a pandemic similar to COVID-19 is beneficial insofar as the intervention itself does not excessively harm low-income individuals. According to utilitarianism, an intervention that costs
$ {\sigma}_c $
paid by individuals in low-income countries is), the higher is the denominator of (6), and the smaller is the corresponding utilitarian value of the intervention. Thus, compared to the BCA value (4), the utilitarian value depends not only on the distribution of pandemic impacts, but also on the distribution of the costs of the hypothetical intervention to prevent such a burden. Said differently, we cannot evaluate the benefits of preventing a pandemic without considering how the costs of the prevention policy are distributed. From a utilitarian point of view, preparing for a pandemic similar to COVID-19 is beneficial insofar as the intervention itself does not excessively harm low-income individuals. According to utilitarianism, an intervention that costs $ \$X $
is beneficial as long as
$ \$X $
is beneficial as long as $ {\sum}_c{N}_c\frac{u^{\mathrm{\prime}}({y}_c)}{\sum_c{N}_c{\sigma}_c{u}^{\mathrm{\prime}}({y}_c)}\{{d}_cVS{L}_c+\Delta {y}_c\}-\$X\ge 0 $
.Footnote 14
$ {\sum}_c{N}_c\frac{u^{\mathrm{\prime}}({y}_c)}{\sum_c{N}_c{\sigma}_c{u}^{\mathrm{\prime}}({y}_c)}\{{d}_cVS{L}_c+\Delta {y}_c\}-\$X\ge 0 $
.Footnote 14
3.4. Prioritarian SWA
Prioritarianism is an ethical view that gives extra weight to the well-being of the worse off (Adler, Reference Adler, Adler and Norheim2022). Thus, according to the prioritarian perspective, well-being gains experienced by the worse off are morally more valuable than similar well-being gains experienced by the better off. The prioritarian social welfare is equal to the sum of a concave transformation of individuals’ well-being. If $ {w}_i $
is the well-being of individual
$ {w}_i $
is the well-being of individual $ i $
, the prioritarian social welfare is equal to
$ i $
, the prioritarian social welfare is equal to $ {W}_P={\sum}_ig\left({w}_i\right) $
, with
$ {W}_P={\sum}_ig\left({w}_i\right) $
, with $ {g}^{\prime \prime}\le 0 $
. The concavity of the function
$ {g}^{\prime \prime}\le 0 $
. The concavity of the function $ g $
represents social preferences for the distribution of well-being across the population. When
$ g $
represents social preferences for the distribution of well-being across the population. When $ {g}^{\prime \prime }=0 $
, we obtain the utilitarian social welfare function.
$ {g}^{\prime \prime }=0 $
, we obtain the utilitarian social welfare function.
In the presence of risk, there exist two different forms of prioritarianism. Ex ante prioritarianism is concerned with the distribution of expected well-being across the population. Generally speaking, from the ex ante point of view, priority is given to individuals who are facing the largest mortality risk. Ex post prioritarianism is concerned with the distribution of realized well-being across the population. Generally speaking, from the ex post point of view, priority is given to individuals who die prematurely. Ex ante prioritarianism violates stochastic dominance, and for that reason it is problematic (Adler, Reference Adler2019).Footnote 15 In this article, I focus on ex post prioritarianism. I will not investigate if the ex ante approach would lead to similar conclusions as those found in this article.
Let $ {N}_c\left(1-{p}_c\right) $
be the number of people that die at age
$ {N}_c\left(1-{p}_c\right) $
be the number of people that die at age $ {a}_c $
without the pandemic, and let
$ {a}_c $
without the pandemic, and let $ {N}_c{p}_c $
be the number of people that live a long life, with
$ {N}_c{p}_c $
be the number of people that live a long life, with $ {l}_c $
the typical longevity of individuals in country
$ {l}_c $
the typical longevity of individuals in country $ c $
. The people who die prematurely have a lifetime well-being equal to
$ c $
. The people who die prematurely have a lifetime well-being equal to $ {a}_cu\left({y}_c\right) $
, while the individuals who die at age
$ {a}_cu\left({y}_c\right) $
, while the individuals who die at age $ {l}_c $
have a lifetime well-being equal to
$ {l}_c $
have a lifetime well-being equal to $ {l}_cu\left({y}_c\right) $
. The prioritarian welfare in the absence of the pandemic is given by:
$ {l}_cu\left({y}_c\right) $
. The prioritarian welfare in the absence of the pandemic is given by:
 $$ {W}_P^{NP}={\sum}_c{N}_c\left\{\left(1-{p}_c\right)g\left({a}_cu\left({y}_c\right)\right)+{p}_cg\left({l}_cu\left({y}_c\right)\right)\right\} $$
The pandemic increases the number of people that die at age $ {a}_c $
and reduces the income enjoyed at age
$ {a}_c $
and reduces the income enjoyed at age $ {a}_c $
. The prioritarian welfare with the pandemic is equal to:
$ {a}_c $
. The prioritarian welfare with the pandemic is equal to:
 $$ {W}_P^P={\displaystyle \begin{array}{l}{\sum}_c{N}_c\Big\{\left(1-{p}_c+{d}_c\right)g\left({a}_cu\left({y}_c\right)-u\left({y}_c\right)+u\left({y}_c-\Delta {y}_c\right)\right)\\ {}+\hskip2px \left({p}_c-{d}_c\right)g\left({l}_cu\left({y}_c\right)-u\left({y}_c\right)+u\left({y}_c-\Delta {y}_c\right)\right)\Big\}\end{array}} $$
In welfare terms, the prioritarian value of preventing a pandemic is approximately equal to:Footnote 16
 $$ \Delta {W}^P\simeq {\sum}_c{N}_c{g}^{\prime}\left({l}_cu\left({y}_c\right)\right){u}^{\prime}\left({y}_c\right)\left[{d}_c VS{L}_c+\Delta {y}_c\right] $$
Expression (7) is derived by taking a first-order approximation of $ \Delta {W}^P={W}_{NP}^P-{W}_P^P $
around
$ \Delta {W}^P={W}_{NP}^P-{W}_P^P $
around $ \Delta {y}_c=0 $
and
$ \Delta {y}_c=0 $
and $ {d}_c=0 $
and assuming
$ {d}_c=0 $
and assuming $ {p}_c=1 $
for simplicity. According to (7), the prioritarian welfare burden of the pandemic is approximately equal to the weighted sum of individuals’ monetary equivalents, where the weights represent the moral importance attached to the impacts experienced by different people. The prioritarian weights have two components: the marginal utility of income,
$ {p}_c=1 $
for simplicity. According to (7), the prioritarian welfare burden of the pandemic is approximately equal to the weighted sum of individuals’ monetary equivalents, where the weights represent the moral importance attached to the impacts experienced by different people. The prioritarian weights have two components: the marginal utility of income, $ {u}^{\prime}\left({y}_c\right) $
, and the priority to the worse off in well-being terms,
$ {u}^{\prime}\left({y}_c\right) $
, and the priority to the worse off in well-being terms, $ {g}^{\prime}\left({l}_cu\left({y}_c\right)\right) $
. Thus, as in the utilitarian case, monetary losses borne by individuals in low-income countries are deemed morally more harmful than similar losses borne by individuals in high-income countries because the value of money decreases with income. Compared to the utilitarian case, lower-income countries get an extra weight on the grounds that they are worse off in well-being terms. Additionally, the prioritarian weight decreases in longevity
$ {g}^{\prime}\left({l}_cu\left({y}_c\right)\right) $
. Thus, as in the utilitarian case, monetary losses borne by individuals in low-income countries are deemed morally more harmful than similar losses borne by individuals in high-income countries because the value of money decreases with income. Compared to the utilitarian case, lower-income countries get an extra weight on the grounds that they are worse off in well-being terms. Additionally, the prioritarian weight decreases in longevity $ {l}_c $
: Individuals who die young are deemed worse-off than individuals who live a long life. Thus, the prioritarian framework captures the “fair innings” principle according to which it is fairer to save a young life than an older one on the grounds that the latter had a better chance to a full life (Harris, Reference Harris1985).
$ {l}_c $
: Individuals who die young are deemed worse-off than individuals who live a long life. Thus, the prioritarian framework captures the “fair innings” principle according to which it is fairer to save a young life than an older one on the grounds that the latter had a better chance to a full life (Harris, Reference Harris1985).
To obtain the monetary equivalent of the prioritarian value (7), I follow the same methodology as in the utilitarian case and derive the societal maximum WTP $ X $
for avoiding the pandemic impacts. Assuming that each individual in country
$ X $
for avoiding the pandemic impacts. Assuming that each individual in country $ c $
bears a share
$ c $
bears a share $ {\sigma}_c $
of the cost of the pandemic preparedness intervention, the societal maximum WTP is such that the prioritarian welfare with no pandemic and the intervention
$ {\sigma}_c $
of the cost of the pandemic preparedness intervention, the societal maximum WTP is such that the prioritarian welfare with no pandemic and the intervention $ X $
is equal to the prioritarian welfare with the pandemic. In the approximation, the prioritarian pandemic value of a prevention policy is equal to:
$ X $
is equal to the prioritarian welfare with the pandemic. In the approximation, the prioritarian pandemic value of a prevention policy is equal to:
 $$ Valu{e}^P\simeq {\sum}_c{N}_c\frac{g^{\prime}\left({l}_cu\left({y}_c\right)\right){u}^{\prime}\left({y}_c\right)}{\sum_c{N}_c{g}^{\prime}\left({l}_cu\left({y}_c\right)\right){u}^{\prime}\left({y}_c\right){\sigma}_c}\left\{{d}_c VS{L}_c+\Delta {y}_c\right\} $$
The prioritarian weights are normalized by dividing them by the weighted sum of the marginal welfare of income. The weighted sum reflects the distribution of the intervention costs. In other words, the benchmark income $ \hat{y} $
for the normalization is such that
$ \hat{y} $
for the normalization is such that $ {\sum}_c{N}_c{g}^{\prime}\left({l}_cu\left({y}_c\right)\right){\sigma}_c{u}^{\prime}\left({y}_c\right)={g}^{\prime}\left(\hat{l}u\left(\hat{y}\right)\right)u^{\prime}\left(\hat{y}\right) $
, where
$ {\sum}_c{N}_c{g}^{\prime}\left({l}_cu\left({y}_c\right)\right){\sigma}_c{u}^{\prime}\left({y}_c\right)={g}^{\prime}\left(\hat{l}u\left(\hat{y}\right)\right)u^{\prime}\left(\hat{y}\right) $
, where $ \hat{l} $
is the life expectancy of the individual with benchmark income
$ \hat{l} $
is the life expectancy of the individual with benchmark income $ \hat{y} $
. As in the utilitarian case, the more the costs of the hypothetical intervention are paid by low-income countries, the smaller the value of the pandemic prevention policy is. Therefore, from the prioritarian perspective, an intervention that costs
$ \hat{y} $
. As in the utilitarian case, the more the costs of the hypothetical intervention are paid by low-income countries, the smaller the value of the pandemic prevention policy is. Therefore, from the prioritarian perspective, an intervention that costs $ \$X $
is beneficial as long as
$ \$X $
is beneficial as long as $ {\sum}_c{N}_c\frac{g^{\mathrm{\prime}}({l}_cu({y}_c)){u}^{\mathrm{\prime}}({y}_c)}{\sum_c{N}_c{g}^{\mathrm{\prime}}({l}_cu({y}_c)){u}^{\mathrm{\prime}}({y}_c){\sigma}_c}\{{d}_cVS{L}_c+\Delta {y}_c\}-\$X\ge 0 $
.
$ {\sum}_c{N}_c\frac{g^{\mathrm{\prime}}({l}_cu({y}_c)){u}^{\mathrm{\prime}}({y}_c)}{\sum_c{N}_c{g}^{\mathrm{\prime}}({l}_cu({y}_c)){u}^{\mathrm{\prime}}({y}_c){\sigma}_c}\{{d}_cVS{L}_c+\Delta {y}_c\}-\$X\ge 0 $
.
4. The global value of pandemic prevention
The section provides estimates of the value of preventing a COVID-19-like pandemic for different countries in the world and for the world as a whole. Pandemic impacts include GDP losses and COVID-19 deaths. I present three different estimates of the value of pandemic prevention. First, I use a conventional BCA approach (4). The value of prevention is equal to the sum of the GDP loss and the monetary equivalent of the deaths recorded in a country. The value of saving a life is equal to income-adjusted VSLs. Then, I compute the utilitarian value using expression (6) and the prioritarian value using expression (8).
4.1. Data
I combine different data sources. Population data by age and mortality rates by age in the non-pandemic scenario are derived from the 2022 UN World Population Prospects (United Nations, 2022). In particular, the dataset includes life tables for all countries and estimates of the proportion of individuals in a given birth cohort who die at different ages. I use those data to derive population-average longevity $ {l}_c $
for different countries.Footnote 17 GDP data are taken from the World Bank dataset (World Bank, 2023). I consider purchasing power parity GDP per capita in constant 2017 international $.
$ {l}_c $
for different countries.Footnote 17 GDP data are taken from the World Bank dataset (World Bank, 2023). I consider purchasing power parity GDP per capita in constant 2017 international $.
For pandemic burdens, economic losses are given by the reduction in GDP experienced by countries during the pandemic. I consider only economic losses experienced in 2020 and 2021 to avoid any confounding with the war in Ukraine (started in February 2022). To project GDP per capita in the absence of the pandemic, I use growth projections from the International Monetary Fund published in October 2019 (IMF, 2019). Because of data constraints, I consider only COVID-19 deaths and neglect excess deaths from other causes during the pandemic. The total number of COVID-19 deaths by country is derived from Our World in Data (Mathieu et al., Reference Mathieu, Ritchie, Rodés-Guirao, Appel, Giattino, Hasell, Macdonald, Dattani, Beltekian, Ortiz-Ospina and Roser2020). I take the latest available figure for each country (August 1, 2023).
4.2. Calibration
In the BCA exercise, the country-specific VSL estimates are derived by adjusting the U.S. estimate for cross-country differences in income, as described in Robinson et al. (Reference Robinson, Hammitt and O’Keeffe2019).Footnote 18 I assume that the VSL for the United States is $10 million, which is approximately 160 times the projected GDP per capita in 2020 absent the pandemic. Assuming an income elasticity of 1 (i.e., the VSL to income ratio is constant across countries), I derive VSL estimates for the other countries based on their projected income in the non-pandemic scenario.Footnote 19
To calibrate expressions (6) and (8), I assume that the period utility has an isoelastic form, $ u=\frac{y_c^{1-\eta }-{\overline{y}}^{1-\eta }}{1-\eta } $
for
$ u=\frac{y_c^{1-\eta }-{\overline{y}}^{1-\eta }}{1-\eta } $
for $ \eta \ne 1 $
and
$ \eta \ne 1 $
and $ u=\ln {y}_c $
for
$ u=\ln {y}_c $
for $ \eta =1 $
, where
$ \eta =1 $
, where $ \eta $
is the elasticity of the marginal utility of income and
$ \eta $
is the elasticity of the marginal utility of income and $ \overline{y} $
denotes the subsistence income level (i.e., the minimum income for a life worth living). Additionally, I assume that welfare is described by an Atkinson social welfare function of the form:
$ \overline{y} $
denotes the subsistence income level (i.e., the minimum income for a life worth living). Additionally, I assume that welfare is described by an Atkinson social welfare function of the form: $ {\sum}_i\frac{w_i^{1-\gamma }}{1-\gamma } $
, where
$ {\sum}_i\frac{w_i^{1-\gamma }}{1-\gamma } $
, where $ \gamma $
represents society’s aversion to inequality in well-being. The utilitarian case corresponds to
$ \gamma $
represents society’s aversion to inequality in well-being. The utilitarian case corresponds to $ \gamma =0 $
. If
$ \gamma =0 $
. If $ \gamma >0 $
, the social welfare function is prioritarian. If
$ \gamma >0 $
, the social welfare function is prioritarian. If $ \gamma \to \infty $
, we obtain an egalitarian welfare approach. Given these assumptions, the utilitarian weight is equal to
$ \gamma \to \infty $
, we obtain an egalitarian welfare approach. Given these assumptions, the utilitarian weight is equal to $ \frac{y_c^{-\eta }}{\sum_c{N}_c{y}_c^{-\eta }{\sigma}_c} $
, while the prioritarian weight is equal to
$ \frac{y_c^{-\eta }}{\sum_c{N}_c{y}_c^{-\eta }{\sigma}_c} $
, while the prioritarian weight is equal to $ \frac{l_c^{-\gamma }{\left({y}_c^{1-\eta }-{\overline{y}}^{1-\eta}\right)}^{-\gamma }{y}_c^{-\eta }}{\sum_c{N}_c{l}_c^{-\gamma }{\left({y}_c^{1-\eta }-{\overline{y}}^{1-\eta}\right)}^{-\gamma }{y}_c^{-\eta }{\sigma}_c} $
.Footnote 20
$ \frac{l_c^{-\gamma }{\left({y}_c^{1-\eta }-{\overline{y}}^{1-\eta}\right)}^{-\gamma }{y}_c^{-\eta }}{\sum_c{N}_c{l}_c^{-\gamma }{\left({y}_c^{1-\eta }-{\overline{y}}^{1-\eta}\right)}^{-\gamma }{y}_c^{-\eta }{\sigma}_c} $
.Footnote 20
Conservatively, I assume that the elasticity of the marginal utility of income is $ \eta = $
1.Footnote 21 The chosen value for the inequality aversion parameter
$ \eta = $
1.Footnote 21 The chosen value for the inequality aversion parameter $ \gamma $
reflects society’s ethical concerns for inequality and fairness. As a benchmark, I assume
$ \gamma $
reflects society’s ethical concerns for inequality and fairness. As a benchmark, I assume $ \gamma =1 $
and test different values in sensitivity analyses.Footnote 22 Finally, to compute the weights, I assume that
$ \gamma =1 $
and test different values in sensitivity analyses.Footnote 22 Finally, to compute the weights, I assume that $ {\sigma}_c=\frac{y_c}{\sum_c{N}_c{y}_c} $
. As a consequence, the cost of the hypothetical intervention is distributed across countries proportionally to their income. Assuming proportionality implies that the intervention is not going to affect the relative inequality in the global distribution of income. Weights are estimated with respect to the pre-pandemic income (i.e., 2019 GDP).
$ {\sigma}_c=\frac{y_c}{\sum_c{N}_c{y}_c} $
. As a consequence, the cost of the hypothetical intervention is distributed across countries proportionally to their income. Assuming proportionality implies that the intervention is not going to affect the relative inequality in the global distribution of income. Weights are estimated with respect to the pre-pandemic income (i.e., 2019 GDP).
4.3. Results
Table 1 reports the number of official COVID-19 deaths and the estimated per capita GDP loss for each country with available data. The last three columns in Table 1 summarize the main results of this article. The fourth column reports the BCA value of preventing the COVID-19 pandemic that is derived using country-specific VSL estimates; the fifth column reports the utilitarian value and the last column reports the value computed with a prioritarian welfare function. The row titled “World” summarizes the global economic and health losses of COVID-19 and the global value of preventing a COVID-19-like pandemic.
Table 1. Burden of the pandemic around the world and the value of prevention
Notes: The “Baseline” scenario assumes $ \eta =1 $
,
$ \eta =1 $
, $ \gamma =1 $
, and
$ \gamma =1 $
, and $ {\sigma}_c=\frac{y_c}{\sum_c{N}_c{y}_c} $
(the costs of the intervention are distributed proportionally to income). The $ values are rounded to the nearest tenth (GDP loss) or nearest hundredth (value of prevention per-capita).
$ {\sigma}_c=\frac{y_c}{\sum_c{N}_c{y}_c} $
(the costs of the intervention are distributed proportionally to income). The $ values are rounded to the nearest tenth (GDP loss) or nearest hundredth (value of prevention per-capita).
In absolute terms, the countries with the largest number of recorded COVID-19 deaths are the United States (1.13 million deaths), Brazil (0.70 million deaths) and India (0.53 million deaths). In per-capita terms, the largest cumulative death rate has been experienced in Peru (650 deaths per 100,000 people). The number of official COVID-19 death rates tends to be larger in higher-income countries than in lower-income countries, but there is a lot of variation within country-income groups (Figure 1a). This reflects, among other factors, the older age structure of the population in higher-income countries.
Figure 1. Correlation between pandemic outcomes and 2019 Gross Domestic Product (GDP) per capita.
Notes: In both figures, the x-axis displays the natural logarithm of GDP per capita in 2019 (PPP, constant 2017 international $). In (a), the y-axis represents the number of official COVID-19 deaths per 100,000 people. In (b), the y-axis represents the total GDP loss over the period 2020–2021 as a percentage of 2019 GDP. Each dot represents a country. In (b), two observations were dropped to ease the readability of the graph: Guyana (GDP loss = −102% of 2019 GDP) and Timor-Leste (GDP loss = −49% of 2019 GDP). Countries are divided into income groups based on the 2023 World Bank classification (HI, high-income countries; LI, low-income countries, LMI, lower-middle-income countries, UMI, upper-middle-income countries). Country acronyms: AFG, Afghanistan; BGR, Bulgaria; CPV, Cabo Verde; HUN, Hungary; IRL, Ireland; MDV, Maldives; PAN, Panama; PER, Peru; USA, United States.
Total GDP loss was largest in India ($2.5 trillion), United States ($1.7 trillion), and China ($1.2 trillion). In per-capita terms, the largest GDP loss occurred in Panama ($14,000). As a percentage of GDP, the largest loss was registered in the Maldives (62% of 2019 GDP) (Figure 1b). In comparison, the GDP loss experienced in the United States amounted to $5,000 per capita, or 8% of 2019 GDP. Note that GDP loss is estimated compared to IMF growth projections made before the pandemic and they depend on the accuracy of those projections. For example, some countries grew more during the pandemic than what was earlier projected (e.g., Ireland). The estimated GDP loss thus results to be negative. From the adopted data, it is impossible to disentangle whether the growth occurred because of the pandemic or despite the pandemic (e.g., because of bias in the projections or because of local conditions). Likewise, for countries with a positive GDP loss, this loss has to be intended with respect to what was projected in 2019, and it might well underestimate or overestimate the pandemic loss. Additionally, the total estimated GDP loss sums yearly losses. Many countries started the recovery process in 2021 once vaccines became available. The total loss thus may underestimate the economic burden felt in 2020, as well as overestimate the one experienced in 2021.
The global value of preventing a COVID-19-like pandemic amounts to $48 trillion (or about $6,200 per capita) when we evaluate mortality risks using country-specific VSL estimates. Such a measure is sensitive to country-differences in economic conditions. For example, the value of pandemic prevention in the United States is estimated at $13 trillion ($38,400 per capita). This corresponds to 27% of the global value even though only 16% of global deaths and 12% of the global GDP loss were experienced in the country. In contrast, the value of pandemic prevention in India amounts to $3 trillion ($2,200 per capita), or 6% of the global value, even though the country registered 8% of the global number of deaths and 17% of the global GDP loss. Had the mortality burden in India been evaluated at the United States VSL, the total value of prevention in India would have increased to $8 trillion.
Both the utilitarian and the prioritarian values of pandemic prevention are smaller than the one derived using conventional BCA methods. In the utilitarian case, the value of prevention amounts to $4,900 per capita (or $16 trillion), while it equals $4,800 per capita in the prioritarian case. There are two reasons behind this result. The first reason concerns the distribution of the costs of the hypothetical intervention. Standard BCA is indifferent to the distribution of costs: A policy paid by rich individuals has exactly the same net benefits as an identical policy (in terms of total costs and total benefits) that is paid by poor individuals. In contrast, with a distribution-sensitive welfare framework, the distribution of costs matters. The more the costs of the hypothetical intervention are borne by poor countries, the lower is the net social value of the intervention. The proportional-cost rule assumed in the exercise implies that the hypothetical intervention has no impact on relative income inequality. Yet, the mere fact that low-income countries would pay some of the costs tends to reduce the overall value of pandemic prevention.
The second reason concerns the distribution of the pandemic impacts. Both the utilitarian and the prioritarian approaches attach more weight to losses experienced in lower-income countries than comparable losses borne in higher-income countries. Therefore, compared to BCA, both utilitarianism and prioritarianism reduce the value of prevention in high-income countries and increase the value of prevention in low-income countries. For example, from a utilitarian point of view, the benefits of prevention in the U.S. amount to $10,300 per capita, almost a fourth of the BCA estimate ($38,400 per capita). In contrast, the utilitarian benefits of prevention in India are equal to $5,600 per capita, while the BCA estimate amounts to $2,200 per capita. The largest utilitarian value of pandemic prevention is recorded in Peru ($21,500 per capita), the country with the largest death rate. Since COVID-19 mortality and income loss tend to be larger in higher-income countries than in lower-income countries, the utilitarian and prioritarian adjustments both reduce the overall value of pandemic prevention compared to standard BCA. Had the pandemic impacts been more regressive (with larger deaths and income losses in lower-income countries than higher-income countries), then utilitarianism and prioritarianism would increase the overall value of prevention compared to BCA.
In this specific example, there is little difference between the utilitarian and the prioritarian overall value of pandemic prevention. Compared to utilitarianism, prioritarianism tends to attach even more weight to losses experienced in lower income countries on the grounds that individuals living in low-income countries are worst-off in well-being terms. The low well-being ranking is due to both low income and low average longevity. Given the proportional-cost rule and the larger health and economic impacts of the pandemic in higher-income countries, a concern for the worst-off tends to further decrease the prioritarian value of pandemic prevention compared to utilitarianism.
Thus, utilitarianism and prioritarianism both favor policies that reduce inequality across individuals. The utilitarian framework is concerned with inequality in income due to the decreasing marginal utility of income assumption. The prioritarian framework is concerned with inequality in well-being, which, in turn, is affected by inequality in income and inequality in health (here proxied by longevity). The larger the reduction in (income or well-being) inequality brought about by the policy, the larger the value of preventing a pandemic. Given that, in the example, everyone contributes to the policy costs but high-income countries benefit the most from the policy, the prioritarian value is lower than the utilitarian one, which, in turn, is lower than the BCA value. Note that this ranking is driven by the specific assumptions about the distribution of pandemic impacts and policy costs and it will not hold in general.
4.4. Sensitivity analysis
Table 2 summarizes the results of sensitivity analyses around some of the main parameters. The first row reports the value of pandemic prevention in the baseline scenario as described in Table 1. Both the utilitarian and the prioritarian values decrease if the elasticity $ \eta $
of the marginal utility of income increases. In that case, an even larger weight is associated with monetary losses borne by low-income countries. Since the COVID-19 mortality losses tend to be larger in high-income countries than lower-income countries, increasing the elasticity
$ \eta $
of the marginal utility of income increases. In that case, an even larger weight is associated with monetary losses borne by low-income countries. Since the COVID-19 mortality losses tend to be larger in high-income countries than lower-income countries, increasing the elasticity $ \eta $
has the overall effect of reducing the value of avoiding a pandemic similar to the COVID-19 one. An increase in the inequality aversion parameter
$ \eta $
has the overall effect of reducing the value of avoiding a pandemic similar to the COVID-19 one. An increase in the inequality aversion parameter $ \gamma $
leads to similar results. The prioritarian benefits of pandemic prevention decrease since a large part of the benefits accrue to the better off in well-being terms.
$ \gamma $
leads to similar results. The prioritarian benefits of pandemic prevention decrease since a large part of the benefits accrue to the better off in well-being terms.
Table 2. The global per-capita value of pandemic prevention under different scenarios
Notes: The “Baseline” scenario assumes $ \eta =1 $
,
$ \eta =1 $
, $ \gamma =1 $
and
$ \gamma =1 $
and $ {\sigma}_c=\frac{y_c}{\sum_c{N}_c{y}_c} $
(the costs of the intervention are distributed proportionally to income). Each of the sensitivity scenarios modify only one baseline assumption, while keeping the others unmodified. When
$ {\sigma}_c=\frac{y_c}{\sum_c{N}_c{y}_c} $
(the costs of the intervention are distributed proportionally to income). Each of the sensitivity scenarios modify only one baseline assumption, while keeping the others unmodified. When $ \eta =1.5 $
, the subsistence income is set at $365. In scenarios where only some countries pay the intervention (only high-income countries or only low- and middle-income countries), the intervention costs are equally divided among the contributing countries.
$ \eta =1.5 $
, the subsistence income is set at $365. In scenarios where only some countries pay the intervention (only high-income countries or only low- and middle-income countries), the intervention costs are equally divided among the contributing countries.
Changing the distribution $ {\sigma}_c $
of the costs of the intervention has dramatic effects on the utilitarian and prioritarian values. While the BCA value of pandemic prevention is unaffected by the distribution of costs, both the utilitarian and the prioritarian values steeply increase when the pandemic preparedness intervention is paid only by high-income countries, to the point of being larger than the BCA value. For example, the utilitarian value of prevention goes from $4,900 to $13,800. On the other hand, a more regressive distribution of the intervention costs (e.g., all individuals pay the same dollar amount or only lower-income countries pay for the intervention) decreases both the utilitarian and the prioritarian values of pandemic prevention. The utilitarian value of pandemic prevention is larger than the prioritarian one in all scenarios, except when costs are borne only by high-income countries. In this case, lower-income countries are benefitting from the policy without sustaining any cost, i.e. the policy produces net positive benefits to the most disadvantaged populations. Even though the pandemic impacts are skewed toward high-income countries, the policy is undoubtedly improving the well-being of the worst-off compared to the pandemic case. That explains why the prioritarian value is larger than the utilitarian one in this scenario.
$ {\sigma}_c $
of the costs of the intervention has dramatic effects on the utilitarian and prioritarian values. While the BCA value of pandemic prevention is unaffected by the distribution of costs, both the utilitarian and the prioritarian values steeply increase when the pandemic preparedness intervention is paid only by high-income countries, to the point of being larger than the BCA value. For example, the utilitarian value of prevention goes from $4,900 to $13,800. On the other hand, a more regressive distribution of the intervention costs (e.g., all individuals pay the same dollar amount or only lower-income countries pay for the intervention) decreases both the utilitarian and the prioritarian values of pandemic prevention. The utilitarian value of pandemic prevention is larger than the prioritarian one in all scenarios, except when costs are borne only by high-income countries. In this case, lower-income countries are benefitting from the policy without sustaining any cost, i.e. the policy produces net positive benefits to the most disadvantaged populations. Even though the pandemic impacts are skewed toward high-income countries, the policy is undoubtedly improving the well-being of the worst-off compared to the pandemic case. That explains why the prioritarian value is larger than the utilitarian one in this scenario.
The main policy implication of these results is that investing in pandemic preparedness is a good use of money when the investment is paid mostly by high-income countries. If lower income countries were asked to contribute significantly to the investment, then paying for pandemic preparedness may be more welfare-reducing than the pandemic itself.
The last row of Table 2 shows what would happen if we used different income elasticities of VSL for lower-income and higher-income countries, as recommended in Robinson et al. (Reference Robinson, Hammitt and O’Keeffe2019). In particular, the income elasticity of VSL is set at 1.5 for low- and middle-income countries and at 0.6 for high-income countries. The latter is based on a recent meta-regression analysis for the United States (Viscusi & Masterman, Reference Viscusi and Masterman2017). The overall value of preventing the pandemic decreases independently of the evaluation framework, but differences across frameworks persist.
5. Discussion and conclusions
In this article, I explore the differences between BCA and SWA in the evaluation of interventions that aim at preventing future pandemics similar to the COVID-19 one. I show that BCA and SWA lead to very different recommendations. BCA determines the burden of pandemics by summing up the individuals’ monetary equivalents of the pandemic impacts. This overall burden is then compared to the total cost of the intervention. Thus, BCA is indifferent to the distribution of both monetary benefits and monetary losses. As a result, pandemic preparedness interventions are ranked independently of who bear the costs of the interventions. Additionally, since VSL typically increases in income, interventions that prevent pandemic-related mortality in high-income countries tend to be ranked higher than interventions that prevent similar losses in lower-income countries. In contrast, both utilitarian and prioritarian welfare frameworks are sensitive to the distribution of monetary benefits and costs, and impacts experienced by high-income individuals are not valued more than similar impacts experienced by low-income individuals only because the former have a higher ability to pay than the latter. Moreover, considerations about the distribution of the costs of the intervention play a major role in the value assessment under a social welfare approach: The more regressive is the distribution of costs, the lower is the value of a given intervention. This implies that, from a welfare perspective, we cannot measure the burden of future pandemics and discuss policies to prevent such a burden without reflecting on who is going to pay for those policies. Cost-sharing issues affect, for example, the funding and development of novel vaccines, as well as the funding of financing mechanisms for enhancing pandemic preparedness in low- and middle-income countries.
The COVID-19 pandemic has sparked renewed interest in pandemic preparedness. A small literature has tackled the issue of how much countries should invest to prepare for future pandemics given potential competing uses of limited resources (e.g., Fan et al., Reference Fan, Jamison and Summers2018; Glennerster et al., Reference Glennerster, Snyder and Tan2023). BCA has been the go-to methodology. The main lesson from this article is that the BCA estimates may lead to welfare-reducing choices if the distribution of the intervention costs and of the associated benefits are not carefully accounted for – unless the intervention is accompanied by an appropriate redistribution mechanism that sufficiently reduces inequality in well-being. This article has focused on the estimate of the COVID-19 pandemic burden around the world. Those estimates are informative about the optimal investment in pandemic preparedness to prevent another pandemic similar to COVID-19. Of course, the framework can be extended to reflect about the optimal investment to prevent any type of pandemic.
The analysis has several limitations. First of all, due to data constraints, the application focuses exclusively on the direct mortality and income consequences of the COVID-19 pandemic. I also looked only at short-term economic costs. The estimates are thus quite conservative as I neglected the morbidity consequences of COVID-19, other types of health impacts (e.g., on mental health or non-COVID-19 mortality), as well as long-term health or income losses due to, e.g. long-COVID, educational setbacks, and poor access to healthcare. Additionally, there are not yet enough data to judge the inequality impacts of COVID-19 within different countries, e.g. whether, all things considered, the world’s very poorest have suffered the most or whether the pandemic had any effect on inequalities in longevity or income. Although there is ample evidence of inequality in impacts at both the national and international levels, household-level survey data to run individual-level comparisons are not yet consistently available.
The application is based on a simplified model of pandemic impacts. For example, I do not explicitly account for differences in the population age structure across countries. A more realistic model would consider a more refined age distribution of deaths across countries and the impact of COVID-19 on such a distribution, instead of assuming that people either live a full life or die prematurely at age $ {a}_c $
. I also excluded potential economic growth and age differences in income, as well as positive discounting. Presumably, positive discounting would reduce the benefits of saving lives, while positive income growth would increase them.
$ {a}_c $
. I also excluded potential economic growth and age differences in income, as well as positive discounting. Presumably, positive discounting would reduce the benefits of saving lives, while positive income growth would increase them.
Furthermore, I use approximated formulas to estimate the utilitarian and prioritarian burdens of the pandemic. Because of the simplified model, those approximated formulas have a clean and intuitive interpretation. The choice of using simple approximations is to make the comparison with BCA more straightforward. Had I estimated the welfare burden of the pandemic without the approximation, it would have been more difficult to determine whether the departure from BCA was due to the concern for equity or the reliance on non-marginal risks. Nevertheless, it is questionable whether the marginal risk assumption is appropriate in the case of pandemics (Robinson et al., Reference Robinson, Eber and Hammitt.2021), even though it has been widely used in the pandemic literature so far (e.g., Fan et al., Reference Fan, Jamison and Summers2018; Viscusi, Reference Viscusi2020; Glennerster et al., Reference Glennerster, Snyder and Tan2023). Future work could relax this assumption and investigate the sensitivity of economic evaluation to the chosen value framework. For example, Adler et al. (Reference Adler, Bradley, Ferranna, Fleurbaey, Hammitt, Turquier, Voorhoeve, Wilkinson and Savulescu2023) pursue this direction by estimating the value of lockdown policies in the United States through a distribution-sensitive welfare framework and without the adoption of the small risk assumption.
In measuring the well-being impacts of the pandemic, I relied on the assumption of homogeneous preferences. The homogeneous preference assumption simplifies the framework, but it neglects that individuals do have different preferences. A proper account of the well-being impacts of the pandemic should allow for the possibility that individuals have different opinions about what matters in life. For example, the willingness to take risks is often found to reduce with age (Dohmen et al., Reference Dohmen, Falk, Bart, Huffman and Sunde2017), and there seem to be consistent cross-country differences in preferences based on customs and social norms (Falk et al., Reference Falk, Becker, Dohmen, Enke, Huffman and Sunde2018). With a few exceptions (e.g., Boarini et al., Reference Boarini, Fleurbaey, Murtin and Schreyer2022), the homogeneity assumption is ubiquitous in the literature estimating differences in welfare across countries.
The choice of well-being measure plays a major role in the conceptualization of welfare and equitable distributions. This article has focused on the standard notion of von Neumann-Morgenstern utility as a measure of individual well-being, with lifetime utility being concave in income but linear in longevity. The results of this article have to be interpreted in reference to the chosen well-being measure. For example, I show that utilitarian weights do not depend on longevity, while prioritarian weights do. Other specifications of lifetime utility and other measures of well-being may lead to different results. In particular, it would be fruitful to explore whether the main results of this article are robust to the specific well-being measure adopted. Moreover, I focused exclusively on an ex post measure of well-being and welfare. Such an ex post approach presupposes that the policy maker cares about the distribution of realized well-being across the population. It would be interesting to investigate whether the global distribution of pandemic burdens is affected by the choice of welfare perspective.
Contrary to BCA, the estimation of the pandemic welfare impacts requires a larger amount of information. Indeed, we need data not only on the aggregate mortality, morbidity and economic losses due to the pandemic, but also on how those impacts are distributed across the population of interest and whether there is any correlation with pre-existing inequities in health, income or other attributes. The stylized model considered in this article was parsimonious in terms of data. More realistic applications will be more data intensive.
Although this article focuses on COVID-19 and the value of pandemic prevention, the issues discussed in this article are not unique to pandemic policies, but they apply to any intervention with unequal impacts across the population. It is often claimed that standard BCA is a methodology to identify the most efficient policy and that equity concerns should play no role in the process. However, the adoption of BCA principles implicitly entails a stance on equity: All individual monetary impacts have the same moral importance independently of who is experiencing the (positive or negative) impacts. SWA provides a valuable and flexible framework to identify policies that increase overall well-being and promote its fair distribution. For this reason, this article argues that SWA should be routinely used in policy evaluation.
Acknowledgments
The author thanks the editor and the three reviewers for their valuable comments. This article builds on a 2022 conference held by the Brocher Foundation, “Healthy, Wealthy, and Wise – The Ethics of Health Valuation,” organized by Nir Eyal (Rutgers University), Samia Hurst (University of Geneva), Lisa A. Robinson (Harvard University) and Daniel Wikler (Harvard University). The author thanks the Brocher Foundation and conference participants for their support and helpful comments. This special issue was supported by the Brocher Foundation, with supplemental funding from the Rutgers University Center for Population-Level Bioethics; the University of Geneva Institute for Ethics, History, and the Humanities and the University of Bergen Centre for Ethics and Priority Setting. More information on the Brocher Foundation is available at: https://fondation-brocher.ch/.
Competing interest
The author declares none.


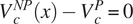


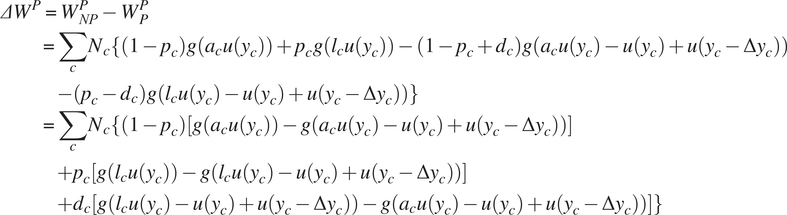


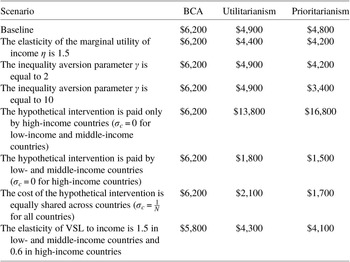

 Open access