1 Introduction
The year 2018 marks the 60th anniversary of Woltjer’s observation (Woltjer Reference Woltjer1958) that magnetic helicity in a tangent magnetic field is an invariant of ideal magnetohydrodynamics (MHD). That is, for a simply connected domain
![]() $\unicode[STIX]{x1D6FA}$
,
$\unicode[STIX]{x1D6FA}$
,
where
![]() $\boldsymbol{B}$
is the magnetic field,
$\boldsymbol{B}$
is the magnetic field,
![]() $\boldsymbol{A}$
is the vector potential of the magnetic field and
$\boldsymbol{A}$
is the vector potential of the magnetic field and
![]() $\boldsymbol{n}$
is the surface normal. This form of helicity is also gauge invariant in the sense that the transformation
$\boldsymbol{n}$
is the surface normal. This form of helicity is also gauge invariant in the sense that the transformation
![]() $\boldsymbol{A}\rightarrow \boldsymbol{A}+\unicode[STIX]{x1D735}\unicode[STIX]{x1D712}$
, for some scalar function
$\boldsymbol{A}\rightarrow \boldsymbol{A}+\unicode[STIX]{x1D735}\unicode[STIX]{x1D712}$
, for some scalar function
![]() $\unicode[STIX]{x1D712}$
, does not change the value of helicity. A few years later, Moffatt (Moffatt Reference Moffatt1969) discovered the topological connection of magnetic helicity to Gauss’ linking number. Thus, the subject of magnetic topology was born and has been influential in many areas of MHD ever since (e.g. Taylor Reference Taylor1974; Frisch et al.
Reference Frisch, Pouquet, Léorat and Mazure1975; Berger Reference Berger1984; Schindler, Hesse & Birn Reference Schindler, Hesse and Birn1988; Pevtsov, Canfield & Metcalf Reference Pevtsov, Canfield and Metcalf1995; DeVore Reference Devore2000; Russell et al.
Reference Russell, Yeates, Hornig and Wilmot-Smith2015). Some important examples of applications include the prediction of relaxed magnetic states in reverse pinch experiments (Taylor Reference Taylor1974) and the analysis of emerging solar active regions (e.g. Pevtsov et al.
Reference Pevtsov, Canfield and Metcalf1995; Démoulin et al.
Reference Démoulin, Mandrini, Van Driel-Gesztelyi, Lopez Fuentes and Aulanier2002; Leka, Fan & Barnes Reference Leka, Fan and Barnes2005; LaBonte, Georgoulis & Rust Reference LaBonte, Georgoulis and Rust2007). The first example we have given is an instance of magnetic topology applied to magnetic relaxation. Taylor (Reference Taylor1974) conjectured that (total) magnetic helicity is approximately conserved in a system with very small resistivity. Minimizing the magnetic energy whilst preserving the magnetic helicity, the relaxed state is predicted to be a linear force-free field. This simple and elegant theory has had good experimental corroboration and is one of the successes of the application of magnetic helicity.
$\unicode[STIX]{x1D712}$
, does not change the value of helicity. A few years later, Moffatt (Moffatt Reference Moffatt1969) discovered the topological connection of magnetic helicity to Gauss’ linking number. Thus, the subject of magnetic topology was born and has been influential in many areas of MHD ever since (e.g. Taylor Reference Taylor1974; Frisch et al.
Reference Frisch, Pouquet, Léorat and Mazure1975; Berger Reference Berger1984; Schindler, Hesse & Birn Reference Schindler, Hesse and Birn1988; Pevtsov, Canfield & Metcalf Reference Pevtsov, Canfield and Metcalf1995; DeVore Reference Devore2000; Russell et al.
Reference Russell, Yeates, Hornig and Wilmot-Smith2015). Some important examples of applications include the prediction of relaxed magnetic states in reverse pinch experiments (Taylor Reference Taylor1974) and the analysis of emerging solar active regions (e.g. Pevtsov et al.
Reference Pevtsov, Canfield and Metcalf1995; Démoulin et al.
Reference Démoulin, Mandrini, Van Driel-Gesztelyi, Lopez Fuentes and Aulanier2002; Leka, Fan & Barnes Reference Leka, Fan and Barnes2005; LaBonte, Georgoulis & Rust Reference LaBonte, Georgoulis and Rust2007). The first example we have given is an instance of magnetic topology applied to magnetic relaxation. Taylor (Reference Taylor1974) conjectured that (total) magnetic helicity is approximately conserved in a system with very small resistivity. Minimizing the magnetic energy whilst preserving the magnetic helicity, the relaxed state is predicted to be a linear force-free field. This simple and elegant theory has had good experimental corroboration and is one of the successes of the application of magnetic helicity.
The second application we gave, magnetic flux emergence, is the subject of this paper. ‘Bundles’ of magnetic field rise up through the solar convection zone until they reach the Sun’s surface, the photosphere. Here, the magnetic bundles emerge into the solar atmosphere where they can produce interesting phenomena such as flares and coronal mass ejections (e.g. Hood, Archontis & MacTaggart Reference Hood, Archontis and MacTaggart2012; Cheung & Isobe Reference Cheung and Isobe2014). Since we cannot observe magnetic fields in the solar atmosphere directly, we rely on indirect information about their structure. This is where magnetic helicity input can play an important role.
When observers study the magnetic fields of solar active regions, the photosphere acts as a lower boundary for the magnetic field. This fact introduces a complication in the original definition of magnetic helicity. It means that active region magnetic fields have a non-trivial normal boundary component at the photosphere and, hence, magnetic field lines which leave the domain. In such circumstances the helicity is no longer gauge invariant. We can bypass the above complication, however, by considering relative magnetic helicity (Berger & Field Reference Berger and Field1984) which provides a topological invariant for fields connected to a boundary. Magnetic helicity can, therefore, be used in the analysis of solar active regions, in particular as an indicator of eruptive activity (e.g. Yeates & Hornig Reference Yeates and Hornig2016; Guo et al. Reference Guo, Pariat, Valori, Anfinogentov, Chen, Georgoulis, Liu, Moraitis, Thalmann and Yang2017; Pariat et al. Reference Pariat, Leake, Valori, Linton, Zuccarello and Dalmasse2017).
Although some researchers study relative helicity in solar atmosphere (e.g. Valori, Démoulin & Pariat Reference Valori, Démoulin and Pariat2012; Yeates & Hornig Reference Yeates and Hornig2016; Guo et al. Reference Guo, Pariat, Valori, Anfinogentov, Chen, Georgoulis, Liu, Moraitis, Thalmann and Yang2017; Pariat et al. Reference Pariat, Leake, Valori, Linton, Zuccarello and Dalmasse2017), this quantity requires knowledge of the magnetic field’s full structure which is not observationally available. Observational studies instead measure the relative magnetic helicity flux through the photosphere (e.g. Chae Reference Chae2001; Kusano et al. Reference Kusano, Maeshiro, Yokoyama and Sakurai2002; Pevtsov, Maleev & Longcope Reference Pevtsov, Maleev and Longcope2003; Yokoyama et al. Reference Yokoyama, Kusano, Maeshiro and Sakurai2003; Pariat et al. Reference Pariat, Nindos, Démoulin and Berger2006; LaBonte et al. Reference LaBonte, Georgoulis and Rust2007; Schuck Reference Schuck2008; Vemareddy Reference Vemareddy2015). Photospheric maps of helicity flux during flux emergence can reveal interesting and complex patterns. Often, however, these results are interpreted based on a ‘standard model’ of flux emergence where the emerging magnetic field is a twisted flux tube just below the photosphere (e.g. Archontis & Török Reference Archontis and Török2008; MacTaggart & Hood Reference MacTaggart and Hood2009; Moreno-Insertis & Galsgaard Reference Moreno-Insertis and Galsgaard2013). Twist is an important part of helicity that, in flux emergence studies, leads to eruptive behaviour in the atmosphere. Observations of active region helicity input, however, imply that even bipolar regions, associated with single sign helicity flux rope/sheared arcade formation, can often input both signs of helicity (e.g. Leka & Skumanich Reference Leka and Skumanich1999; Pevtsov et al. Reference Pevtsov, Canfield, Sakurai and Hagino2008; Vemareddy Reference Vemareddy2015; Vemareddy & Démoulin Reference Vemareddy and Démoulin2017; Bi et al. Reference Bi, Ying, Yang, Xu and Ji2018). Modelling and interpreting the emergence of mixed helicity regions should be a priority in order to provide an understanding of their behaviour.
The purpose of this article is to show how (relative) magnetic helicity flux can be interpreted in solar flux emergence with a variety of emerging magnetic topologies. We first examine the ‘topological meaning’ of helicity flux in terms of winding (field line entanglement). We then study the magnetic helicity and winding fluxes in flux emergence simulations with different initial profiles of the magnetic field. The paper ends with a summary and a discussion.
2 Magnetic helicity flux
Consider an emerging magnetic field subject to ideal motion and two points
![]() $\boldsymbol{a}_{1}(t)$
and
$\boldsymbol{a}_{1}(t)$
and
![]() $\boldsymbol{a}_{2}(t)$
which represent the intersection of two field lines and the photospheric plane
$\boldsymbol{a}_{2}(t)$
which represent the intersection of two field lines and the photospheric plane
![]() $P$
. The motion of these points in time follows the motion of the points of intersection of these field lines in
$P$
. The motion of these points in time follows the motion of the points of intersection of these field lines in
![]() $P$
as the field emerges. The net rotation of these points within
$P$
as the field emerges. The net rotation of these points within
![]() $P$
as a function of time is
$P$
as a function of time is
where
![]() $\unicode[STIX]{x1D703}_{12}(\boldsymbol{a}_{1},\boldsymbol{a}_{2},t)$
is the angle of the line segment linking
$\unicode[STIX]{x1D703}_{12}(\boldsymbol{a}_{1},\boldsymbol{a}_{2},t)$
is the angle of the line segment linking
![]() $\boldsymbol{a}_{1}$
and
$\boldsymbol{a}_{1}$
and
![]() $\boldsymbol{a}_{2}$
. Equation (2.1) represents the entanglement of a pair of field lines due to emergence or in plane motions of the field lines, hence
$\boldsymbol{a}_{2}$
. Equation (2.1) represents the entanglement of a pair of field lines due to emergence or in plane motions of the field lines, hence
![]() $\text{d}c/\text{d}t$
represents the rate of input of entanglement through the photosphere and into solar atmosphere due to these field lines.
$\text{d}c/\text{d}t$
represents the rate of input of entanglement through the photosphere and into solar atmosphere due to these field lines.
In order to determine the time derivative of the angle
![]() $\unicode[STIX]{x1D703}_{12}$
, first note that
$\unicode[STIX]{x1D703}_{12}$
, first note that
Differentiating gives,
The (relative) magnetic helicity
![]() $H$
represents the total winding
$H$
represents the total winding
![]() $c(\boldsymbol{a}_{1},\boldsymbol{a}_{2},t)$
over all pairs of paths weighted by the photospheric flux over a given period of time (Berger Reference Berger1988; Démoulin & Berger Reference Démoulin and Berger2003). Thus, the rate of input of magnetic helicity into the solar atmosphere, through the photosphere
$c(\boldsymbol{a}_{1},\boldsymbol{a}_{2},t)$
over all pairs of paths weighted by the photospheric flux over a given period of time (Berger Reference Berger1988; Démoulin & Berger Reference Démoulin and Berger2003). Thus, the rate of input of magnetic helicity into the solar atmosphere, through the photosphere
![]() $P$
, is
$P$
, is
In order to use (2.4), we need to know how to track points
![]() $\boldsymbol{a}_{1}$
and
$\boldsymbol{a}_{1}$
and
![]() $\boldsymbol{a}_{2}$
. This motion is given by both in-plane motions and the projection due to motion out of the plane (flux emergence or submergence). If
$\boldsymbol{a}_{2}$
. This motion is given by both in-plane motions and the projection due to motion out of the plane (flux emergence or submergence). If
![]() $\boldsymbol{u}$
is the velocity field and
$\boldsymbol{u}$
is the velocity field and
![]() $\boldsymbol{u}_{\Vert }$
is the projection of
$\boldsymbol{u}_{\Vert }$
is the projection of
![]() $\boldsymbol{u}$
onto
$\boldsymbol{u}$
onto
![]() $P$
, it can be shown that
$P$
, it can be shown that
(e.g. Berger Reference Berger1988; Démoulin & Berger Reference Démoulin and Berger2003). The term
![]() $\boldsymbol{u}_{\Vert }$
accounts for the motions of the field lines within the plane. The term
$\boldsymbol{u}_{\Vert }$
accounts for the motions of the field lines within the plane. The term
![]() $u_{z}(\text{d}\boldsymbol{a}/\text{d}z)_{\Vert }$
accounts for the apparent motion within the plane due to the emergence (or submergence if
$u_{z}(\text{d}\boldsymbol{a}/\text{d}z)_{\Vert }$
accounts for the apparent motion within the plane due to the emergence (or submergence if
![]() $u_{z}<0$
) of field lines. The total derivative
$u_{z}<0$
) of field lines. The total derivative
![]() $\text{d}\boldsymbol{a}/\text{d}t$
assumes that the field lines are advected with the plasma (ideal motion).
$\text{d}\boldsymbol{a}/\text{d}t$
assumes that the field lines are advected with the plasma (ideal motion).
The helicity flux through
![]() $P$
represents the transmission of topological information into the atmosphere and can change in time. In magnetic relaxation, although magnetic helicity controls the final equilibrium, the path to that equilibrium can involve very complicated dynamics. Similarly in flux emergence, although magnetic helicity affects the overall evolution of the emerging field, the magnetic helicity flux is associated closely with the dynamics of emergence – the interplay of both plasma and magnetic field. For this reason, it is important to interpret carefully what maps of magnetic helicity flux mean.
$P$
represents the transmission of topological information into the atmosphere and can change in time. In magnetic relaxation, although magnetic helicity controls the final equilibrium, the path to that equilibrium can involve very complicated dynamics. Similarly in flux emergence, although magnetic helicity affects the overall evolution of the emerging field, the magnetic helicity flux is associated closely with the dynamics of emergence – the interplay of both plasma and magnetic field. For this reason, it is important to interpret carefully what maps of magnetic helicity flux mean.
A related quantity is the field line helicity input (e.g. Berger Reference Berger1988; Vemareddy Reference Vemareddy2015; Vemareddy & Démoulin Reference Vemareddy and Démoulin2017) which we define here as
Equation (2.6) describes the contribution to the helicity flux
![]() $\text{d}H/\text{d}t$
from a single point
$\text{d}H/\text{d}t$
from a single point
![]() $\boldsymbol{a}_{0}\in P$
(thus the contribution to helicity flux from a single field line). Although the integrand of (2.6) has a singularity at
$\boldsymbol{a}_{0}\in P$
(thus the contribution to helicity flux from a single field line). Although the integrand of (2.6) has a singularity at
![]() $\boldsymbol{a}_{0}$
, the integral still converges as the pole is of a lower order than the domain of integration. In the solar physics literature,
$\boldsymbol{a}_{0}$
, the integral still converges as the pole is of a lower order than the domain of integration. In the solar physics literature,
![]() $\text{d}{\mathcal{H}}(\boldsymbol{a}_{0})/\text{d}t$
is often labelled ‘
$\text{d}{\mathcal{H}}(\boldsymbol{a}_{0})/\text{d}t$
is often labelled ‘
![]() $G_{\unicode[STIX]{x1D703}}$
’ and is used as a proxy for helicity flux density (e.g. Pariat, Démoulin & Berger Reference Pariat, Démoulin and Berger2005).
$G_{\unicode[STIX]{x1D703}}$
’ and is used as a proxy for helicity flux density (e.g. Pariat, Démoulin & Berger Reference Pariat, Démoulin and Berger2005).
The contribution from a neighbourhood around the pole (call it
![]() $a_{0}^{\unicode[STIX]{x1D716}}$
) can be shown to be decomposed into the local twisting of the field around this point (which relates to the local electric current) and a contribution called the writhe, due to the geometry of the field line passing through
$a_{0}^{\unicode[STIX]{x1D716}}$
) can be shown to be decomposed into the local twisting of the field around this point (which relates to the local electric current) and a contribution called the writhe, due to the geometry of the field line passing through
![]() $\boldsymbol{a}_{0}$
(Călugăreanu Reference Călugăreanu1959, Reference Călugăreanu1961; White Reference White1969; Berger & Prior Reference Berger and Prior2006). Considering the contribution of the integral (2.6) from
$\boldsymbol{a}_{0}$
(Călugăreanu Reference Călugăreanu1959, Reference Călugăreanu1961; White Reference White1969; Berger & Prior Reference Berger and Prior2006). Considering the contribution of the integral (2.6) from
![]() $a_{0}^{\unicode[STIX]{x1D716}}$
, we can relate this to self-helicity as it measures the winding of the field in the locality of the field line passing through
$a_{0}^{\unicode[STIX]{x1D716}}$
, we can relate this to self-helicity as it measures the winding of the field in the locality of the field line passing through
![]() $\boldsymbol{a}_{0}$
. The contribution due to the rest of the field, on the set
$\boldsymbol{a}_{0}$
. The contribution due to the rest of the field, on the set
![]() $P-a_{0}^{\unicode[STIX]{x1D716}}$
, with this local neighbourhood is related to mutual helicity since the contribution represents the winding of the rest of the field with the small ‘flux tube’ in
$P-a_{0}^{\unicode[STIX]{x1D716}}$
, with this local neighbourhood is related to mutual helicity since the contribution represents the winding of the rest of the field with the small ‘flux tube’ in
![]() $a_{0}^{\unicode[STIX]{x1D716}}$
. This idea of decomposing the helicity into mutual and self-components has been used in numerous studies. Often it is the case that the field will have finite volume flux ropes, as in Pariat et al. (Reference Pariat, Nindos, Démoulin and Berger2006) and Guo et al. (Reference Guo, Pariat, Valori, Anfinogentov, Chen, Georgoulis, Liu, Moraitis, Thalmann and Yang2017), be the result of clear large scale shearing motion, as in Démoulin et al. (Reference Démoulin, Mandrini, Van Driel-Gesztelyi, Lopez Fuentes and Aulanier2002), or have regions of similar squashing factor, such as in Guo et al. (Reference Guo, Pariat, Valori, Anfinogentov, Chen, Georgoulis, Liu, Moraitis, Thalmann and Yang2017). In these cases it is possible to extend the notion of self-helicity to these finite bundles of field lines and gain further insight into the field’s morphology by tracking these self/mutual interactions. In this study, we will consider fields that exhibit highly complex local current structure and topology. Hence, a decomposition of the helicity into self and mutual components is not a simple task or necessarily well defined. Therefore, in this study, we do not pursue the self/mutual approach to describing helicity.
$a_{0}^{\unicode[STIX]{x1D716}}$
. This idea of decomposing the helicity into mutual and self-components has been used in numerous studies. Often it is the case that the field will have finite volume flux ropes, as in Pariat et al. (Reference Pariat, Nindos, Démoulin and Berger2006) and Guo et al. (Reference Guo, Pariat, Valori, Anfinogentov, Chen, Georgoulis, Liu, Moraitis, Thalmann and Yang2017), be the result of clear large scale shearing motion, as in Démoulin et al. (Reference Démoulin, Mandrini, Van Driel-Gesztelyi, Lopez Fuentes and Aulanier2002), or have regions of similar squashing factor, such as in Guo et al. (Reference Guo, Pariat, Valori, Anfinogentov, Chen, Georgoulis, Liu, Moraitis, Thalmann and Yang2017). In these cases it is possible to extend the notion of self-helicity to these finite bundles of field lines and gain further insight into the field’s morphology by tracking these self/mutual interactions. In this study, we will consider fields that exhibit highly complex local current structure and topology. Hence, a decomposition of the helicity into self and mutual components is not a simple task or necessarily well defined. Therefore, in this study, we do not pursue the self/mutual approach to describing helicity.
As a final note, before presenting our analysis, we add that Pariat et al. (Reference Pariat, Nindos, Démoulin and Berger2006) showed that it is possible to get spurious input values from (2.6) due to field structures with no helicity. This is not the case for the emergence/submergence events analysed here but is a possibility that should always be considered when looking at the distributions of this quantity (such spurious contributions vanish for the net input (2.4)).
2.1 Separating field strength and topological information
To disentangle the field strength (flux) and topological information associated with the helicity input, we can also consider the net winding input
where
 $$\begin{eqnarray}\unicode[STIX]{x1D70E}_{z}(\boldsymbol{x})=\left\{\begin{array}{@{}cc@{}}1 & \text{ if }B_{z}(\boldsymbol{x})>0,\\ -1 & \text{ if }B_{z}(\boldsymbol{x})<0,\\ 0 & \text{ if }B_{z}(\boldsymbol{x})=0,\end{array}\right.\end{eqnarray}$$
(e.g. Prior & Yeates Reference Prior and Yeates2014). The rate
![]() $\text{d}L/\text{d}t$
measures the input of field line entanglement through the photosphere and ignores the extra flux information provided by the helicity. A similar suggestion made in the literature is to divide the helicity input by the square of the flux (e.g. Yamamoto et al.
Reference Yamamoto, Kusano, Maeshiro, Yokoyama and Sakurai2005; LaBonte et al.
Reference LaBonte, Georgoulis and Rust2007; Vemareddy & Démoulin Reference Vemareddy and Démoulin2017). We propose that
$\text{d}L/\text{d}t$
measures the input of field line entanglement through the photosphere and ignores the extra flux information provided by the helicity. A similar suggestion made in the literature is to divide the helicity input by the square of the flux (e.g. Yamamoto et al.
Reference Yamamoto, Kusano, Maeshiro, Yokoyama and Sakurai2005; LaBonte et al.
Reference LaBonte, Georgoulis and Rust2007; Vemareddy & Démoulin Reference Vemareddy and Démoulin2017). We propose that
![]() $\text{d}L/\text{d}t$
is more meaningful in this context as it is based on a quantity, the net winding, which is also an ideal invariant (Prior & Yeates Reference Prior and Yeates2014). Indeed, it was shown recently to be more topologically meaningful than helicity as it can be used, under certain circumstances, to classify field topologies and hence precisely measure changing field connectivity (Prior & Yeates Reference Prior and Yeates2018).
$\text{d}L/\text{d}t$
is more meaningful in this context as it is based on a quantity, the net winding, which is also an ideal invariant (Prior & Yeates Reference Prior and Yeates2014). Indeed, it was shown recently to be more topologically meaningful than helicity as it can be used, under certain circumstances, to classify field topologies and hence precisely measure changing field connectivity (Prior & Yeates Reference Prior and Yeates2018).
2.2 Evolving photosphere
The standard practice in both theoretical and observational studies of helicity is to treat the lower (photospheric) boundary as fixed. In almost all studies, the photosphere is a plane (e.g. Pariat et al.
Reference Pariat, Démoulin and Berger2005, Reference Pariat, Nindos, Démoulin and Berger2006; Jeong & Chae Reference Jeong and Chae2007; Sturrock et al.
Reference Sturrock, Hood, Archontis and McNeill2015; Vemareddy Reference Vemareddy2015; Vemareddy & Démoulin Reference Vemareddy and Démoulin2017), although calculations in spherical geometry have also been performed (Berger Reference Berger1985; MacTaggart et al.
Reference MacTaggart, Gregory, Neukirch and Donati2016; Moratis et al.
Reference Moratis, Pariat, Savcheva and Valori2018). In our calculations, which we will describe shortly, our fixed photospheric plane
![]() $P$
will represent the fixed height
$P$
will represent the fixed height
![]() $z=0$
in a Cartesian domain.
$z=0$
in a Cartesian domain.
In addition to this approach, we also consider the effect of an evolving photosphere. Including this effect means that the lower boundary is no longer fixed but is a surface that deforms in space and time. In our calculations, we will define the photospheric boundary as the surface where the plasma density
![]() $\unicode[STIX]{x1D70C}$
has the non-dimensional value of 1. In order to evaluate how a changing photosphere will affect the helicity and winding fluxes, we use the following procedure. First, we calculate the varying surface on which
$\unicode[STIX]{x1D70C}$
has the non-dimensional value of 1. In order to evaluate how a changing photosphere will affect the helicity and winding fluxes, we use the following procedure. First, we calculate the varying surface on which
![]() $\unicode[STIX]{x1D70C}=1$
, i.e. the set
$\unicode[STIX]{x1D70C}=1$
, i.e. the set
![]() $P$
will always represent the horizontal plane at
$P$
will always represent the horizontal plane at
![]() $z=0$
in our model (more details will be given later). At
$z=0$
in our model (more details will be given later). At
![]() $t=0$
in the simulations,
$t=0$
in the simulations,
![]() $P_{v}\equiv P$
. As indicated,
$P_{v}\equiv P$
. As indicated,
![]() $P_{v}$
is a function of the coordinates
$P_{v}$
is a function of the coordinates
![]() $(x,y)$
of
$(x,y)$
of
![]() $P$
.
$P$
.
We then evaluate
![]() $\text{d}\boldsymbol{a}/\text{d}t$
at
$\text{d}\boldsymbol{a}/\text{d}t$
at
![]() $P_{v}(\boldsymbol{a},t)$
rather than at
$P_{v}(\boldsymbol{a},t)$
rather than at
![]() $P(\boldsymbol{a})$
. We can use this quantity to calculate an effective rotational derivative
$P(\boldsymbol{a})$
. We can use this quantity to calculate an effective rotational derivative
![]() $\text{d}\unicode[STIX]{x1D703}_{12}/\text{d}t$
using (2.3). To account for the surface geometry, we replace the area element
$\text{d}\unicode[STIX]{x1D703}_{12}/\text{d}t$
using (2.3). To account for the surface geometry, we replace the area element
![]() $\text{d}x_{1}\text{d}y_{1}$
with
$\text{d}x_{1}\text{d}y_{1}$
with
![]() $J(\boldsymbol{a}_{1})\text{d}x_{1}\text{d}y_{1}$
, where
$J(\boldsymbol{a}_{1})\text{d}x_{1}\text{d}y_{1}$
, where
![]() $J$
the Jacobian of the surface
$J$
the Jacobian of the surface
![]() $P_{v}$
at the coordinates of
$P_{v}$
at the coordinates of
![]() $\boldsymbol{a}_{1}$
(and similarly for
$\boldsymbol{a}_{1}$
(and similarly for
![]() $\boldsymbol{a}_{2}$
). For example, the calculation (2.7) will become
$\boldsymbol{a}_{2}$
). For example, the calculation (2.7) will become
 $$\begin{eqnarray}\displaystyle \frac{\text{d}L}{\text{d}t} & = & \displaystyle -\frac{1}{2\unicode[STIX]{x03C0}}\int _{P}\int _{P}\bigg[\unicode[STIX]{x1D70E}_{z}(P_{v}(\boldsymbol{a}_{1},t))\unicode[STIX]{x1D70E}_{z}(P_{v}(\boldsymbol{a}_{2},t))\frac{\text{d}\unicode[STIX]{x1D703}_{12}(P_{v}(\boldsymbol{a}_{1},t),P_{v}(\boldsymbol{a}_{2},t))}{\text{d}t}\nonumber\\ \displaystyle & & \displaystyle \,\times J(P_{v}(\boldsymbol{a}_{1},t))J(P_{v}(\boldsymbol{a}_{2},t))\bigg]\text{d}x_{1}\,\text{d}y_{1}\,\text{d}x_{2}\,\text{d}y_{2}.\end{eqnarray}$$
Equation (2.10) does not represent the exact winding flux through a spatially non-uniform surface. We could, for example, have made use of the differential form definition of relative helicity given in Chapter 3 of Arnold & Khesin (Reference Arnold and Khesin1999) in order to calculate the actual flux. However, we argue that what the above procedure represents is more akin to the effective projection of information onto the plane
![]() $P$
which occurs in the creation of magnetogram and vector magnetogram data (e.g. Démoulin & Pariat Reference Démoulin and Pariat2009; Scherrer et al.
Reference Scherrer, Schou, Bush, Kosovichev, Bogart, Hoeksema, Liu, Duvall, Zhao and Schrijver2012). These magnetogram data are obtained from line-of-sight information, Zeeman splitting and normal to line-of-sight linear polarization information. These data are effectively projected onto a plane
$P$
which occurs in the creation of magnetogram and vector magnetogram data (e.g. Démoulin & Pariat Reference Démoulin and Pariat2009; Scherrer et al.
Reference Scherrer, Schou, Bush, Kosovichev, Bogart, Hoeksema, Liu, Duvall, Zhao and Schrijver2012). These magnetogram data are obtained from line-of-sight information, Zeeman splitting and normal to line-of-sight linear polarization information. These data are effectively projected onto a plane
![]() $P$
. Since we are trying to gauge the consequences of an effect which is already uncertain (the interpretation of optical information) we feel the above approach is sensible first step. To the best of our knowledge, this is the first theoretical helicity study which has attempted to take account of a moving photosphere.
$P$
. Since we are trying to gauge the consequences of an effect which is already uncertain (the interpretation of optical information) we feel the above approach is sensible first step. To the best of our knowledge, this is the first theoretical helicity study which has attempted to take account of a moving photosphere.
3 Simulation set-up and initial conditions
In this study, we will consider small active regions of photospheric area
![]() ${\sim}75~\text{Mm}^{2}$
. Studying regions of this size is common in the flux emergence literature (Hood et al.
Reference Hood, Archontis and MacTaggart2012; Cheung & Isobe Reference Cheung and Isobe2014) and is justified on the grounds of achieving suitable spatial and temporal resolution. Of course, care must be taken when comparing the results of such studies to observations of regions of different sizes. Although qualitative behaviour may be found across spatial and temporal scales, quantitative information will be different.
${\sim}75~\text{Mm}^{2}$
. Studying regions of this size is common in the flux emergence literature (Hood et al.
Reference Hood, Archontis and MacTaggart2012; Cheung & Isobe Reference Cheung and Isobe2014) and is justified on the grounds of achieving suitable spatial and temporal resolution. Of course, care must be taken when comparing the results of such studies to observations of regions of different sizes. Although qualitative behaviour may be found across spatial and temporal scales, quantitative information will be different.
As our focus is on the dynamics of the magnetic field, we will consider an idealized description of the solar atmosphere. The bulk properties of the plasma and magnetic field dynamics are described by compressible MHD. The three-dimensional (3-D) resistive and compressible MHD equations are solved using a Lagrangian remap scheme (Arber et al. Reference Arber, Longbottom, Gerrard and Milne2001). In dimensionless form, the MHD equations are
with specific energy density
The basic variables are the density
![]() $\unicode[STIX]{x1D70C}$
, the pressure
$\unicode[STIX]{x1D70C}$
, the pressure
![]() $p$
, the magnetic induction
$p$
, the magnetic induction
![]() $\boldsymbol{B}$
(referred to as the magnetic field) and the velocity
$\boldsymbol{B}$
(referred to as the magnetic field) and the velocity
![]() $\boldsymbol{u}$
.
$\boldsymbol{u}$
.
![]() $\boldsymbol{j}$
is the electric current density,
$\boldsymbol{j}$
is the electric current density,
![]() $\boldsymbol{g}$
is the surface gravitational acceleration (uniform in the
$\boldsymbol{g}$
is the surface gravitational acceleration (uniform in the
![]() $z$
-direction) and
$z$
-direction) and
![]() $\unicode[STIX]{x1D6FE}=5/3$
is the ratio of specific heats. The dimensionless temperature
$\unicode[STIX]{x1D6FE}=5/3$
is the ratio of specific heats. The dimensionless temperature
![]() $T$
can be found from
$T$
can be found from
We make the variables dimensionless against photospheric values, a standard procedure in flux emergence studies (e.g. Hood et al.
Reference Hood, Archontis and MacTaggart2012, and references therein). We have pressure
![]() $p_{\mathit{ph}}=1.4\times 10^{4}$
Pa; density
$p_{\mathit{ph}}=1.4\times 10^{4}$
Pa; density
![]() $\unicode[STIX]{x1D70C}_{\mathit{ph}}=2\times 10^{-4}$
kg m
$\unicode[STIX]{x1D70C}_{\mathit{ph}}=2\times 10^{-4}$
kg m
![]() $^{-3}$
; scale height
$^{-3}$
; scale height
![]() $H_{\mathit{ph}}=170$
km; surface gravitational acceleration
$H_{\mathit{ph}}=170$
km; surface gravitational acceleration
![]() $g_{\mathit{ph}}=2.7\times 10^{2}$
m s
$g_{\mathit{ph}}=2.7\times 10^{2}$
m s
![]() $^{-2}$
; speed
$^{-2}$
; speed
![]() $u_{\text{ph}}=6.8$
km s
$u_{\text{ph}}=6.8$
km s
![]() $^{-1}$
; time
$^{-1}$
; time
![]() $t_{\mathit{ph}}=25$
s; magnetic field strength
$t_{\mathit{ph}}=25$
s; magnetic field strength
![]() $B_{\mathit{ph}}=1.3\times 10^{3}$
G and temperature
$B_{\mathit{ph}}=1.3\times 10^{3}$
G and temperature
![]() $T_{\mathit{ph}}=5.6\times 10^{3}$
K. In the non-dimensionalization of the temperature we use a gas constant
$T_{\mathit{ph}}=5.6\times 10^{3}$
K. In the non-dimensionalization of the temperature we use a gas constant
![]() ${\mathcal{R}}=8.3\times 10^{3}$
m
${\mathcal{R}}=8.3\times 10^{3}$
m
![]() $^{2}$
s
$^{2}$
s
![]() $^{-2}$
K
$^{-2}$
K
![]() $^{-1}$
and a mean molecular weight
$^{-1}$
and a mean molecular weight
![]() $\tilde{\unicode[STIX]{x1D707}}=1$
.
$\tilde{\unicode[STIX]{x1D707}}=1$
.
![]() $\unicode[STIX]{x1D702}$
is the resistivity and we take its value to be
$\unicode[STIX]{x1D702}$
is the resistivity and we take its value to be
![]() $10^{-3}$
. This value is close to the lowest physical resistivity that can be chosen before numerical resistivity dominates (see Arber, Haynes & Leake Reference Arber, Haynes and Leake2007; Leake, Linton & Török Reference Leake, Linton and Török2013). Note that in the simulations we present, reconnection plays a minor role. Thus, to a good approximation, the motion in the simulations can be considered to be ideal. The fluid viscosity tensor and the viscous contribution to the energy equation are respectively
$10^{-3}$
. This value is close to the lowest physical resistivity that can be chosen before numerical resistivity dominates (see Arber, Haynes & Leake Reference Arber, Haynes and Leake2007; Leake, Linton & Török Reference Leake, Linton and Török2013). Note that in the simulations we present, reconnection plays a minor role. Thus, to a good approximation, the motion in the simulations can be considered to be ideal. The fluid viscosity tensor and the viscous contribution to the energy equation are respectively
and
where
is the symmetric part of the rate of strain tensor and
![]() $\unicode[STIX]{x1D644}$
is the identity tensor. We take
$\unicode[STIX]{x1D644}$
is the identity tensor. We take
![]() $\unicode[STIX]{x1D707}=10^{-5}$
and use this form of viscosity primarily to aid stability. The code accurately resolves shocks by using a combination of shock viscosity (Wilkins Reference Wilkins1980) and Van Leer flux limiters (Van Leer Reference Van Leer1979), which add heating terms to the energy equation. Values will be expressed in non-dimensional form unless explicitly stated otherwise.
$\unicode[STIX]{x1D707}=10^{-5}$
and use this form of viscosity primarily to aid stability. The code accurately resolves shocks by using a combination of shock viscosity (Wilkins Reference Wilkins1980) and Van Leer flux limiters (Van Leer Reference Van Leer1979), which add heating terms to the energy equation. Values will be expressed in non-dimensional form unless explicitly stated otherwise.
The equations are solved in a Cartesian computational box of (non-dimensional) sizes
![]() $[-45,45]\times [-45,45]\times [-30,65]$
in the
$[-45,45]\times [-45,45]\times [-30,65]$
in the
![]() $x$
,
$x$
,
![]() $y$
and
$y$
and
![]() $z$
directions respectively. The boundary conditions are closed on the top and base of the box and periodic on the sides. Damping layers are included at the side and top boundaries to reduce the reflection/transmission of waves. The computational mesh contains 486
$z$
directions respectively. The boundary conditions are closed on the top and base of the box and periodic on the sides. Damping layers are included at the side and top boundaries to reduce the reflection/transmission of waves. The computational mesh contains 486
![]() $\times$
486
$\times$
486
![]() $\times$
729 points.
$\times$
729 points.
3.1 Initial background atmosphere and velocity perturbation
The idealized initial equilibrium atmosphere is given by prescribing the temperature profile
 $$\begin{eqnarray}T(z)=\left\{\begin{array}{@{}cc@{}}1-{\displaystyle \frac{\unicode[STIX]{x1D6FE}-1}{\unicode[STIX]{x1D6FE}}}z, & z<0,\\ 1, & 0\leqslant z\leqslant 10,\\ 150^{[(z-10)/10]}, & 10<z<20,\\ 150, & z\geqslant 20.\end{array}\right.\end{eqnarray}$$
Starting from the top of (3.11), the sections represent the solar interior, the photosphere/chromosphere, the transition region and the corona. The above model temperature profile is standard in many works on flux emergence (e.g. Murray et al. Reference Murray, Hood, Moreno-Insertis, Galsgaard and Archontis2006; Fan Reference Fan2009; Sturrock et al. Reference Sturrock, Hood, Archontis and McNeill2015). The above temperature profile is also used in Prior & MacTaggart (Reference Prior and MacTaggart2016).
The other state variables, pressure and density, are found by solving the hydrostatic equation in conjunction with the ideal equation of state
To study emergence, we must place a particular form for the magnetic field in the solar interior and apply a perturbation to allow it to emerge. In the following simulations, we will apply an initial velocity perturbation of the form
where we set the constants
![]() $u_{0}=0.05$
,
$u_{0}=0.05$
,
![]() $x_{0}=5$
,
$x_{0}=5$
,
![]() $y_{0}=3$
,
$y_{0}=3$
,
![]() $z_{0}=5$
,
$z_{0}=5$
,
![]() $\unicode[STIX]{x1D716}_{0}=2.5$
and
$\unicode[STIX]{x1D716}_{0}=2.5$
and
![]() $t_{0}=6$
;
$t_{0}=6$
;
![]() $R$
is the major radius of the tube and is described below. After
$R$
is the major radius of the tube and is described below. After
![]() $t=6$
the perturbation is switched off.
$t=6$
the perturbation is switched off.
We will consider two magnetic field models. The first model is a twisted toroidal tube that has been used in many other studies (e.g. MacTaggart & Hood Reference MacTaggart and Hood2009; MacTaggart & Haynes Reference MacTaggart and Haynes2014; MacTaggart et al. Reference MacTaggart, Guglielmino, Haynes, Simitev and Zuccarello2015; Sturrock et al. Reference Sturrock, Hood, Archontis and McNeill2015). The second model is a ‘mixed helicity’ field which has a complex topology but zero total helicity and will serve as a model for mixed helicity emergence. We now discuss the construction of such fields.
3.2 How to construct mixed helicity fields
The following represents a specific case of the general mathematical form of magnetic flux ropes with general field line topology, introduced in Prior & Yeates (Reference Prior and Yeates2016) and first applied to flux emergence in Prior & MacTaggart (Reference Prior and MacTaggart2016). We assume the flux rope has a toroidal shape with an axis curve
![]() $\boldsymbol{r}(s)$
parameterized by its arclength
$\boldsymbol{r}(s)$
parameterized by its arclength
![]() $s$
as
$s$
as
where
![]() $R$
is the major radius of the torus and
$R$
is the major radius of the torus and
![]() $z_{0}$
is the height of the rope’s anchoring footpoints at the base of the computational domain. This expression can be used to define a moving orthonormal frame
$z_{0}$
is the height of the rope’s anchoring footpoints at the base of the computational domain. This expression can be used to define a moving orthonormal frame
![]() $\{\boldsymbol{T},\boldsymbol{d}_{1},\boldsymbol{d}_{2}\}$
for
$\{\boldsymbol{T},\boldsymbol{d}_{1},\boldsymbol{d}_{2}\}$
for
![]() $\boldsymbol{r}(s)$
, which can, in turn, be used to define a tubular coordinate system through the map
$\boldsymbol{r}(s)$
, which can, in turn, be used to define a tubular coordinate system through the map
![]() $\boldsymbol{f}(s,x_{1},x_{2})$
, where
$\boldsymbol{f}(s,x_{1},x_{2})$
, where
From this mapping, we can find a set of basis vector fields
![]() $\{\frac{\unicode[STIX]{x2202}\boldsymbol{f}}{\unicode[STIX]{x2202}s},\frac{\unicode[STIX]{x2202}\boldsymbol{f}}{\unicode[STIX]{x2202}x_{1}},\frac{\unicode[STIX]{x2202}\boldsymbol{f}}{\unicode[STIX]{x2202}x_{2}}\}$
which can be used to define general vector fields in this toroidal coordinate system as
$\{\frac{\unicode[STIX]{x2202}\boldsymbol{f}}{\unicode[STIX]{x2202}s},\frac{\unicode[STIX]{x2202}\boldsymbol{f}}{\unicode[STIX]{x2202}x_{1}},\frac{\unicode[STIX]{x2202}\boldsymbol{f}}{\unicode[STIX]{x2202}x_{2}}\}$
which can be used to define general vector fields in this toroidal coordinate system as
For such fields to be divergence free the following condition must hold
where
![]() $J=(R-x_{1})/R$
is the Jacobian of the map
$J=(R-x_{1})/R$
is the Jacobian of the map
![]() $\boldsymbol{f}$
. It follows that a magnetic field defined in a cylinder can be transferred to a torus simply by dividing the components by
$\boldsymbol{f}$
. It follows that a magnetic field defined in a cylinder can be transferred to a torus simply by dividing the components by
![]() $J$
. In particular, we take the mixed helicity (braided) field used in numerous studies (e.g. Wilmot-Smith, Pontin & Hornig Reference Wilmot-Smith, Pontin and Hornig2010; Wilmot-Smith et al.
Reference Wilmot-Smith, Pontin, Yeates and Hornig2011; Pontin & Hornig Reference Pontin and Hornig2015), which is composed of a series of overlapping counter-twists. The magnetic field has no helicity (the average total entanglement) but subsets of its field lines are braided. In our toroidal coordinate system this field is composed of exponential twists
$J$
. In particular, we take the mixed helicity (braided) field used in numerous studies (e.g. Wilmot-Smith, Pontin & Hornig Reference Wilmot-Smith, Pontin and Hornig2010; Wilmot-Smith et al.
Reference Wilmot-Smith, Pontin, Yeates and Hornig2011; Pontin & Hornig Reference Pontin and Hornig2015), which is composed of a series of overlapping counter-twists. The magnetic field has no helicity (the average total entanglement) but subsets of its field lines are braided. In our toroidal coordinate system this field is composed of exponential twists
![]() $\boldsymbol{B}_{t}(b_{0},k,a,l,x_{1c},x_{2c},s_{c})$
given by
$\boldsymbol{B}_{t}(b_{0},k,a,l,x_{1c},x_{2c},s_{c})$
given by
where the parameter
![]() $b_{0}$
determines the strength of the field,
$b_{0}$
determines the strength of the field,
![]() $a$
the horizontal width of the twist zones,
$a$
the horizontal width of the twist zones,
![]() $l$
their vertical extent and
$l$
their vertical extent and
![]() $k$
the handedness of the twist (
$k$
the handedness of the twist (
![]() $k=1$
is right handed). The centre of rotation is
$k=1$
is right handed). The centre of rotation is
![]() $(x_{1c},x_{2c},s_{c})$
. The mixed helicity field is then defined as a superposition of
$(x_{1c},x_{2c},s_{c})$
. The mixed helicity field is then defined as a superposition of
![]() $n$
pairs of positive and negative twists and an axial background field
$n$
pairs of positive and negative twists and an axial background field
 $$\begin{eqnarray}\displaystyle \boldsymbol{B}_{br}(b_{0},a,l,d,R,n) & = & \displaystyle \mathop{\sum }_{i=1}^{n}\left[\boldsymbol{B}_{t}(b_{0},1,a,l,0,-d,s_{d}i)\right.\nonumber\\ \displaystyle & & \displaystyle +\,\left.\boldsymbol{B}_{t}(b_{0},-1,a,l,0,d,s_{d}(i+1))\right]+\frac{b_{0}}{J}\frac{\unicode[STIX]{x2202}\boldsymbol{f}}{\unicode[STIX]{x2202}s},\end{eqnarray}$$
where
![]() $s_{d}=\unicode[STIX]{x03C0}R/(2n+1)$
and
$s_{d}=\unicode[STIX]{x03C0}R/(2n+1)$
and
![]() $d$
is the axial offset of the two opposing twists (see figure 1). The final component is the axial field (see figure 1
b). Finally, to express (3.21) in the ambient Cartesian coordinate system
$d$
is the axial offset of the two opposing twists (see figure 1). The final component is the axial field (see figure 1
b). Finally, to express (3.21) in the ambient Cartesian coordinate system
![]() $(x,y,z)$
, we use the following maps between the tubular coordinates
$(x,y,z)$
, we use the following maps between the tubular coordinates
![]() $(s,x_{1},x_{2})$
and the Cartesian coordinates
$(s,x_{1},x_{2})$
and the Cartesian coordinates
where the branch cut for the arctan function is at
![]() $\unicode[STIX]{x03C0}$
. For a magnetic field confined to a tube of minor radius
$\unicode[STIX]{x03C0}$
. For a magnetic field confined to a tube of minor radius
![]() $r$
, the field
$r$
, the field
![]() $\boldsymbol{B}_{b}(x,y,z)$
takes the following form
$\boldsymbol{B}_{b}(x,y,z)$
takes the following form
For completeness, we can define a uniformly twisted field
![]() $\boldsymbol{B}_{t}$
as
$\boldsymbol{B}_{t}$
as
 $$\begin{eqnarray}\boldsymbol{B}_{tw}(x,y,z)=\left\{\begin{array}{@{}cc@{}}{\displaystyle \frac{\unicode[STIX]{x1D719}}{J}}\boldsymbol{R} & \text{ if }x_{1}^{2}(x,y,z)+x_{2}^{2}(x,y,z)\leqslant r,\\ 0 & \text{ if }x_{1}^{2}(x,y,z)+x_{2}^{2}(x,y,z)>r.\end{array}\right.\end{eqnarray}$$
with
![]() $\unicode[STIX]{x1D719}$
determining the rate of rotation of the field and
$\unicode[STIX]{x1D719}$
determining the rate of rotation of the field and
![]() $\boldsymbol{R}$
given by (3.20). The actual twisted model that we will use in the simulations is that in (3.24) but weighted with an exponential term (see MacTaggart & Hood Reference MacTaggart and Hood2009). In these studies, we set the tube parameters to be
$\boldsymbol{R}$
given by (3.20). The actual twisted model that we will use in the simulations is that in (3.24) but weighted with an exponential term (see MacTaggart & Hood Reference MacTaggart and Hood2009). In these studies, we set the tube parameters to be
![]() $z_{0}=-30$
,
$z_{0}=-30$
,
![]() $R=17.5$
and
$R=17.5$
and
![]() $r=2.5$
, so that the flux rope is anchored at the bottom boundary and its maximum initial height is
$r=2.5$
, so that the flux rope is anchored at the bottom boundary and its maximum initial height is
![]() $-10$
. The mixed helicity parameters are
$-10$
. The mixed helicity parameters are
![]() $a=\sqrt{0.04}$
,
$a=\sqrt{0.04}$
,
![]() $l=0.04\unicode[STIX]{x03C0}R$
,
$l=0.04\unicode[STIX]{x03C0}R$
,
![]() $d=2.5/3$
,
$d=2.5/3$
,
![]() $b_{0}=5$
and we consider
$b_{0}=5$
and we consider
![]() $n=2$
.
$n=2$
.

Figure 1. An example of the mixed helicity field we consider. (a) A field with
![]() $n=2$
, i.e. two right-handed twist elements (red) and two left handed (blue). (b) Shows the background axial field which is added to (a) in equation (3.21).
$n=2$
, i.e. two right-handed twist elements (red) and two left handed (blue). (b) Shows the background axial field which is added to (a) in equation (3.21).
Finally, we remark that the more general field specification in Prior & Yeates (Reference Prior and Yeates2016) allows for arbitrary tube shapes
![]() $\boldsymbol{r}(s)$
(as well as varying tube radius). The frame vectors
$\boldsymbol{r}(s)$
(as well as varying tube radius). The frame vectors
![]() $\boldsymbol{d}_{1}(s)$
and
$\boldsymbol{d}_{1}(s)$
and
![]() $\boldsymbol{d}_{2}(s)$
are defined by parallel transport, which requires an arclength integration. Thus, in general, the relationship between the tube coordinates
$\boldsymbol{d}_{2}(s)$
are defined by parallel transport, which requires an arclength integration. Thus, in general, the relationship between the tube coordinates
![]() $(s,x_{1},x_{2})$
and
$(s,x_{1},x_{2})$
and
![]() $(x,y,z)$
will require numerical integration.
$(x,y,z)$
will require numerical integration.
4 Quantities analysed
We now list the quantities we will make use of in our analysis of the flux emergence simulations.
4.1 Field line helicity input rate
For completeness, we restate (2.6),
which represents the contribution to the magnetic helicity input rate
![]() $\text{d}H/\text{d}t$
from a single point
$\text{d}H/\text{d}t$
from a single point
![]() $\boldsymbol{a}_{0}\in P$
. For the moving photosphere calculation we evaluate the field at the points of the surface
$\boldsymbol{a}_{0}\in P$
. For the moving photosphere calculation we evaluate the field at the points of the surface
![]() $P_{v}(\boldsymbol{a},t)$
and account for the surface Jacobian, i.e.
$P_{v}(\boldsymbol{a},t)$
and account for the surface Jacobian, i.e.
![]() $\text{d}x\,\text{d}y\rightarrow J\text{d}x\,\text{d}y$
. We label this quantity
$\text{d}x\,\text{d}y\rightarrow J\text{d}x\,\text{d}y$
. We label this quantity
![]() $\text{d}{\mathcal{H}}_{v}/\text{d}t$
.
$\text{d}{\mathcal{H}}_{v}/\text{d}t$
.
4.1.1 Net helicity input
The net helicity flux is given by
where the integration is taken over all
![]() $\boldsymbol{a}_{0}\in P$
. The total helicity input over a period
$\boldsymbol{a}_{0}\in P$
. The total helicity input over a period
![]() $[t_{0},t]$
through
$[t_{0},t]$
through
![]() $P$
is then given by
$P$
is then given by
In this study we choose
![]() $t_{0}$
to be the time at which the emerging magnetic field first reaches
$t_{0}$
to be the time at which the emerging magnetic field first reaches
![]() $z=0$
. The equivalent moving photosphere calculations will be labelled
$z=0$
. The equivalent moving photosphere calculations will be labelled
![]() $\text{d}H_{v}/\text{d}t$
and
$\text{d}H_{v}/\text{d}t$
and
![]() $H_{v}(t)$
. We point out that whilst the calculation concerns a moving surface, the quantity
$H_{v}(t)$
. We point out that whilst the calculation concerns a moving surface, the quantity
![]() $\text{d}H/\text{d}s$
is calculated on a fixed domain
$\text{d}H/\text{d}s$
is calculated on a fixed domain
![]() $P$
by projection (see 2.10). This applies to all calculations which consider the moving domain.
$P$
by projection (see 2.10). This applies to all calculations which consider the moving domain.
4.2 Winding input rate
The field line winding input is
and the integral of this over
![]() $P$
gives
$P$
gives
![]() $\text{d}L/\text{d}t$
. The net winding input over a time period
$\text{d}L/\text{d}t$
. The net winding input over a time period
![]() $[t_{0},t]$
is
$[t_{0},t]$
is
The moving photosphere calculations will be labelled with a
![]() $v$
subscript as for the helicity inputs, with analogous changes to the calculations.
$v$
subscript as for the helicity inputs, with analogous changes to the calculations.
4.3 Weak field corrections
In our simulations, there is no magnetic field outside the emerging regions. Therefore, there is a thin current sheet around the emerging field where the field strength rapidly decreases to zero. In this region the, field line topology is incoherent and not likely to be resolved numerically (typical field strengths in this layer are measured to be
![]() ${<}0.01\,\%$
of the peak field strength). Such regions make a negligible contribution to the helicity, due to the field strength weighting, but can have a significant effect on the winding calculations. To remove such potentially spurious information we will, in some calculations, modify the definition of the indicator function
${<}0.01\,\%$
of the peak field strength). Such regions make a negligible contribution to the helicity, due to the field strength weighting, but can have a significant effect on the winding calculations. To remove such potentially spurious information we will, in some calculations, modify the definition of the indicator function
![]() $\unicode[STIX]{x1D70E}_{z}$
to be
$\unicode[STIX]{x1D70E}_{z}$
to be
 $$\begin{eqnarray}\unicode[STIX]{x1D70E}_{z}(\boldsymbol{x})=\left\{\begin{array}{@{}cc@{}}1 & \text{if }B_{z}(\boldsymbol{x})>0\text{ and }|\boldsymbol{B}|>\unicode[STIX]{x1D716},\\ -1 & \text{if }B_{z}(\boldsymbol{x})<0\text{ and }|\boldsymbol{B}|>\unicode[STIX]{x1D716},\\ 0 & \text{if }B_{z}(\boldsymbol{x})=0\text{ or }|\boldsymbol{B}|\leqslant \unicode[STIX]{x1D716}.\end{array}\right.\end{eqnarray}$$
Where we use this definition in the article, we will be explicit and specify the value of
![]() $\unicode[STIX]{x1D716}$
. Otherwise it is to be assumed that
$\unicode[STIX]{x1D716}$
. Otherwise it is to be assumed that
![]() $\unicode[STIX]{x1D70E}_{z}$
has its usual definition (2.8).
$\unicode[STIX]{x1D70E}_{z}$
has its usual definition (2.8).
4.4 Winding and helicity ratios
Both the helicity and winding densities can be positive and negative corresponding to right- and left-handed field entanglement. For mixed helicity flux ropes there can be significant entanglement, locally, but little overall average. This is true of the mixed helicity fields
![]() $\boldsymbol{B}_{b}$
which have zero total helicity. To quantify whether the helicity input for a given simulation is biased to one sign or is mixed, we calculate the following ratios
$\boldsymbol{B}_{b}$
which have zero total helicity. To quantify whether the helicity input for a given simulation is biased to one sign or is mixed, we calculate the following ratios
4.5 Weighted velocity flux ${\mathcal{V}}_{z}$
The plasma flow across the photosphere will transpire to be an important quantity in what follows. We calculate the net rate of plasma flow through the photosphere weighted by the absolute plasma flow rate,
5 Simulation analysis
5.1 Twisted flux emergence
First, we analyse the helicity input of a twisted field with a non-dimensional twist of
![]() $\unicode[STIX]{x1D719}=-0.4$
and a negative (left-handed) chirality (the other parameters are as stated in § 3.2). This value of twist is a common choice for flux emergence simulations (e.g. Hood et al.
Reference Hood, Archontis and MacTaggart2012, and references therein) and represents a level of twist slightly below what would be required for the onset of the kink instability.
$\unicode[STIX]{x1D719}=-0.4$
and a negative (left-handed) chirality (the other parameters are as stated in § 3.2). This value of twist is a common choice for flux emergence simulations (e.g. Hood et al.
Reference Hood, Archontis and MacTaggart2012, and references therein) and represents a level of twist slightly below what would be required for the onset of the kink instability.
5.1.1 Physical characteristics of emergence

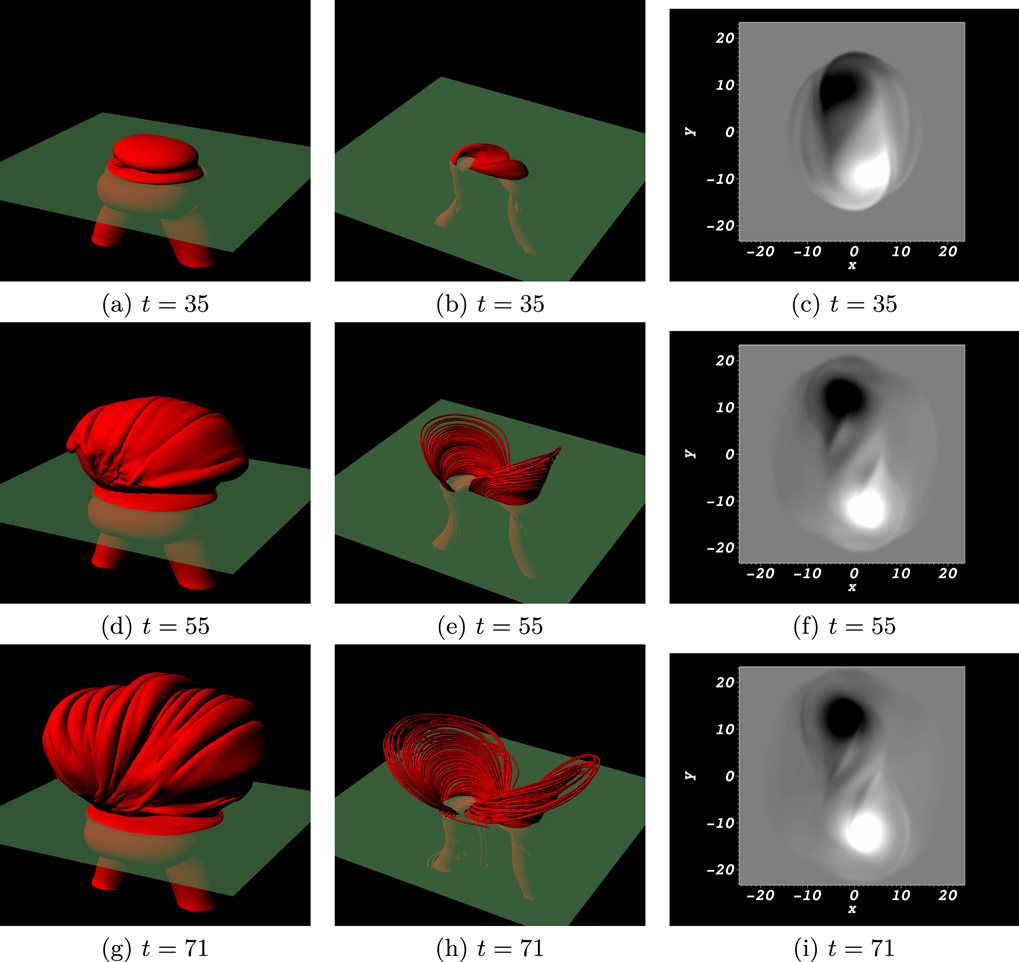
Figure 2. Illustrative distributions characterizing the emergence of the twisted flux rope into the Sun’s atmosphere. (a,d,g) are contour plots of the current density, showing the buoyancy instability-triggered rise and expansion into the corona. Also indicated is the plane
![]() $z=0$
. (b,e,h) represent subsets of the field lines at these times. (c,f,i) are the corresponding magnetograms with a clear bipole structure.
$z=0$
. (b,e,h) represent subsets of the field lines at these times. (c,f,i) are the corresponding magnetograms with a clear bipole structure.
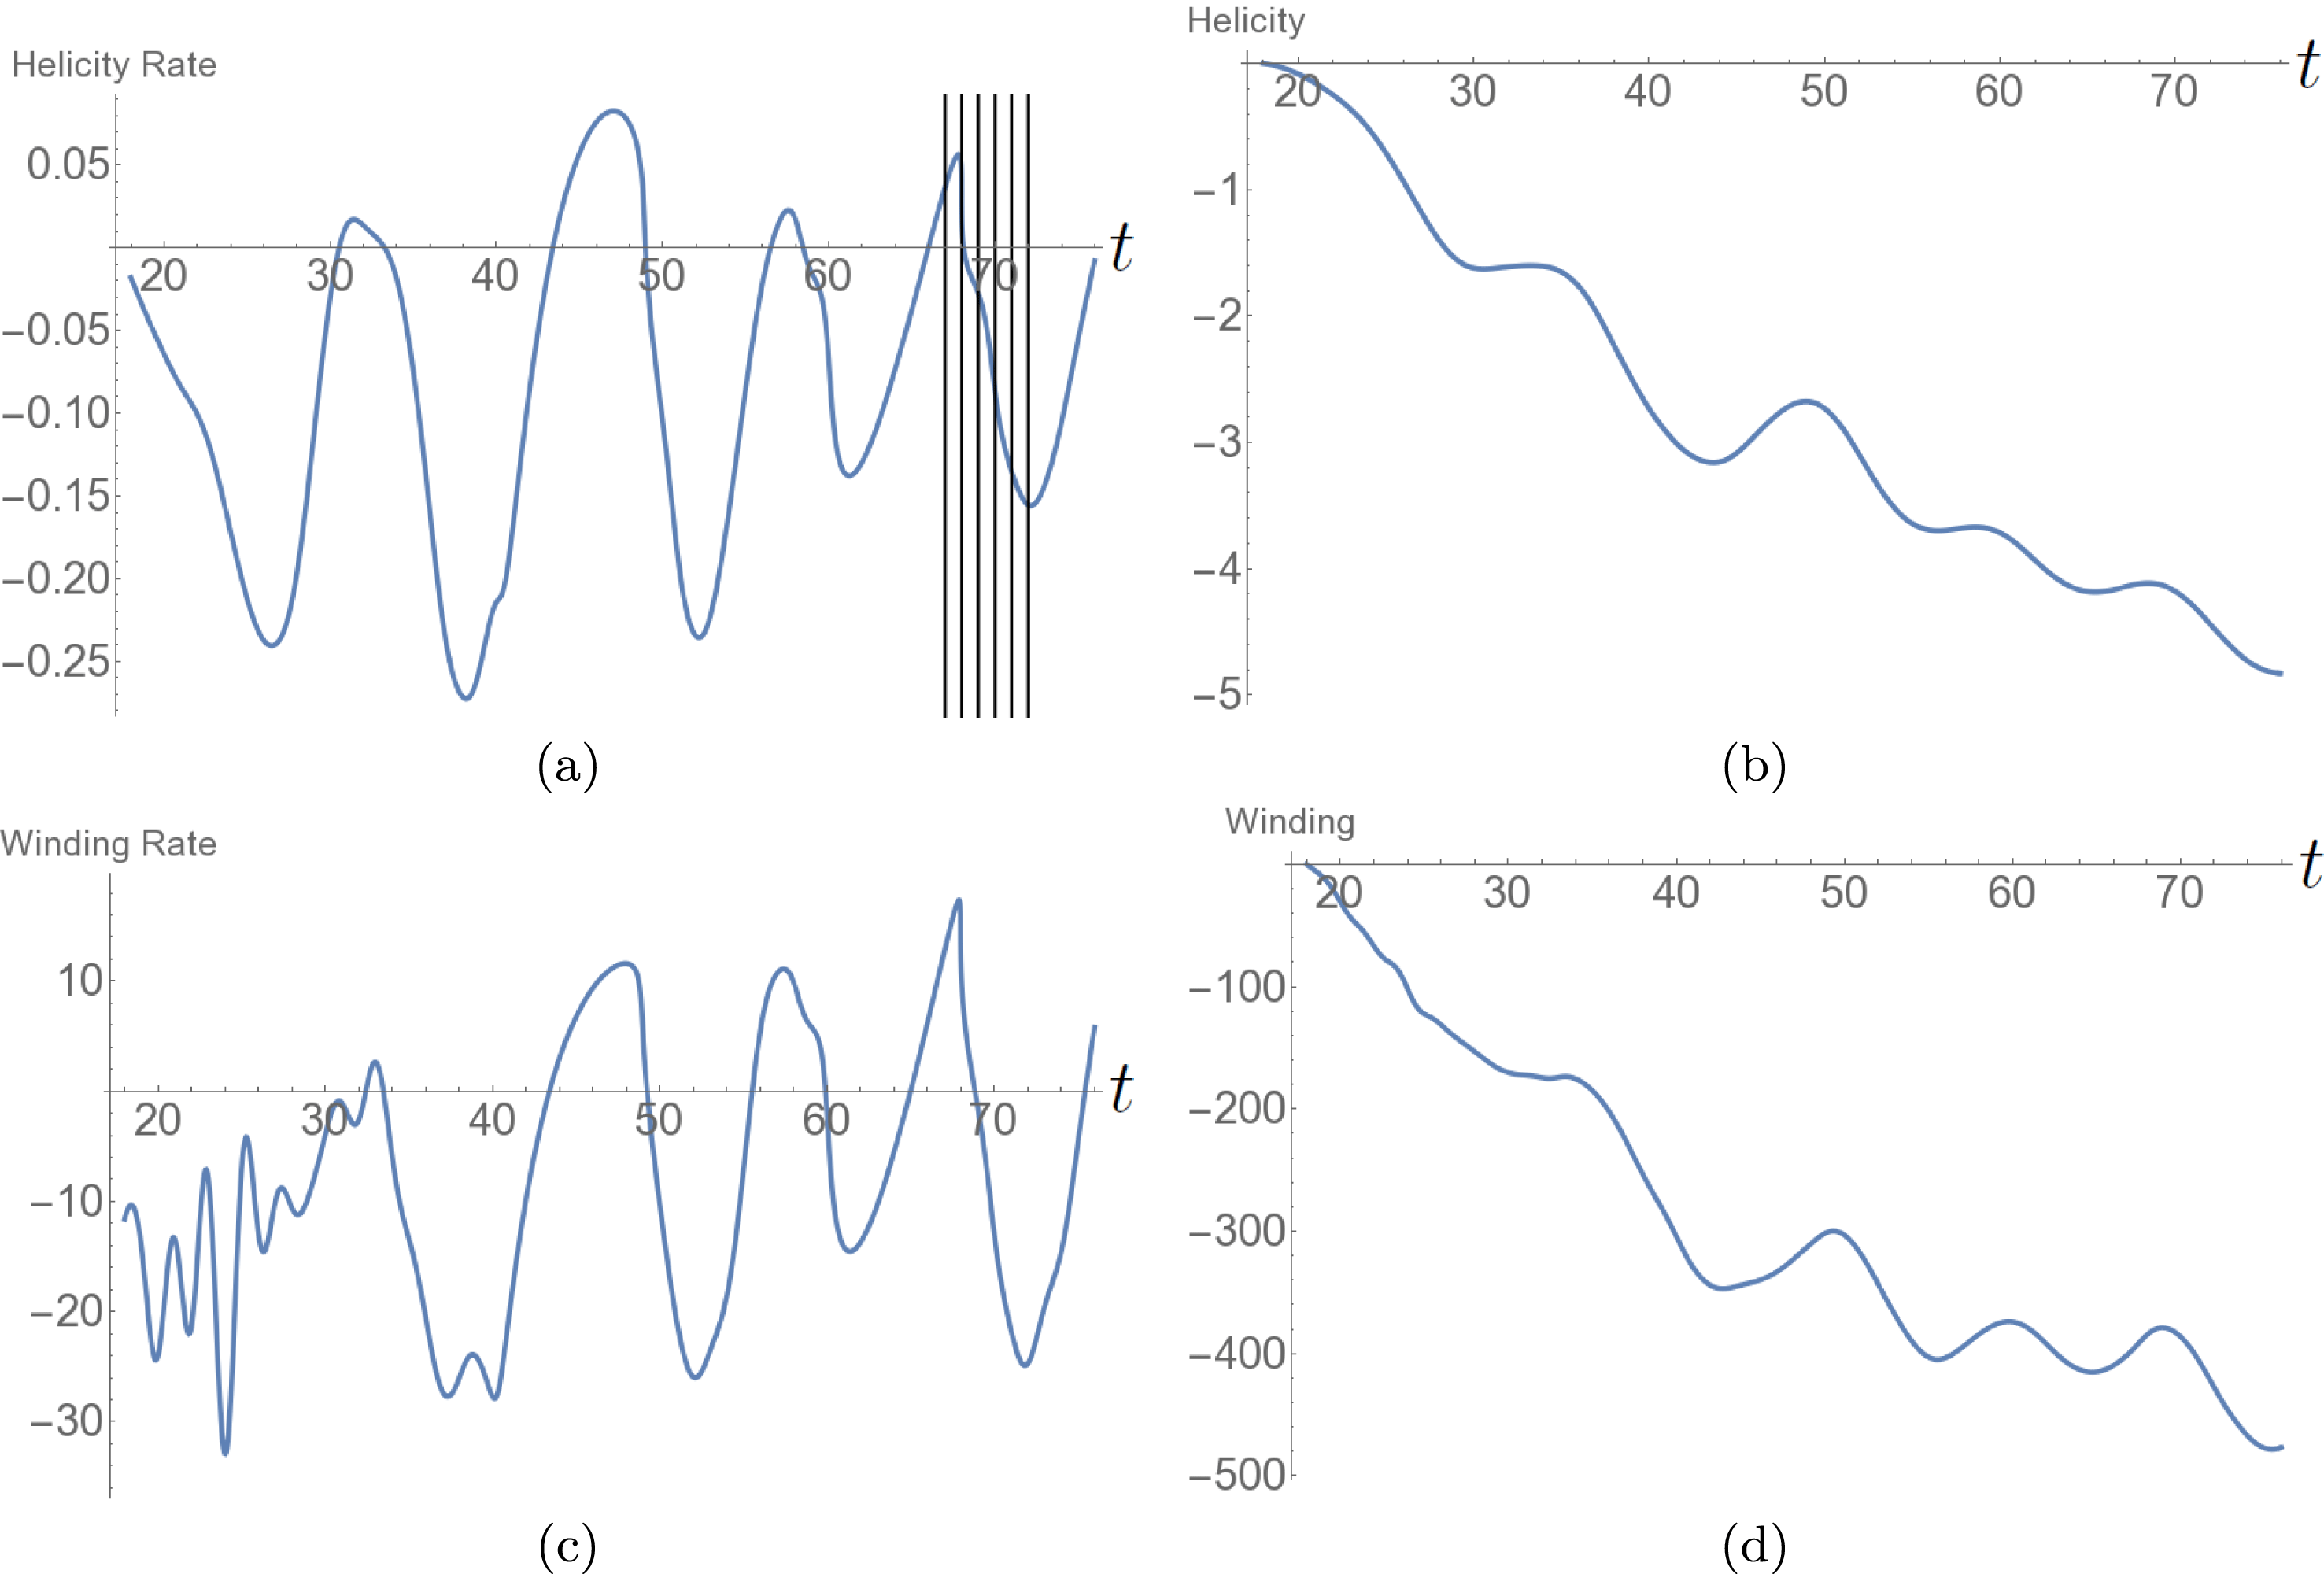
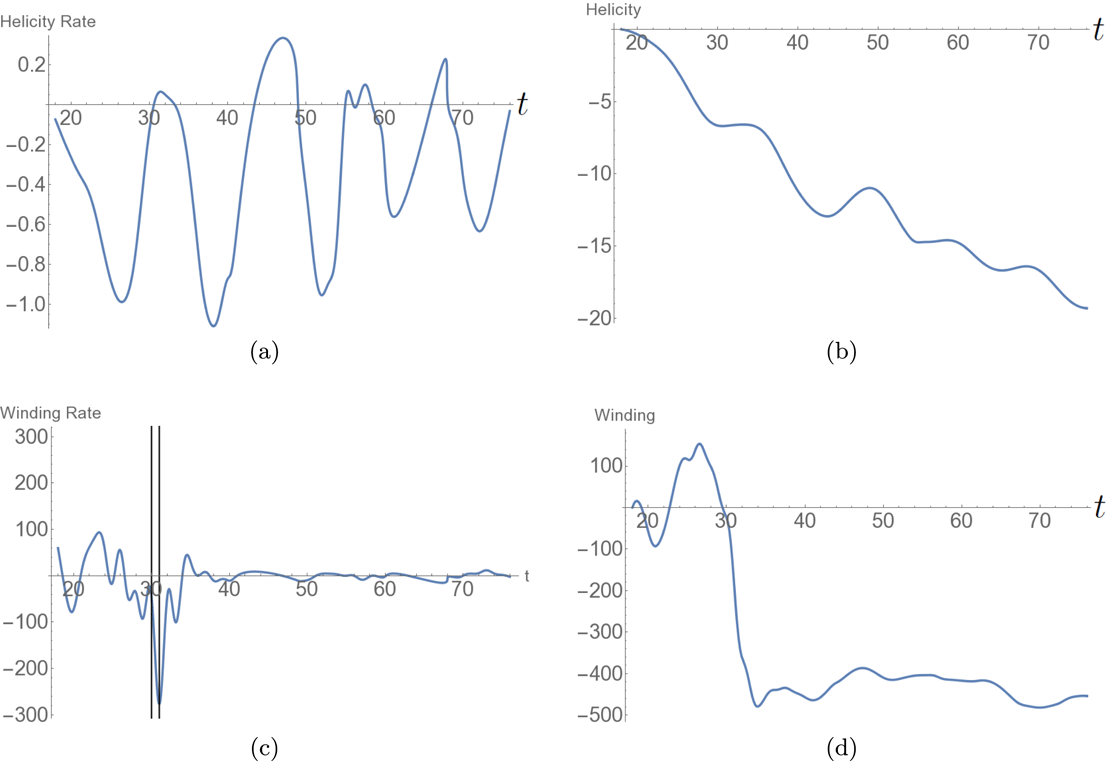
Figure 3. Photospheric helicity and winding input for the emergence of the twisted field. (a) The helicity input rate
![]() $\text{d}H/\text{d}t$
. It is negative on average and has a consistent oscillation. The vertical lines indicate the times
$\text{d}H/\text{d}t$
. It is negative on average and has a consistent oscillation. The vertical lines indicate the times
![]() $t=67$
–72 at which the field’s helicity distribution is analysed in what follows. (b) The net helicity input
$t=67$
–72 at which the field’s helicity distribution is analysed in what follows. (b) The net helicity input
![]() $H(t)$
which is always negative and increases in magnitude over time. (c) The winding input rate
$H(t)$
which is always negative and increases in magnitude over time. (c) The winding input rate
![]() $\text{d}L/\text{d}t$
and (d) the total winding input
$\text{d}L/\text{d}t$
and (d) the total winding input
![]() $L(t)$
.
$L(t)$
.
A description of the emergence of twisted flux tubes has been described in detail in many other studies (e.g. MacTaggart & Hood Reference MacTaggart and Hood2009; Hood et al.
Reference Hood, Archontis and MacTaggart2012) so we only highlight aspects critical to the subsequent helicity input analysis. Illustrative figures are shown in figure 2 at times
![]() $t=35,55$
and
$t=35,55$
and
![]() $71$
. The magnetic field reaches the photosphere where it remains until the plasma
$71$
. The magnetic field reaches the photosphere where it remains until the plasma
![]() $\unicode[STIX]{x1D6FD}$
drops to order unity and the field becomes subject to the magnetic buoyancy instability, subsequently expanding into the corona (Hood et al.
Reference Hood, Archontis and MacTaggart2012). The initial toroidal flux tube leads to a bipole emergence which is clearly visible in the magnetograms.
$\unicode[STIX]{x1D6FD}$
drops to order unity and the field becomes subject to the magnetic buoyancy instability, subsequently expanding into the corona (Hood et al.
Reference Hood, Archontis and MacTaggart2012). The initial toroidal flux tube leads to a bipole emergence which is clearly visible in the magnetograms.

Figure 4. Time series of the ratios (a)
![]() $H_{t}^{r}$
and (b)
$H_{t}^{r}$
and (b)
![]() $L_{t}^{r}$
for the twisted field emergence.
$L_{t}^{r}$
for the twisted field emergence.
5.1.2 Helicity and winding input time series
The temporal evolutions of both
![]() $\text{d}H/\text{d}t$
and
$\text{d}H/\text{d}t$
and
![]() $H$
are shown in figures 3(a) and 3(b) respectively. The tracking of the helicity input begins when the magnetic field reaches the photospheric boundary which, in this simulation, is almost coincident with the onset of the magnetic buoyancy instability (
$H$
are shown in figures 3(a) and 3(b) respectively. The tracking of the helicity input begins when the magnetic field reaches the photospheric boundary which, in this simulation, is almost coincident with the onset of the magnetic buoyancy instability (
![]() $t=18$
). With the initial expansion of the field into the corona there is an input of negative helicity (figure 3
a), as is to be expected for this negative helicity flux rope (MacTaggart & Hood Reference MacTaggart and Hood2009). Later, the helicity input settles into an oscillatory pattern with the input rate, occasionally, becoming net positive. The net helicity input
$t=18$
). With the initial expansion of the field into the corona there is an input of negative helicity (figure 3
a), as is to be expected for this negative helicity flux rope (MacTaggart & Hood Reference MacTaggart and Hood2009). Later, the helicity input settles into an oscillatory pattern with the input rate, occasionally, becoming net positive. The net helicity input
![]() $H$
, shown in figure 3(b), exhibits, on average, an almost linear input increase of negative helicity (in line with the results of Sturrock et al. (Reference Sturrock, Hood, Archontis and McNeill2015) accounting for the opposing sign of twist with a smaller oscillation about this trend). The time series
$H$
, shown in figure 3(b), exhibits, on average, an almost linear input increase of negative helicity (in line with the results of Sturrock et al. (Reference Sturrock, Hood, Archontis and McNeill2015) accounting for the opposing sign of twist with a smaller oscillation about this trend). The time series
![]() $\text{d}L/\text{d}t$
and
$\text{d}L/\text{d}t$
and
![]() $L$
, shown in figure 3(c,d), are qualitatively similar to their helicity counterparts so we do not focus on them in what immediately follows. In contrast to these results, the oscillations in the
$L$
, shown in figure 3(c,d), are qualitatively similar to their helicity counterparts so we do not focus on them in what immediately follows. In contrast to these results, the oscillations in the
![]() $\text{d}H/\text{d}t$
time series calculated in Sturrock et al. (Reference Sturrock, Hood, Archontis and McNeill2015) are relatively small (though similarly coherent) and do not cause the change in sign we find here. We will expand more on this comparison later. Finally, the ratios
$\text{d}H/\text{d}t$
time series calculated in Sturrock et al. (Reference Sturrock, Hood, Archontis and McNeill2015) are relatively small (though similarly coherent) and do not cause the change in sign we find here. We will expand more on this comparison later. Finally, the ratios
![]() $H_{t}^{r}$
and
$H_{t}^{r}$
and
![]() $L_{t}^{r}$
, whose time series are shown in figure 4, indicate, as expected, a preference towards one sign of helicity input, i.e. the quantity is often close to 1 in magnitude so that most of the winding/helicity density is coherent in sign (the sign, of course, oscillates from positive to negative). An important question to address is what is causing the oscillations and, further, why are they so significant in comparison to previous studies?
$L_{t}^{r}$
, whose time series are shown in figure 4, indicate, as expected, a preference towards one sign of helicity input, i.e. the quantity is often close to 1 in magnitude so that most of the winding/helicity density is coherent in sign (the sign, of course, oscillates from positive to negative). An important question to address is what is causing the oscillations and, further, why are they so significant in comparison to previous studies?
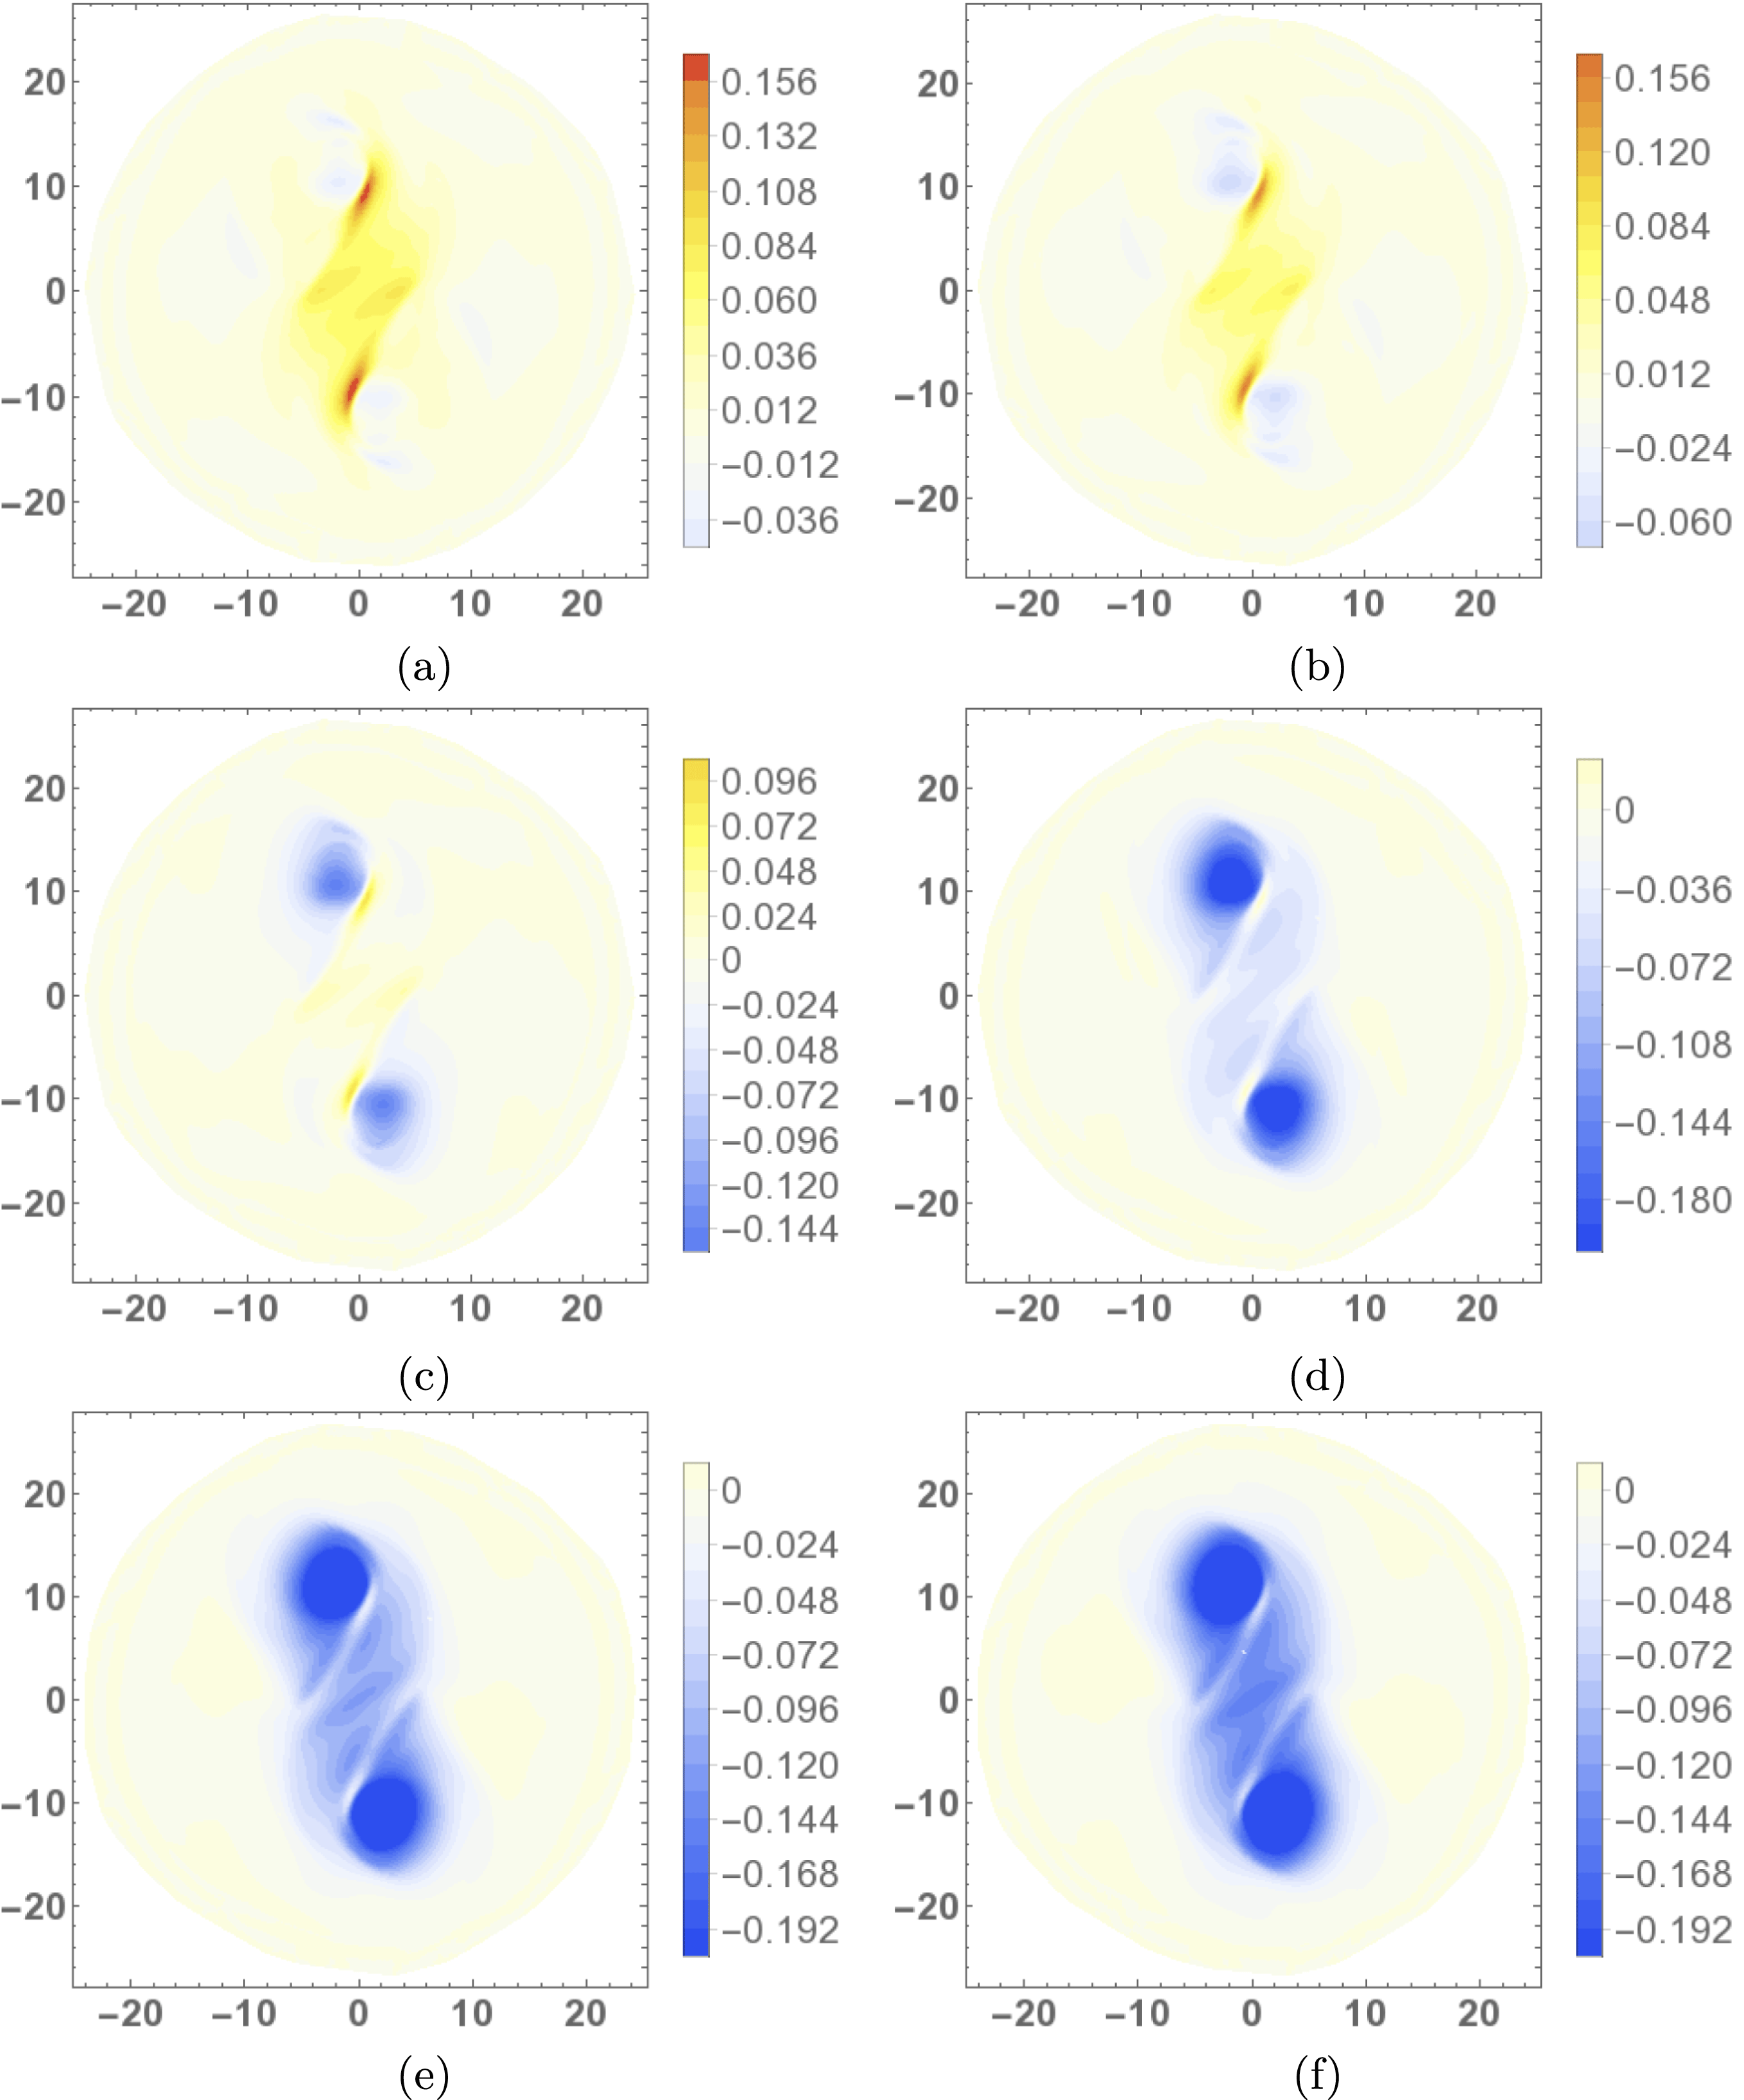
Figure 5. Helicity input rate density distributions
![]() $\text{d}{\mathcal{H}}/\text{d}t$
of the emerged region during the period
$\text{d}{\mathcal{H}}/\text{d}t$
of the emerged region during the period
![]() $t\in [67,72]$
over which the sign of
$t\in [67,72]$
over which the sign of
![]() $\text{d}H/\text{d}t$
varies form positive to negative (net). The plots shown in (a–f) correspond to times
$\text{d}H/\text{d}t$
varies form positive to negative (net). The plots shown in (a–f) correspond to times
![]() $t=67$
–
$t=67$
–
![]() $72$
indicated by the set of vertical lines on figure 3(a). (a) The density is dominantly positive around the PIL. In (b–f), the helicity input at the PIL changes from dominantly positive to negative. The helicity input in the two flux poles becomes dominantly negative over the cycle.
$72$
indicated by the set of vertical lines on figure 3(a). (a) The density is dominantly positive around the PIL. In (b–f), the helicity input at the PIL changes from dominantly positive to negative. The helicity input in the two flux poles becomes dominantly negative over the cycle.
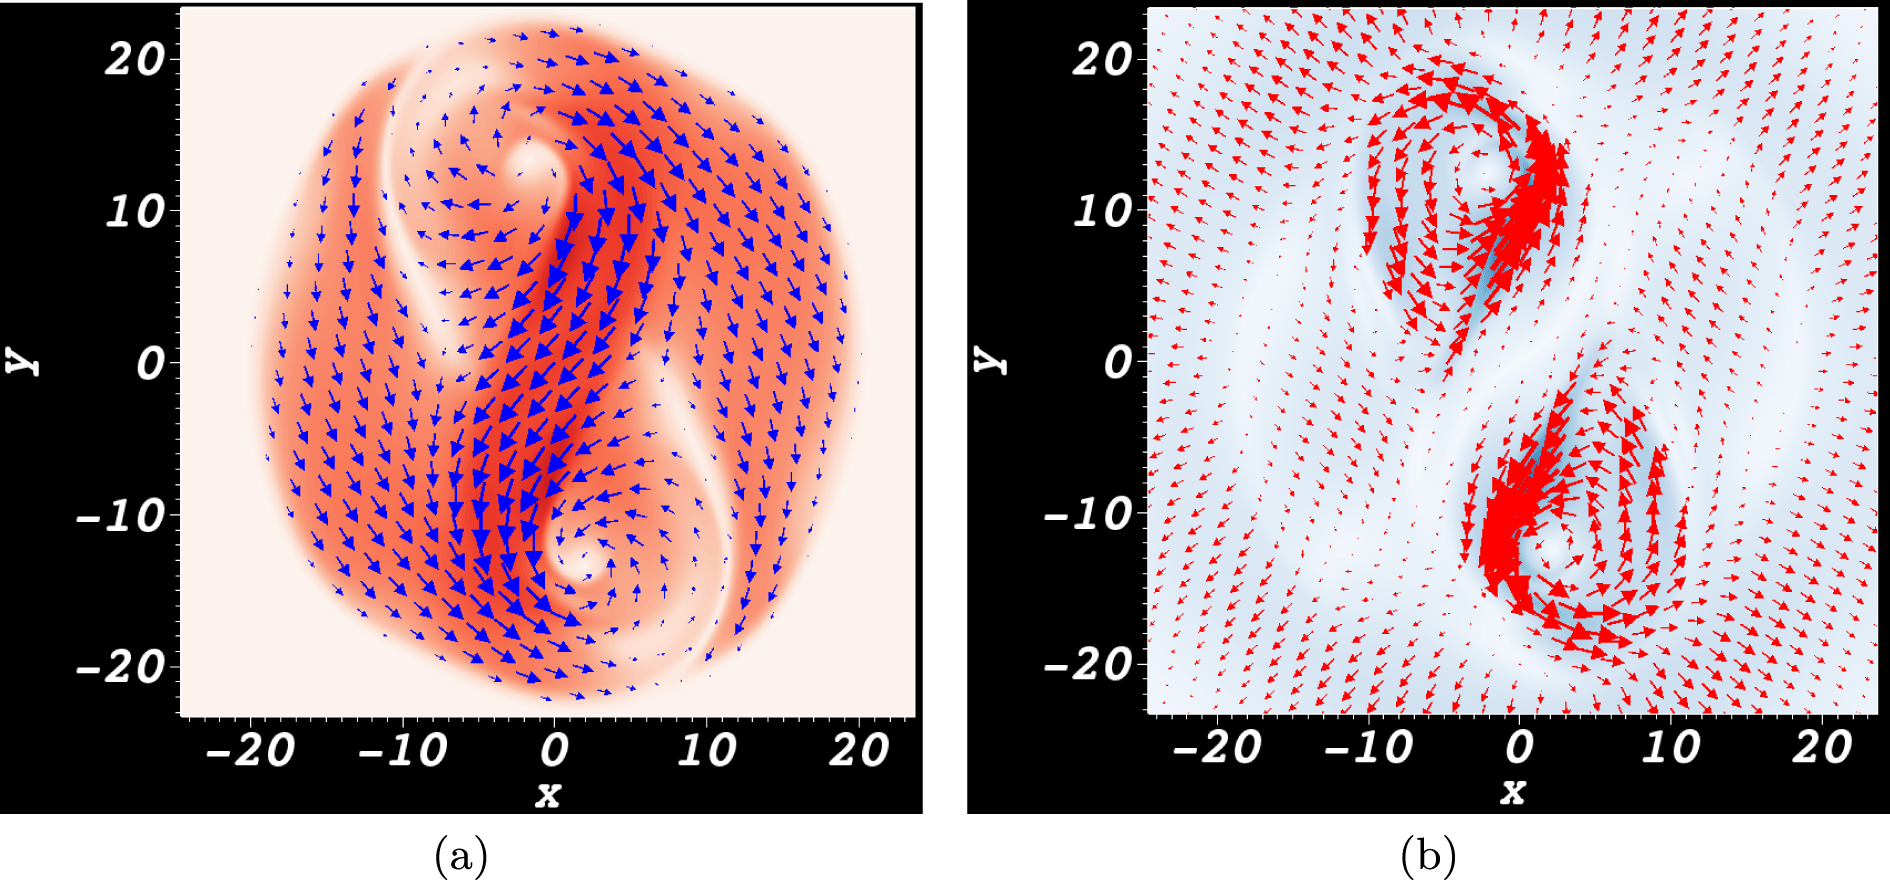
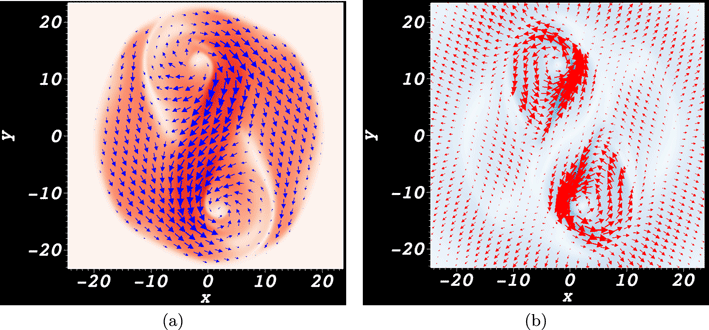
Figure 6. Magnetic and velocity field distributions in the photosphere at
![]() $t=67$
. (a) The transverse field
$t=67$
. (a) The transverse field
![]() $\boldsymbol{B}_{\Vert }$
superimposed on a scalar plot of its magnitude (stronger red colouring implies a stronger field). The twist at the positive pole is left-handed and the twist at the negative pole is right-handed. (b) The transverse velocity field
$\boldsymbol{B}_{\Vert }$
superimposed on a scalar plot of its magnitude (stronger red colouring implies a stronger field). The twist at the positive pole is left-handed and the twist at the negative pole is right-handed. (b) The transverse velocity field
![]() $\boldsymbol{u}_{\Vert }$
superimposed on a scalar plot of its magnitude (stronger blue colouring implies a stronger field). Both vortices have right-handed rotation.
$\boldsymbol{u}_{\Vert }$
superimposed on a scalar plot of its magnitude (stronger blue colouring implies a stronger field). Both vortices have right-handed rotation.
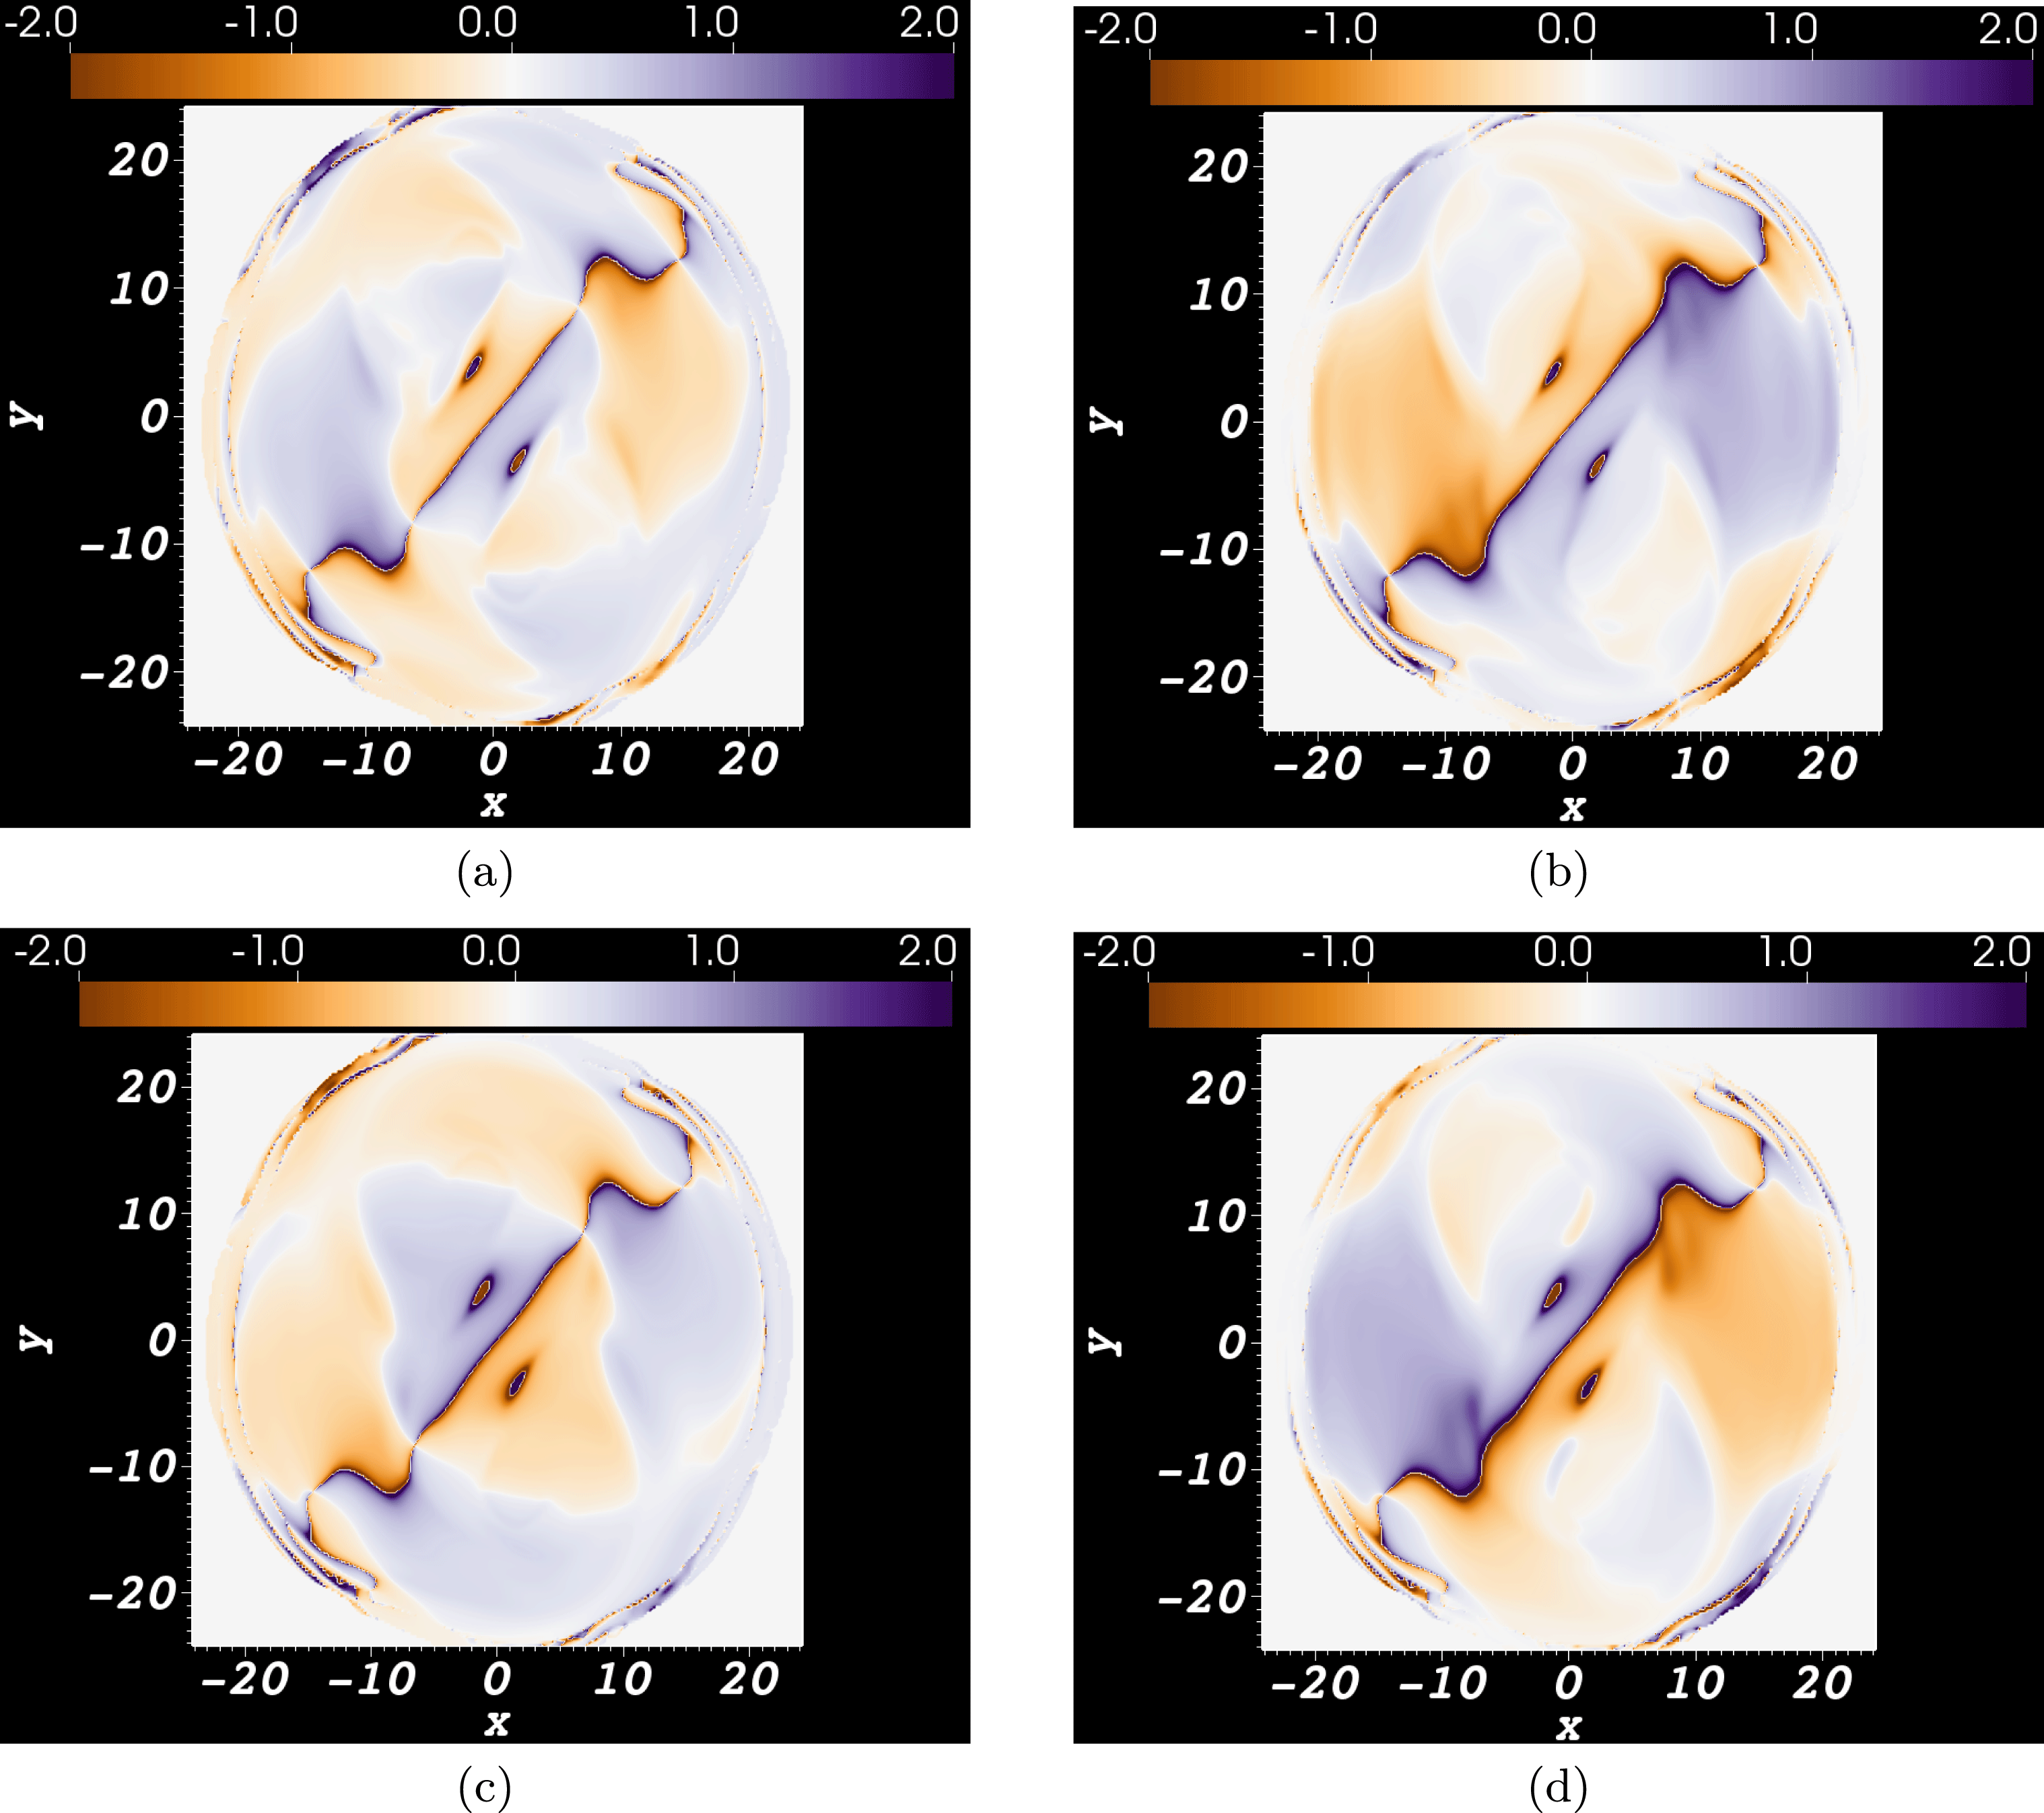
Figure 7. Distributions of the components of the helicity producing field
![]() $\boldsymbol{w}$
, at times
$\boldsymbol{w}$
, at times
![]() $t=67$
and
$t=67$
and
![]() $72$
. Panels (a,b) are the distributions of
$72$
. Panels (a,b) are the distributions of
![]() $\sqrt{w_{x}(\boldsymbol{a}_{0})}$
and
$\sqrt{w_{x}(\boldsymbol{a}_{0})}$
and
![]() $\sqrt{w_{y}(\boldsymbol{a}_{0})}$
respectively at
$\sqrt{w_{y}(\boldsymbol{a}_{0})}$
respectively at
![]() $t=67$
. Panels (c,d) are the same distributions but at
$t=67$
. Panels (c,d) are the same distributions but at
![]() $t=72$
. For both
$t=72$
. For both
![]() $w_{x}(\boldsymbol{a}_{0})$
and
$w_{x}(\boldsymbol{a}_{0})$
and
![]() $w_{y}(\boldsymbol{a}_{0})$
, the sign of the distribution either side of the PIL reverses.
$w_{y}(\boldsymbol{a}_{0})$
, the sign of the distribution either side of the PIL reverses.
We now focus on the time period
![]() $t\in [67,72]$
, indicated in figure 3(a) by a set of vertical lines. There is a variation between positive and negative input rates over this period. There is no particular reason why we choose to present the results of this period over the rest of the input cycle (except the rise stage). Indeed we checked that the following analysis would have led to similar conclusions for the behaviour of the system over the period
$t\in [67,72]$
, indicated in figure 3(a) by a set of vertical lines. There is a variation between positive and negative input rates over this period. There is no particular reason why we choose to present the results of this period over the rest of the input cycle (except the rise stage). Indeed we checked that the following analysis would have led to similar conclusions for the behaviour of the system over the period
![]() $t\in [40,76]$
.
$t\in [40,76]$
.
Distributions of
![]() $\text{d}{\mathcal{H}}/\text{d}t$
, during the considered time interval, are shown in figure 5. At
$\text{d}{\mathcal{H}}/\text{d}t$
, during the considered time interval, are shown in figure 5. At
![]() $t=67$
(a) and
$t=67$
(a) and
![]() $t=72$
(f) there are respectively strong positive and then negative field line helicity input densities around the polarity inversion line (PIL). For the intermediate times (b–d), the field line helicity density in this region shows a gradual variation from positive to negative. Patches of strong negative density at the two poles of flux distribution also develop over the period. There are fluid vortices, in the in-plane velocity field, which are centred on these poles. It is shown in figure 6 that at the magnetic field’s positive pole, the vortex opposes the direction of magnetic twist, whilst at the negative pole the signs of the vortical and magnetic twists agree. We might speculate that some kind of relative balance between the twisted field input and fluid rotation might lead to the oscillation in helicity input around the inversion line. However, we now show this oscillation occurs instead due to the cyclic submergence and re-emergence of the flux, that is, the movement of part of the magnetic field below and above the photospheric plane. In what follows, submergence does not necessarily indicate that the field passes deep beneath the photosphere. As will be demonstrated, any part of the field that makes contact with the photospheric boundary, and perhaps passing only slightly beneath it, will register a signal in the magnetograms and in the helicity and winding inputs. Therefore, in this work, submergence is any previously emerged field moving down from the atmosphere or otherwise making contact with the photosphere from above.
$t=72$
(f) there are respectively strong positive and then negative field line helicity input densities around the polarity inversion line (PIL). For the intermediate times (b–d), the field line helicity density in this region shows a gradual variation from positive to negative. Patches of strong negative density at the two poles of flux distribution also develop over the period. There are fluid vortices, in the in-plane velocity field, which are centred on these poles. It is shown in figure 6 that at the magnetic field’s positive pole, the vortex opposes the direction of magnetic twist, whilst at the negative pole the signs of the vortical and magnetic twists agree. We might speculate that some kind of relative balance between the twisted field input and fluid rotation might lead to the oscillation in helicity input around the inversion line. However, we now show this oscillation occurs instead due to the cyclic submergence and re-emergence of the flux, that is, the movement of part of the magnetic field below and above the photospheric plane. In what follows, submergence does not necessarily indicate that the field passes deep beneath the photosphere. As will be demonstrated, any part of the field that makes contact with the photospheric boundary, and perhaps passing only slightly beneath it, will register a signal in the magnetograms and in the helicity and winding inputs. Therefore, in this work, submergence is any previously emerged field moving down from the atmosphere or otherwise making contact with the photosphere from above.
5.2 Helicity sign change around the PIL

Figure 8. Plots of the winding input rate over the period
![]() $t=67$
to
$t=67$
to
![]() $71$
for (a) the unrestricted calculation
$71$
for (a) the unrestricted calculation
![]() $\text{d}L/\text{d}t$
and (b) the capped version
$\text{d}L/\text{d}t$
and (b) the capped version
![]() $\text{d}L^{c}/\text{d}t$
for which the threshold is
$\text{d}L^{c}/\text{d}t$
for which the threshold is
![]() $c=2$
.
$c=2$
.
The distributions of the
![]() $x$
and
$x$
and
![]() $y$
-components of
$y$
-components of
![]() $\boldsymbol{w}=\text{d}\boldsymbol{a}/\text{d}t$
at
$\boldsymbol{w}=\text{d}\boldsymbol{a}/\text{d}t$
at
![]() $t=67$
and
$t=67$
and
![]() $t=72$
are shown in figure 7. The most significant helicity producing velocities arise in the neighbourhood of the PIL (the plots are of
$t=72$
are shown in figure 7. The most significant helicity producing velocities arise in the neighbourhood of the PIL (the plots are of
![]() $\sqrt{w}_{x}$
and
$\sqrt{w}_{x}$
and
![]() $\sqrt{w}_{y}$
are shown for clarity, thus relatively exaggerating the magnitudes in weaker regions). There is a clear switch in sign of both the
$\sqrt{w}_{y}$
are shown for clarity, thus relatively exaggerating the magnitudes in weaker regions). There is a clear switch in sign of both the
![]() $w_{x}$
and
$w_{x}$
and
![]() $w_{y}$
densities on both sides of the PIL over this cycle. To test if it is the temporal change in the sign of the field line velocity field
$w_{y}$
densities on both sides of the PIL over this cycle. To test if it is the temporal change in the sign of the field line velocity field
![]() $\boldsymbol{w}$
close to the PIL which determines the change in sign of the helicity input, we consider a modified vector field
$\boldsymbol{w}$
close to the PIL which determines the change in sign of the helicity input, we consider a modified vector field
![]() $\boldsymbol{w}^{c}$
as follows
$\boldsymbol{w}^{c}$
as follows
where
![]() $c$
is some chosen threshold. We choose
$c$
is some chosen threshold. We choose
![]() $c=2$
here, which represents a cutoff speed much smaller than typical field line speeds at the PIL (
$c=2$
here, which represents a cutoff speed much smaller than typical field line speeds at the PIL (
![]() ${\approx}10$
). As long as the cutoff is small enough, the following results are robust. The main behaviour of the following results was also obtained for
${\approx}10$
). As long as the cutoff is small enough, the following results are robust. The main behaviour of the following results was also obtained for
![]() $c=1$
and
$c=1$
and
![]() $c=5$
.
$c=5$
.
In essence, we cut out the higher helicity producing velocities which reside primarily in the region of the PIL and not at the centres of the magnetic footpoints. We also calculate the modified field line winding input rate
![]() $\text{d}L^{c}/\text{d}t$
using
$\text{d}L^{c}/\text{d}t$
using
![]() $\boldsymbol{w}^{c}$
. We see in figure 8(a) that the full winding input rate
$\boldsymbol{w}^{c}$
. We see in figure 8(a) that the full winding input rate
![]() $\text{d}L/\text{d}t$
changes sign from positive to negative over the time period
$\text{d}L/\text{d}t$
changes sign from positive to negative over the time period
![]() $t\in [67,72]$
. By contrast, for the restricted input
$t\in [67,72]$
. By contrast, for the restricted input
![]() $\text{d}L^{c}/\text{d}t$
(b), the sign of winding input is always negative over this period and two orders of magnitude smaller. Therefore, ignoring the winding input due to the field line motions
$\text{d}L^{c}/\text{d}t$
(b), the sign of winding input is always negative over this period and two orders of magnitude smaller. Therefore, ignoring the winding input due to the field line motions
![]() $\boldsymbol{w}$
around the PIL leads to a time series which does not have a positive input rate over this period (the story is the same for the helicity input rate). It was confirmed that this is true throughout the simulation (for the time period when the oscillations in
$\boldsymbol{w}$
around the PIL leads to a time series which does not have a positive input rate over this period (the story is the same for the helicity input rate). It was confirmed that this is true throughout the simulation (for the time period when the oscillations in
![]() $\text{d}H/\text{d}t$
occur).
$\text{d}H/\text{d}t$
occur).
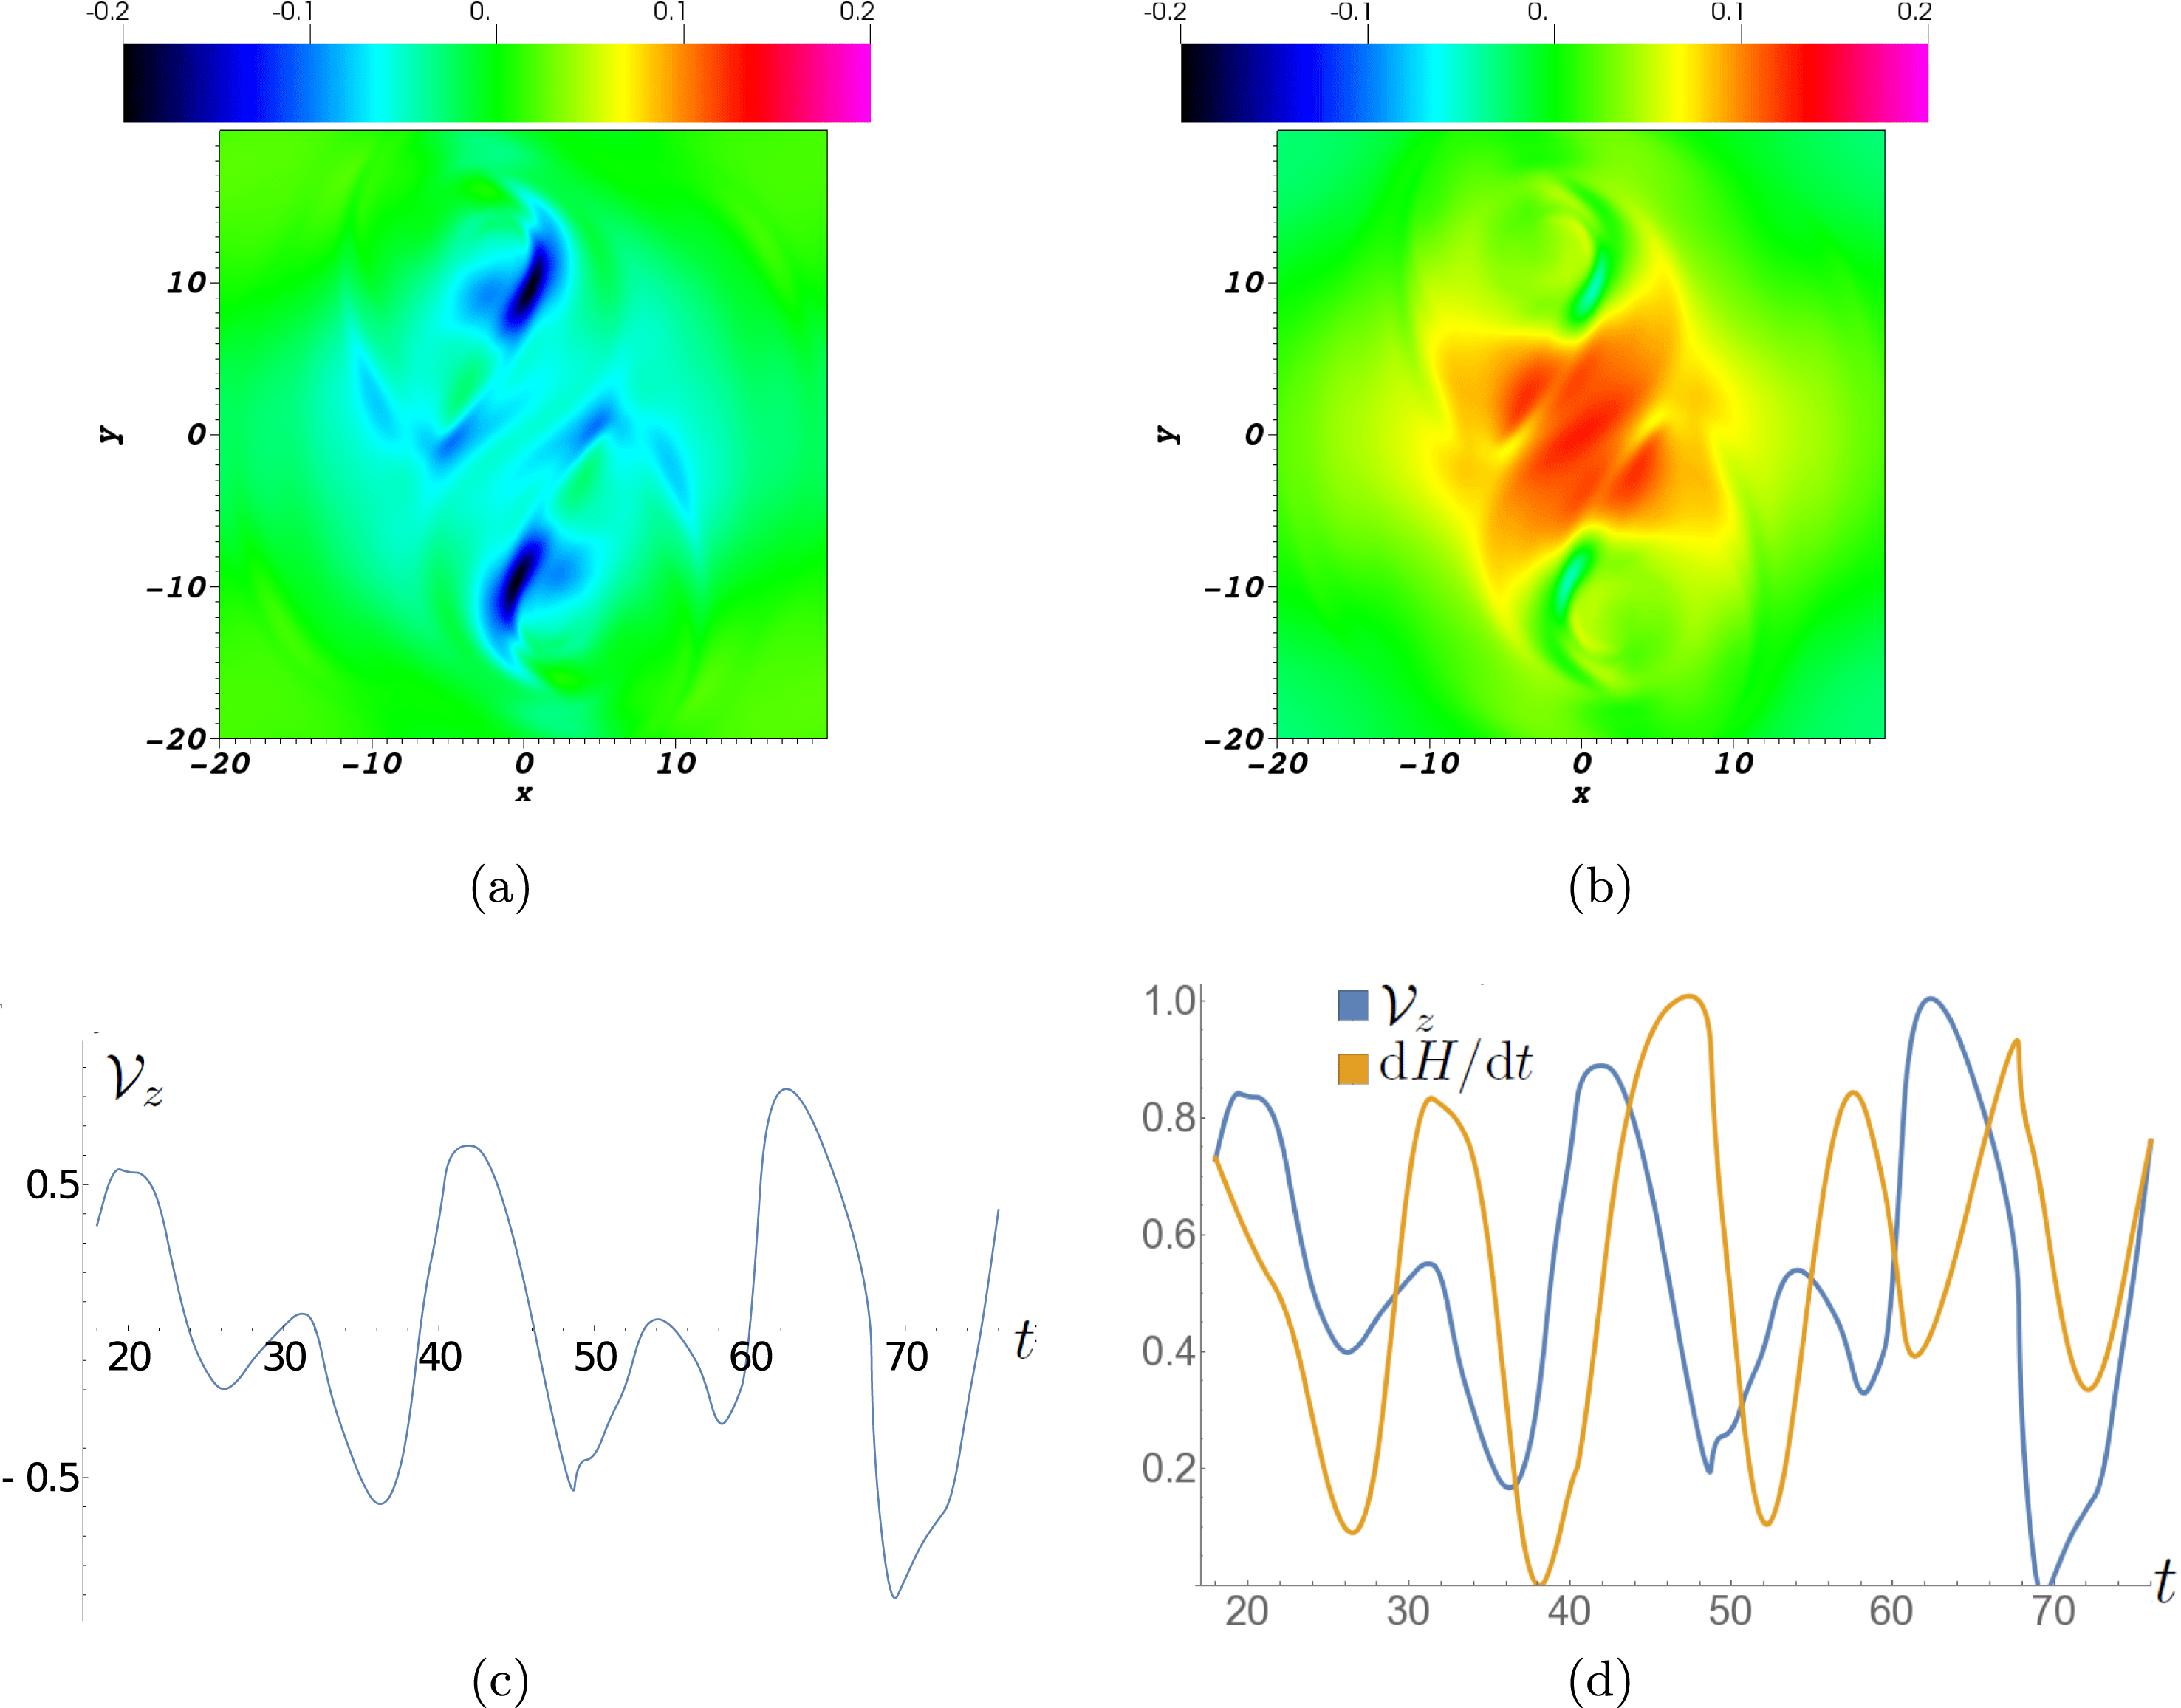
Figure 9. Distributions of the vertical velocity
![]() $u_{z}(\boldsymbol{a}_{0})$
at times (a)
$u_{z}(\boldsymbol{a}_{0})$
at times (a)
![]() $t=67$
and (b)
$t=67$
and (b)
![]() $72$
. (c) A plot of the net velocity flux
$72$
. (c) A plot of the net velocity flux
![]() ${\mathcal{V}}_{z}$
through
${\mathcal{V}}_{z}$
through
![]() $P$
. (d) Plots of
$P$
. (d) Plots of
![]() $\text{d}H/\text{d}t$
and
$\text{d}H/\text{d}t$
and
![]() ${\mathcal{V}}_{z}$
scaled to have values between
${\mathcal{V}}_{z}$
scaled to have values between
![]() $0$
and
$0$
and
![]() $1$
.
$1$
.
The cause of the helicity sign change is found to be related to a switch in the sign of
![]() $u_{z}$
in the region around the PIL. To establish this, we first evaluate the relative magnitudes of the terms
$u_{z}$
in the region around the PIL. To establish this, we first evaluate the relative magnitudes of the terms
![]() $\boldsymbol{u}_{\Vert }$
and
$\boldsymbol{u}_{\Vert }$
and
![]() $\boldsymbol{B}_{\Vert }u_{z}/B_{z}$
. The submergence/emergence term
$\boldsymbol{B}_{\Vert }u_{z}/B_{z}$
. The submergence/emergence term
![]() $\boldsymbol{B}_{\Vert }u_{z}/B_{z}$
is typically found to be an order of magnitude higher in the regions where
$\boldsymbol{B}_{\Vert }u_{z}/B_{z}$
is typically found to be an order of magnitude higher in the regions where
![]() $\boldsymbol{w}$
is (relatively) large. The
$\boldsymbol{w}$
is (relatively) large. The
![]() $u_{z}$
distributions at the start (
$u_{z}$
distributions at the start (
![]() $t=67$
) and end (
$t=67$
) and end (
![]() $t=72$
) of the cycle are shown in figure 9(a,b). Initially, there is a net negative velocity with most of the flow surrounding the PIL. Then at the end of the period the velocity is net positive with most of the flow being at the PIL. A time series plot of the net velocity flux
$t=72$
) of the cycle are shown in figure 9(a,b). Initially, there is a net negative velocity with most of the flow surrounding the PIL. Then at the end of the period the velocity is net positive with most of the flow being at the PIL. A time series plot of the net velocity flux
![]() ${\mathcal{V}}_{z}$
is shown in figure 9(c). A scaled comparison of the maxima and minima of
${\mathcal{V}}_{z}$
is shown in figure 9(c). A scaled comparison of the maxima and minima of
![]() $\text{d}H/\text{d}t$
and
$\text{d}H/\text{d}t$
and
![]() ${\mathcal{V}}_{z}$
is shown in figure 9(d) emphasizing that it is motion across the photosphere that is dominating the helicity in this phase of emergence.
${\mathcal{V}}_{z}$
is shown in figure 9(d) emphasizing that it is motion across the photosphere that is dominating the helicity in this phase of emergence.
5.2.1 Flux rope centre at the photosphere
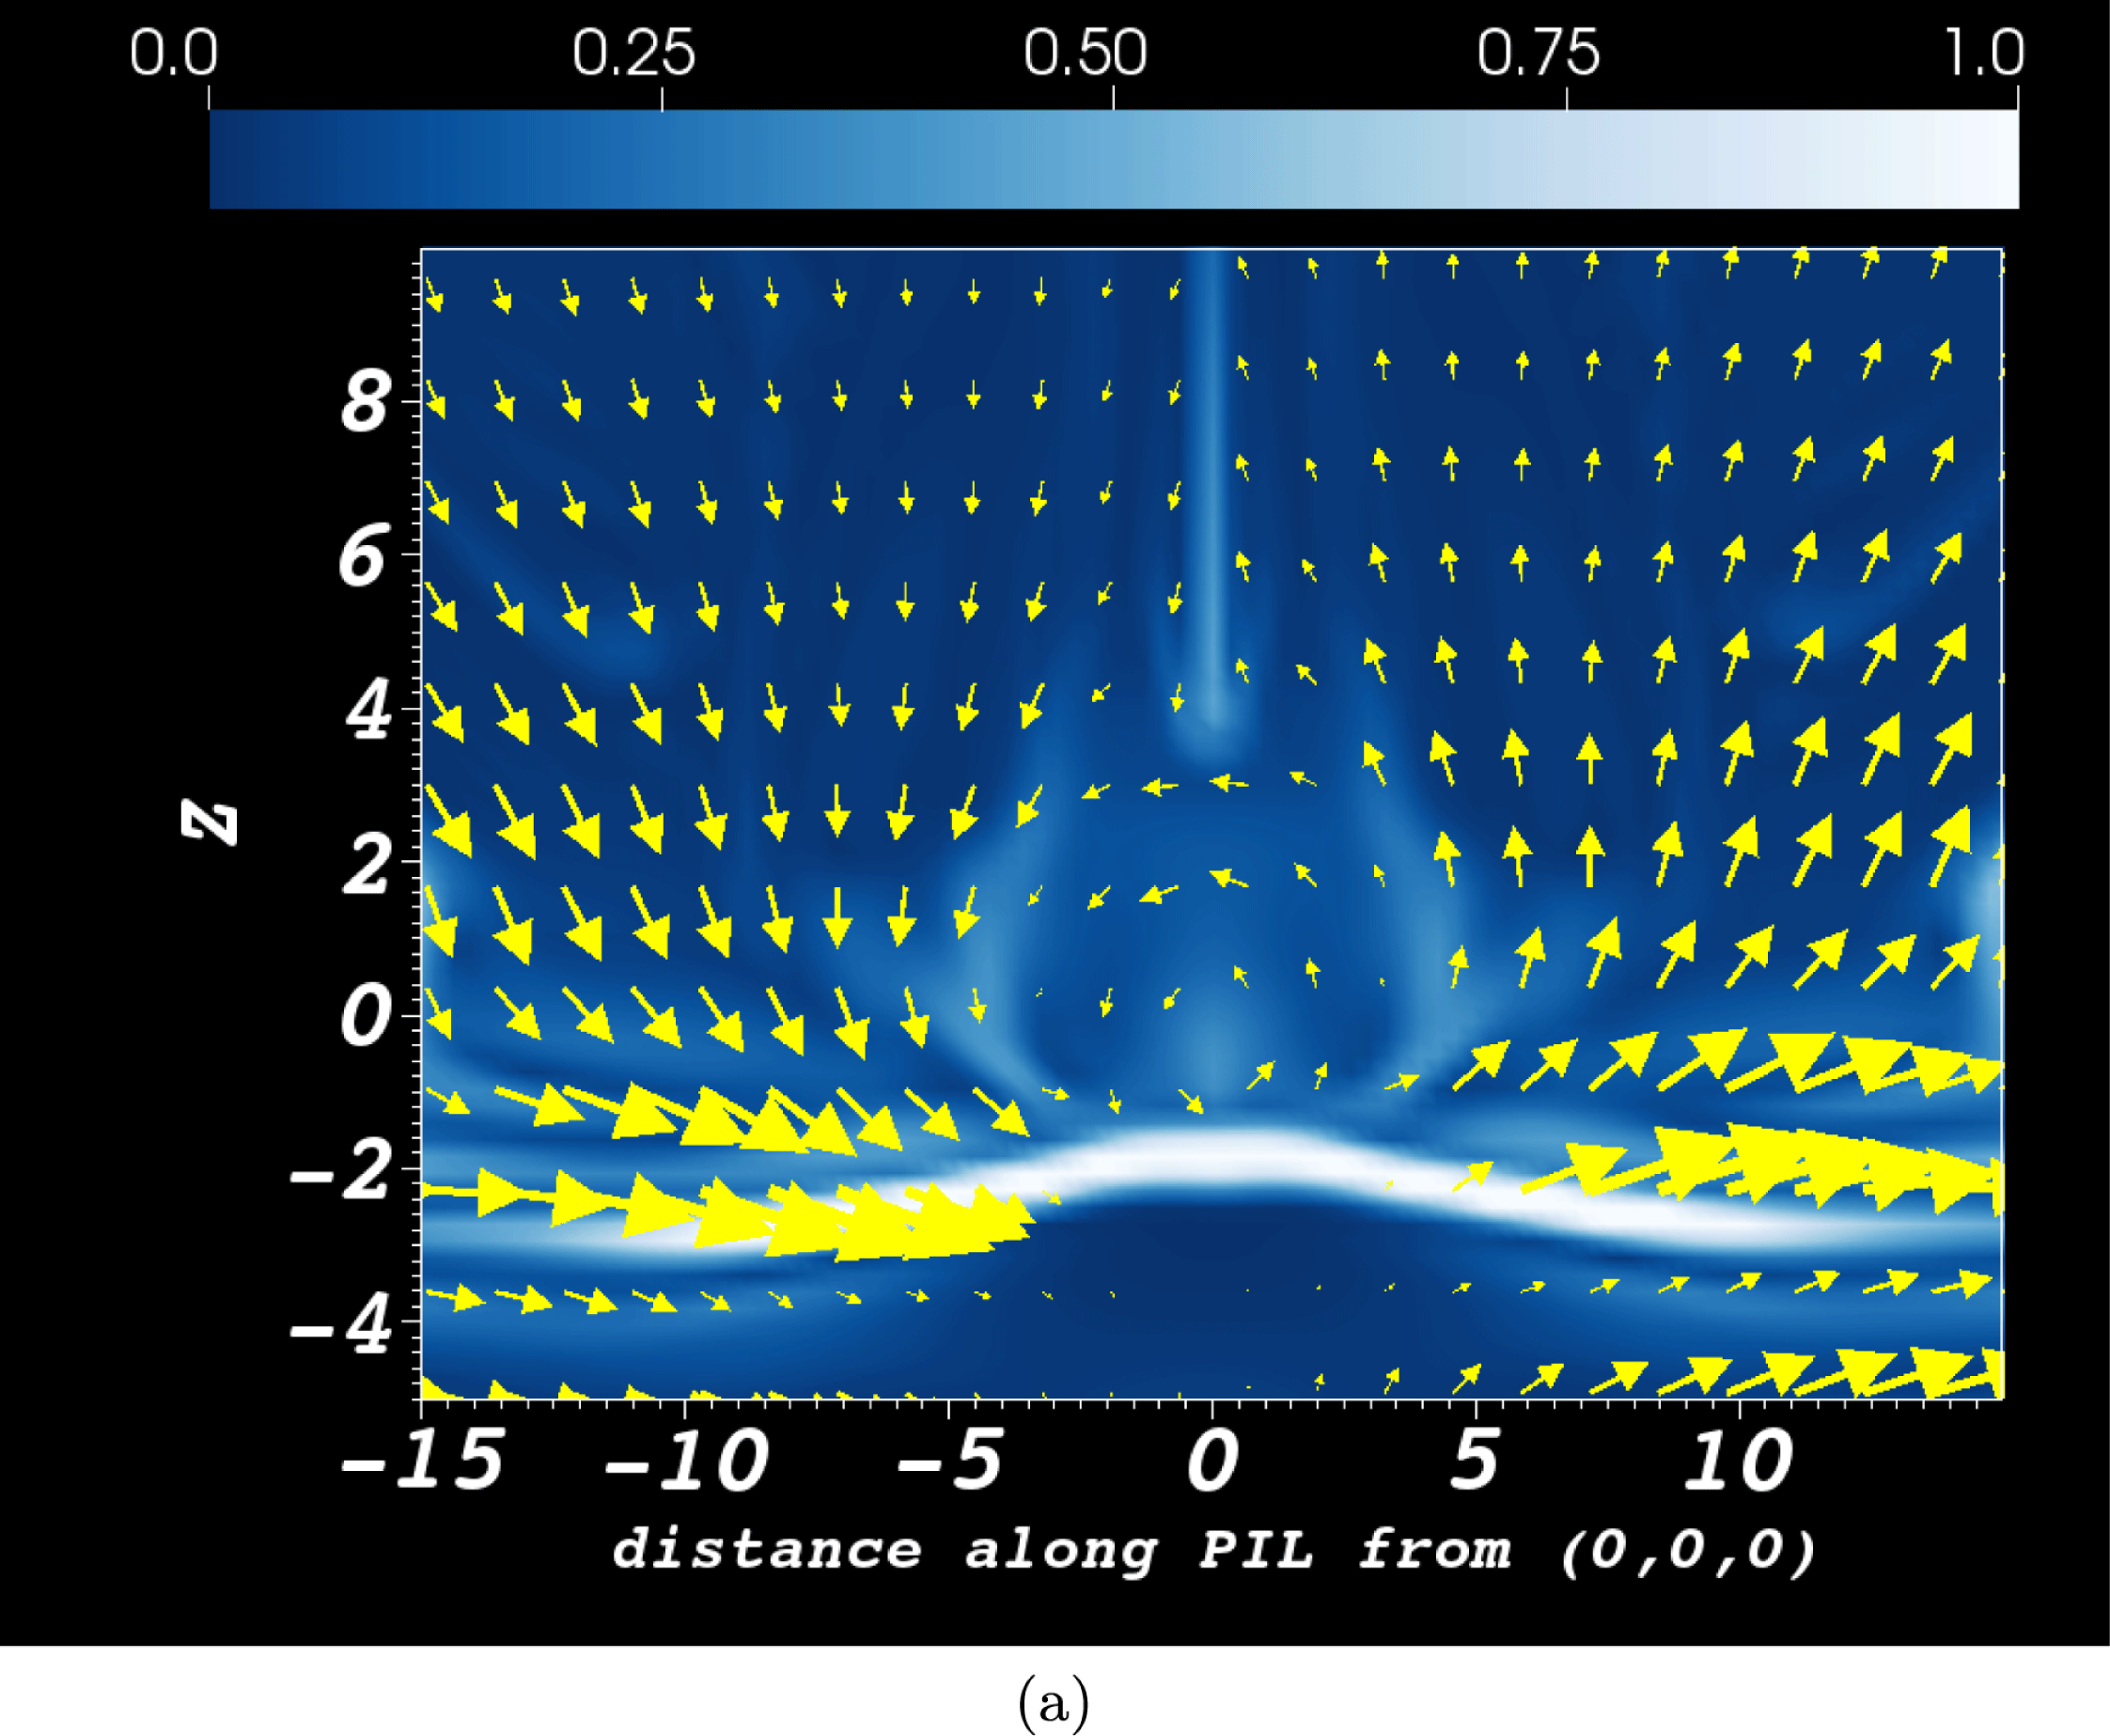
Figure 10. Arrows indicating the magnetic field in the plane orthogonal to the PIL at
![]() $(0,0,0)$
at
$(0,0,0)$
at
![]() $t=67$
. This is superimposed on a plot of the current magnitude in the same plane. The core of the flux rope is clearly visible and is centred at the PIL.
$t=67$
. This is superimposed on a plot of the current magnitude in the same plane. The core of the flux rope is clearly visible and is centred at the PIL.
The fact that the oscillations in helicity (and winding) are sufficient to lead to a sign of input which opposes the field’s chirality is a result of the fact that the bulk of the field’s initially twisted flux rope remains trapped at the photosphere, see figure 10. The plasma
![]() $\unicode[STIX]{x1D6FD}$
$\unicode[STIX]{x1D6FD}$
![]() $(=2p/|\boldsymbol{B}|^{2})$
has a value of approximately 5 at the photosphere in this simulation. This implies that the magnetic field is not dynamically dominant (as in the low-
$(=2p/|\boldsymbol{B}|^{2})$
has a value of approximately 5 at the photosphere in this simulation. This implies that the magnetic field is not dynamically dominant (as in the low-
![]() $\unicode[STIX]{x1D6FD}$
corona) and so can moved by the surrounding plasma. A combination of upward motion, from emergence, and downward motion, from draining plasma (e.g. Hood et al.
Reference Hood, Archontis and MacTaggart2012) causes the flux rope centre (axis) to oscillate about the
$\unicode[STIX]{x1D6FD}$
corona) and so can moved by the surrounding plasma. A combination of upward motion, from emergence, and downward motion, from draining plasma (e.g. Hood et al.
Reference Hood, Archontis and MacTaggart2012) causes the flux rope centre (axis) to oscillate about the
![]() $z=0$
plane. In this topologically simple field (relative to mixed helicity model that we will study shortly) the bulk of the topological information is concentrated at the flux rope centre. Therefore, if the centre crosses the photospheric plane, the response in the helicity and winding rates is large. As mentioned before, it is transport across the photospheric plane and not (un)twisting motions on the plane that causes the largest changes in helicity and winding.
$z=0$
plane. In this topologically simple field (relative to mixed helicity model that we will study shortly) the bulk of the topological information is concentrated at the flux rope centre. Therefore, if the centre crosses the photospheric plane, the response in the helicity and winding rates is large. As mentioned before, it is transport across the photospheric plane and not (un)twisting motions on the plane that causes the largest changes in helicity and winding.
If the plasma
![]() $\unicode[STIX]{x1D6FD}$
were smaller, it would be expected that the oscillations would be less pronounced. In Sturrock et al. (Reference Sturrock, Hood, Archontis and McNeill2015), who perform a very similar simulation but with a flux rope of almost double the initial field strength to the one we consider, they still find oscillations in
$\unicode[STIX]{x1D6FD}$
were smaller, it would be expected that the oscillations would be less pronounced. In Sturrock et al. (Reference Sturrock, Hood, Archontis and McNeill2015), who perform a very similar simulation but with a flux rope of almost double the initial field strength to the one we consider, they still find oscillations in
![]() $\text{d}H/\text{d}t$
but much less pronounced than those found here (their oscillations do not change the sign of the helicity input rate). Two factors are important in contributing to this change in behaviour. The first is that the axes of flux tubes with higher field strengths can emerge further in the atmosphere compared to those with weaker field strengths (MacTaggart & Hood Reference MacTaggart and Hood2009). This makes the flux rope centre further away from the
$\text{d}H/\text{d}t$
but much less pronounced than those found here (their oscillations do not change the sign of the helicity input rate). Two factors are important in contributing to this change in behaviour. The first is that the axes of flux tubes with higher field strengths can emerge further in the atmosphere compared to those with weaker field strengths (MacTaggart & Hood Reference MacTaggart and Hood2009). This makes the flux rope centre further away from the
![]() $z=0$
plane and so there is less flux crossing the plane in any partial submergence event. Secondly, the plasma
$z=0$
plane and so there is less flux crossing the plane in any partial submergence event. Secondly, the plasma
![]() $\unicode[STIX]{x1D6FD}$
is smaller and the magnetic field is less susceptible to surrounding plasma motions.
$\unicode[STIX]{x1D6FD}$
is smaller and the magnetic field is less susceptible to surrounding plasma motions.
5.3 Tracking the moving photosphere
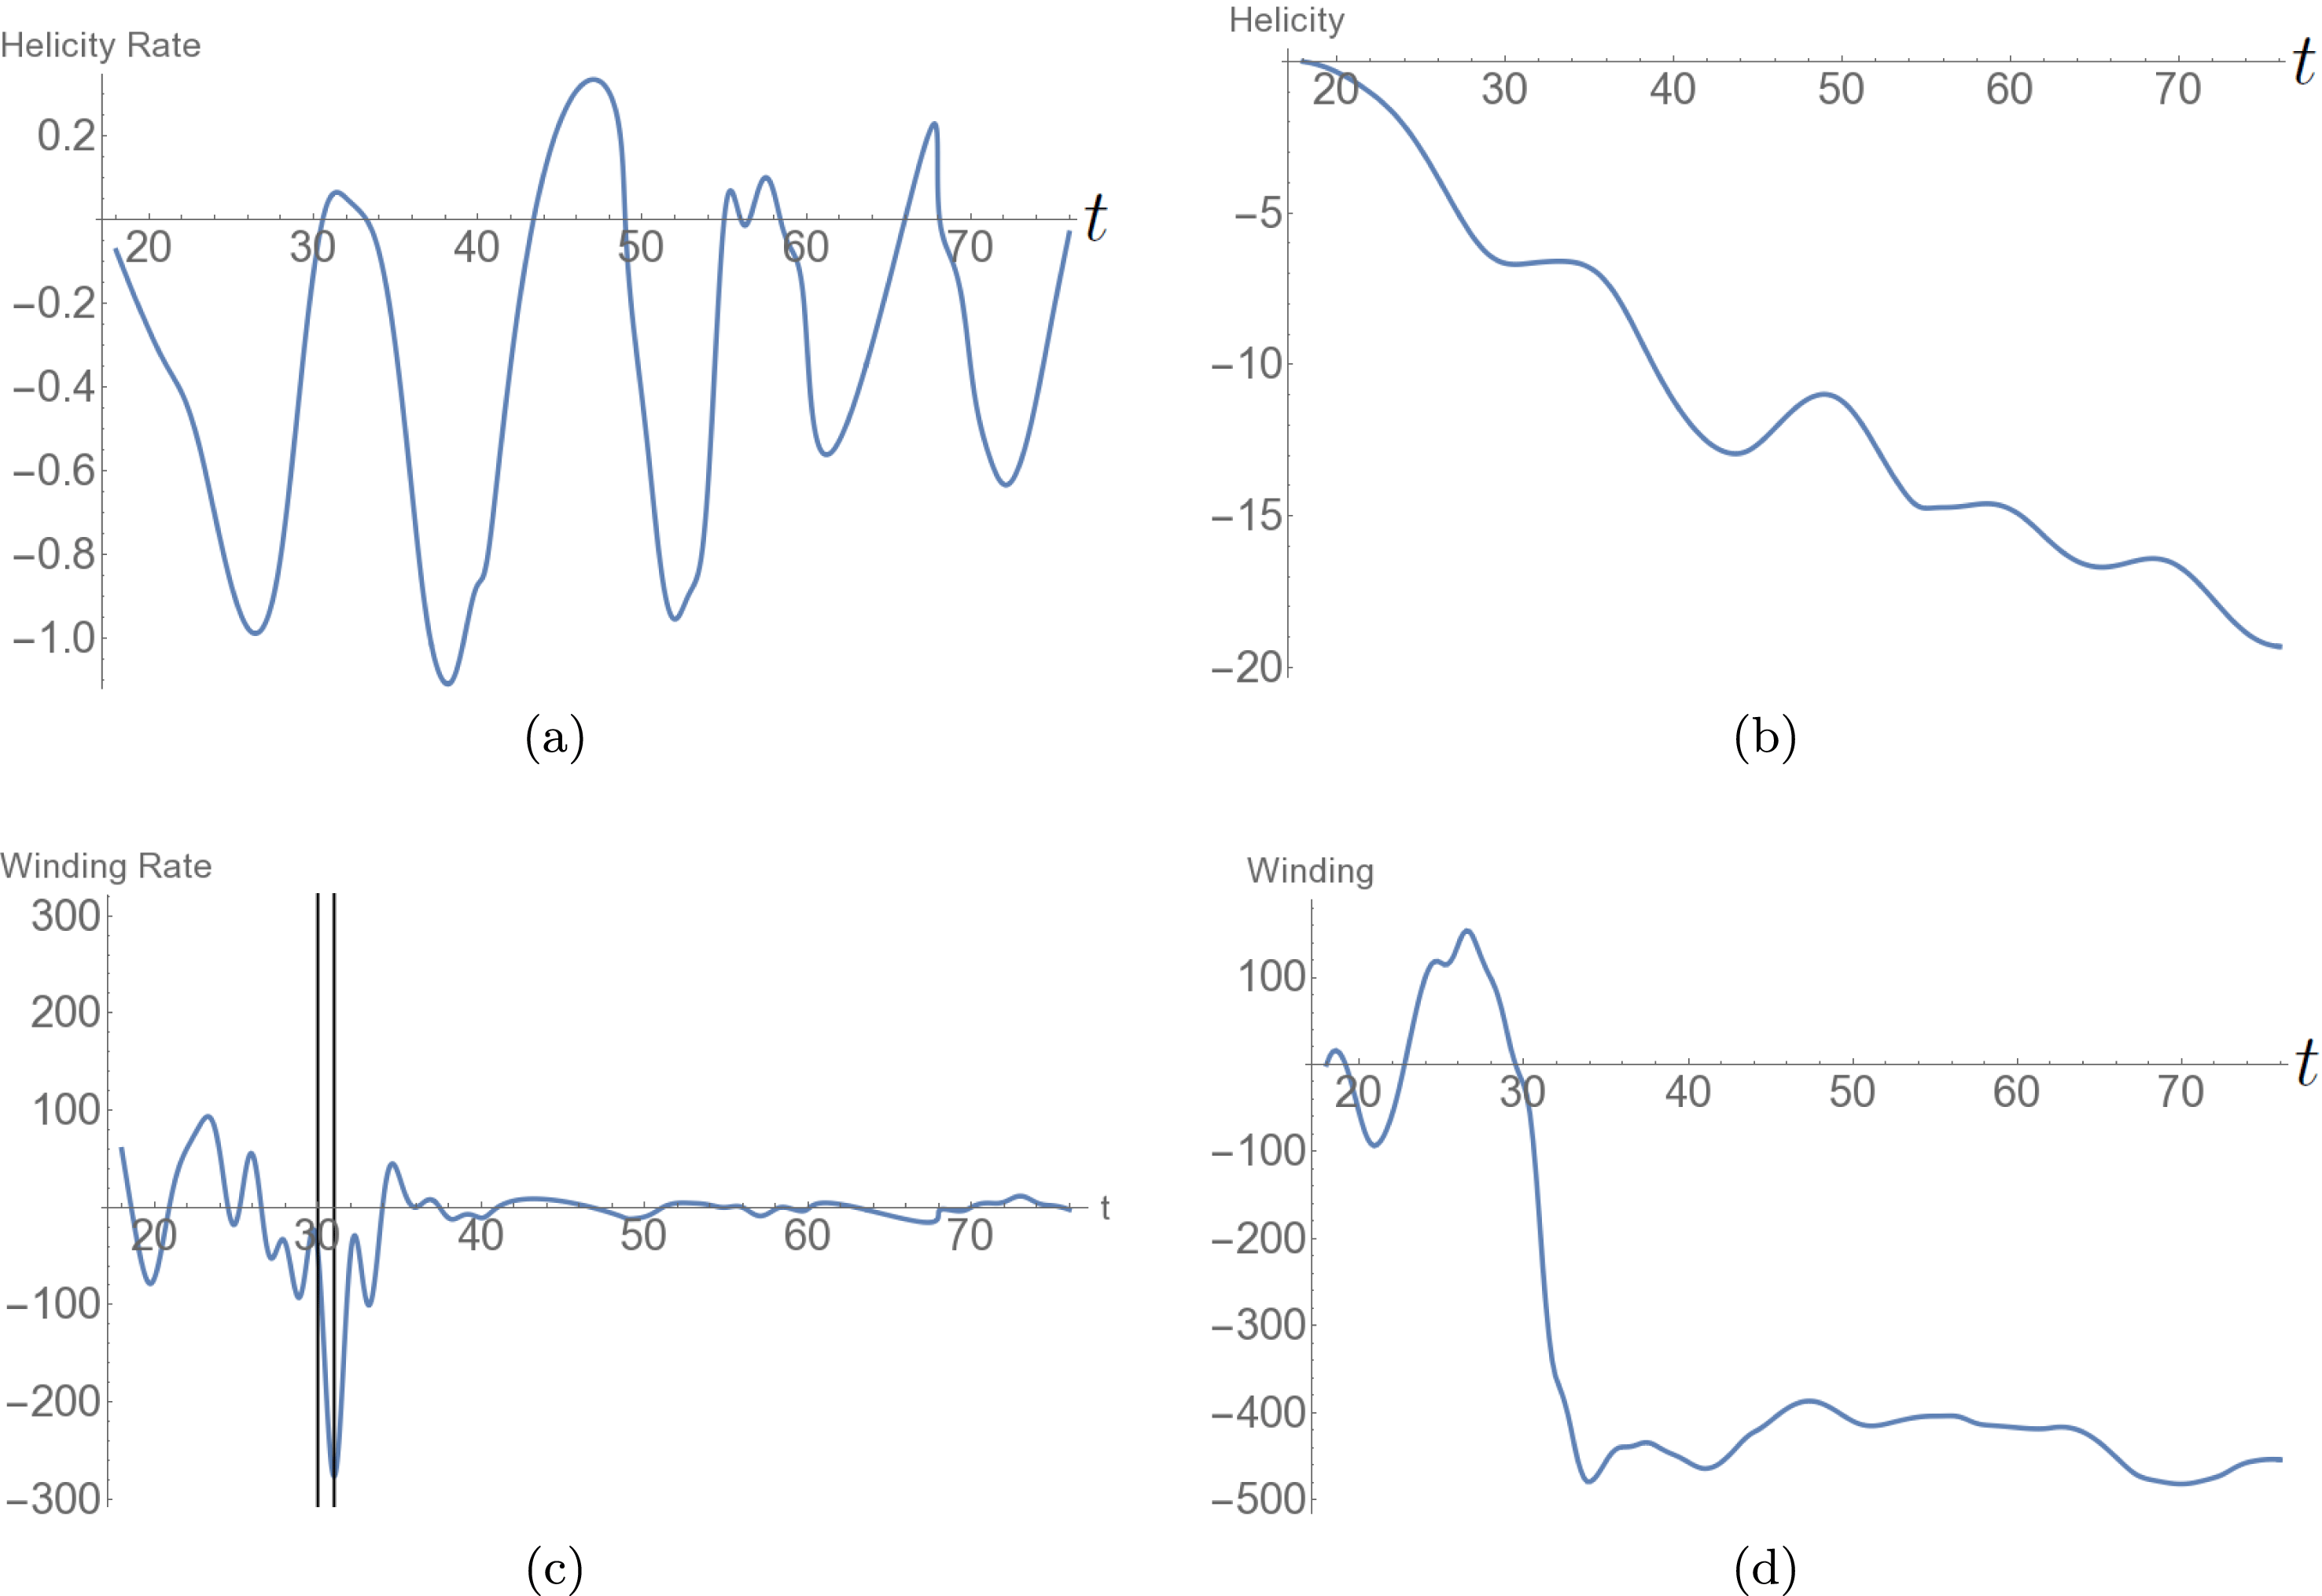
Figure 11. Photospheric helicity and winding inputs for the emergence of the twisted field which account for the tracking of the changing photosphere geometry. (a) The helicity input rate
![]() $\text{d}H_{v}/\text{d}t$
. (b) The net helicity input
$\text{d}H_{v}/\text{d}t$
. (b) The net helicity input
![]() $H_{v}(t)$
. (c) The winding input rate
$H_{v}(t)$
. (c) The winding input rate
![]() $\text{d}L_{v}/\text{d}t$
. The vertical lines are at times
$\text{d}L_{v}/\text{d}t$
. The vertical lines are at times
![]() $t=30,31$
when the field structure is analysed further in what follows. (d) The total winding input
$t=30,31$
when the field structure is analysed further in what follows. (d) The total winding input
![]() $L_{v}(t)$
.
$L_{v}(t)$
.
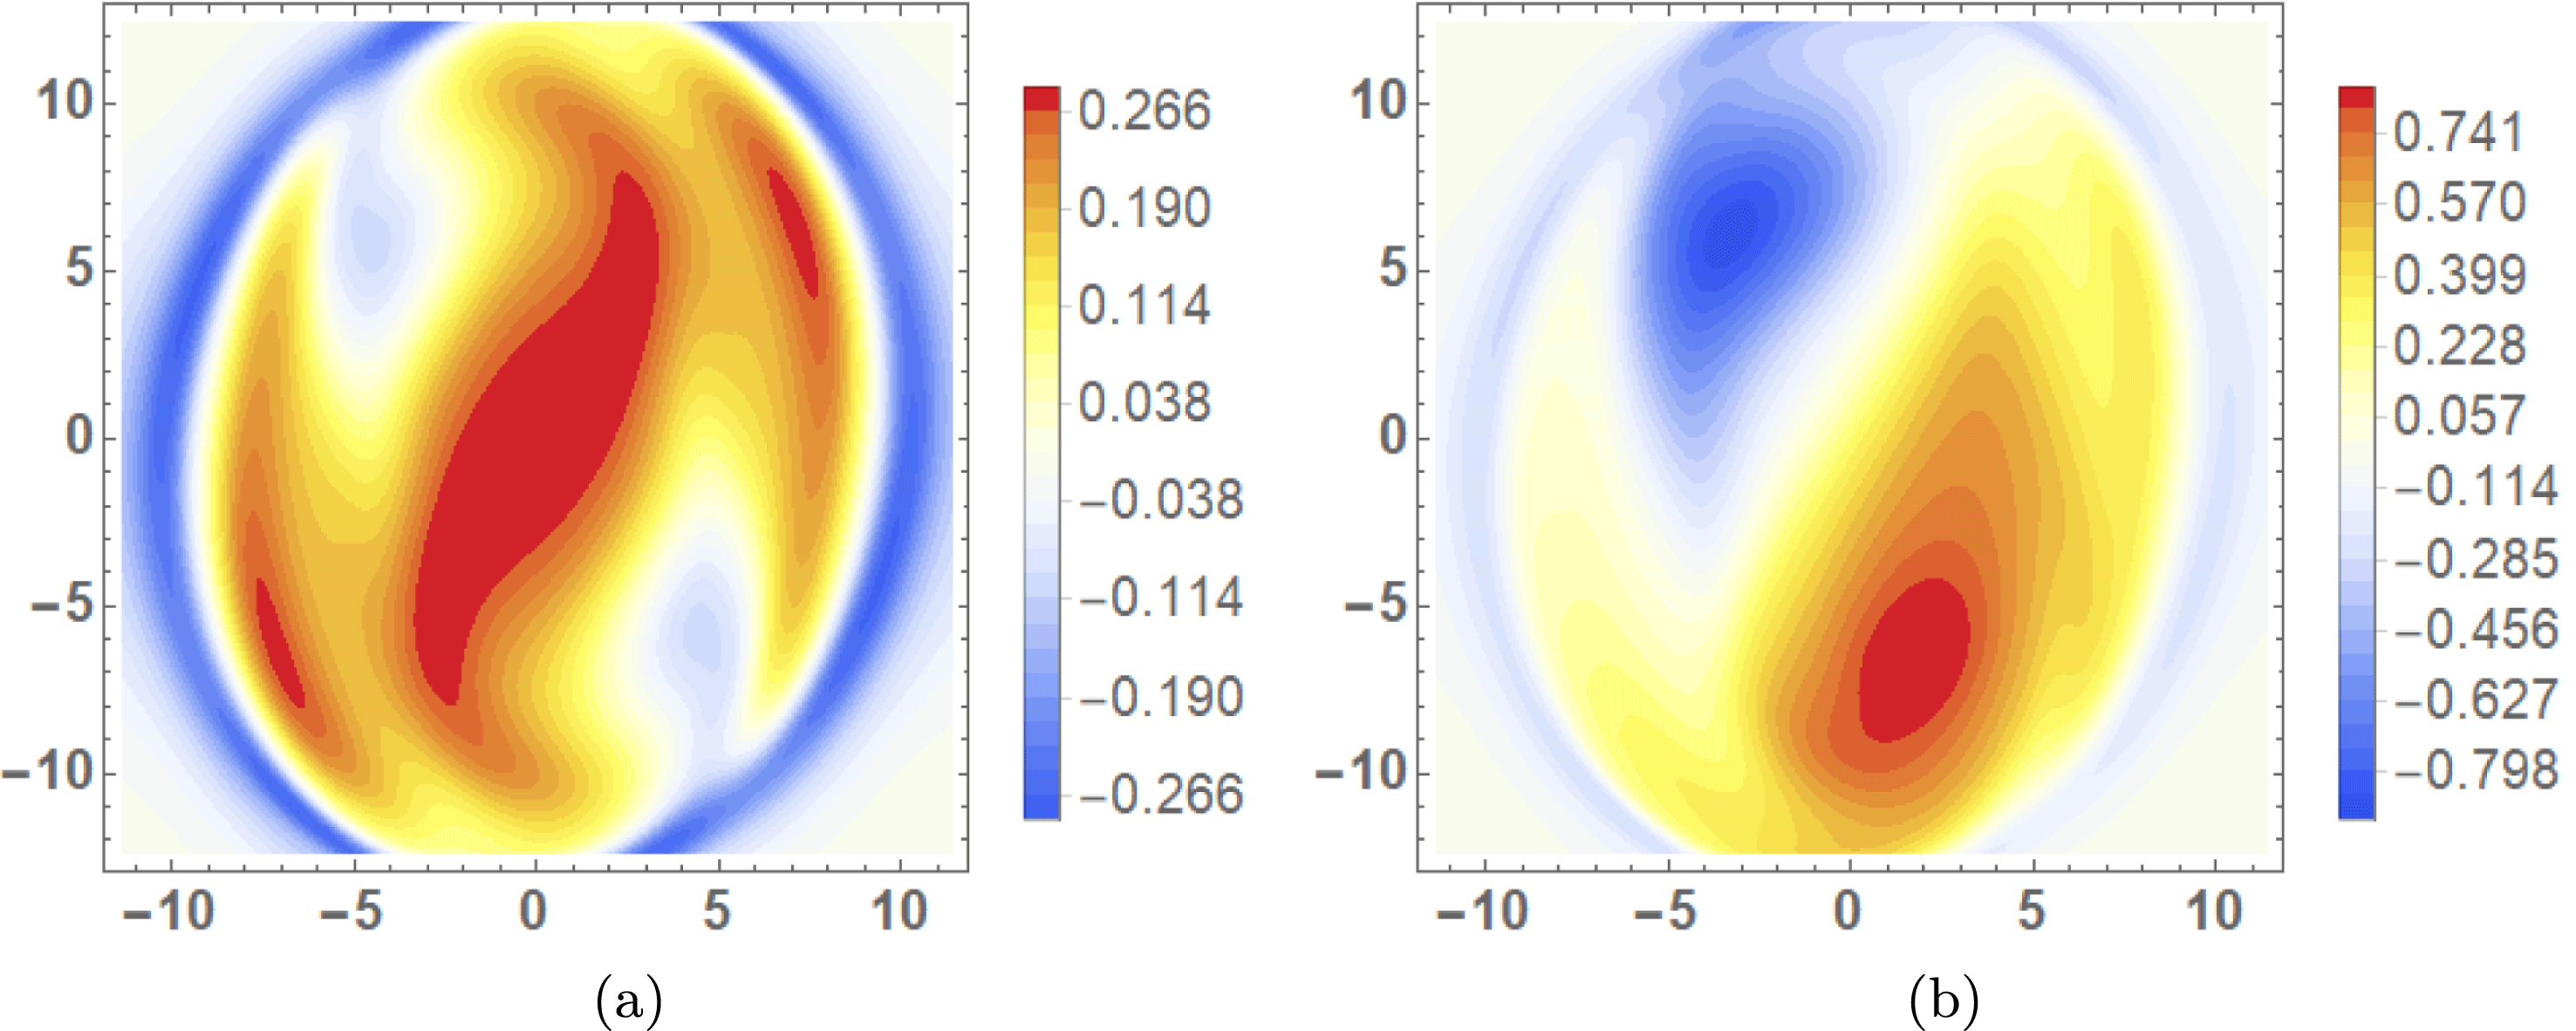
Figure 12. Vertical velocity distributions at
![]() $t=28$
. (a) The velocity density
$t=28$
. (a) The velocity density
![]() $u_{z}(P_{v}(x,y))J$
at the moving photosphere line
$u_{z}(P_{v}(x,y))J$
at the moving photosphere line
![]() $\unicode[STIX]{x1D70C}=1$
. (b) The difference between the varying photosphere velocity density
$\unicode[STIX]{x1D70C}=1$
. (b) The difference between the varying photosphere velocity density
![]() $u_{z}(P_{v}(x,y))J$
and the
$u_{z}(P_{v}(x,y))J$
and the
![]() $z=0$
velocity density
$z=0$
velocity density
![]() $u_{z}(x,y)$
.
$u_{z}(x,y)$
.
The velocity flux oscillations indicated in figure 9 imply that the surface
![]() $\unicode[STIX]{x1D70C}=1$
will be varying in space and time. As discussed in the introduction, we can track this variation and calculate modified quantities which account for this motion. The time series of the adjusted quantities
$\unicode[STIX]{x1D70C}=1$
will be varying in space and time. As discussed in the introduction, we can track this variation and calculate modified quantities which account for this motion. The time series of the adjusted quantities
![]() $\text{d}H_{v}/\text{d}t$
,
$\text{d}H_{v}/\text{d}t$
,
![]() $H_{v}$
,
$H_{v}$
,
![]() $\text{d}L_{v}/\text{d}t$
and
$\text{d}L_{v}/\text{d}t$
and
![]() $L_{v}$
are shown in figure 11. On a qualitative level, the helicity time series (panels (a,b) respectively) are effectively the same as the
$L_{v}$
are shown in figure 11. On a qualitative level, the helicity time series (panels (a,b) respectively) are effectively the same as the
![]() $z=0$
calculations shown in figure 3. The magnitudes, however, of the various peaks of the input rate
$z=0$
calculations shown in figure 3. The magnitudes, however, of the various peaks of the input rate
![]() $\text{d}H_{v}/\text{d}t$
are roughly four times larger than those of
$\text{d}H_{v}/\text{d}t$
are roughly four times larger than those of
![]() $\text{d}H/\text{d}t$
. This magnification is due to increased variations in velocities at the
$\text{d}H/\text{d}t$
. This magnification is due to increased variations in velocities at the
![]() $\unicode[STIX]{x1D70C}=1$
surface. As an example, figure 12 displays the varying photosphere velocity distribution
$\unicode[STIX]{x1D70C}=1$
surface. As an example, figure 12 displays the varying photosphere velocity distribution
![]() $Ju_{z}(P_{v}(x,y))$
in (a) and the difference
$Ju_{z}(P_{v}(x,y))$
in (a) and the difference
![]() $Ju_{z}(P_{v}(x,y))-u_{z}(x,y)$
between the moving surface and static surface velocity distributions in (b). In (a), the strongest velocities are, as before, at the PIL. In (b), major differences are at the main footpoints. We note that the differences can be greater in magnitude than a typical velocity
$Ju_{z}(P_{v}(x,y))-u_{z}(x,y)$
between the moving surface and static surface velocity distributions in (b). In (a), the strongest velocities are, as before, at the PIL. In (b), major differences are at the main footpoints. We note that the differences can be greater in magnitude than a typical velocity
![]() $Ju_{z}(P_{v}(x,y))$
. Therefore, it is not simply a case of larger velocity magnitudes at the
$Ju_{z}(P_{v}(x,y))$
. Therefore, it is not simply a case of larger velocity magnitudes at the
![]() $\unicode[STIX]{x1D70C}=1$
surface compared to the
$\unicode[STIX]{x1D70C}=1$
surface compared to the
![]() $z=0$
plane, rather a difference in the distribution of flows on these surfaces.
$z=0$
plane, rather a difference in the distribution of flows on these surfaces.
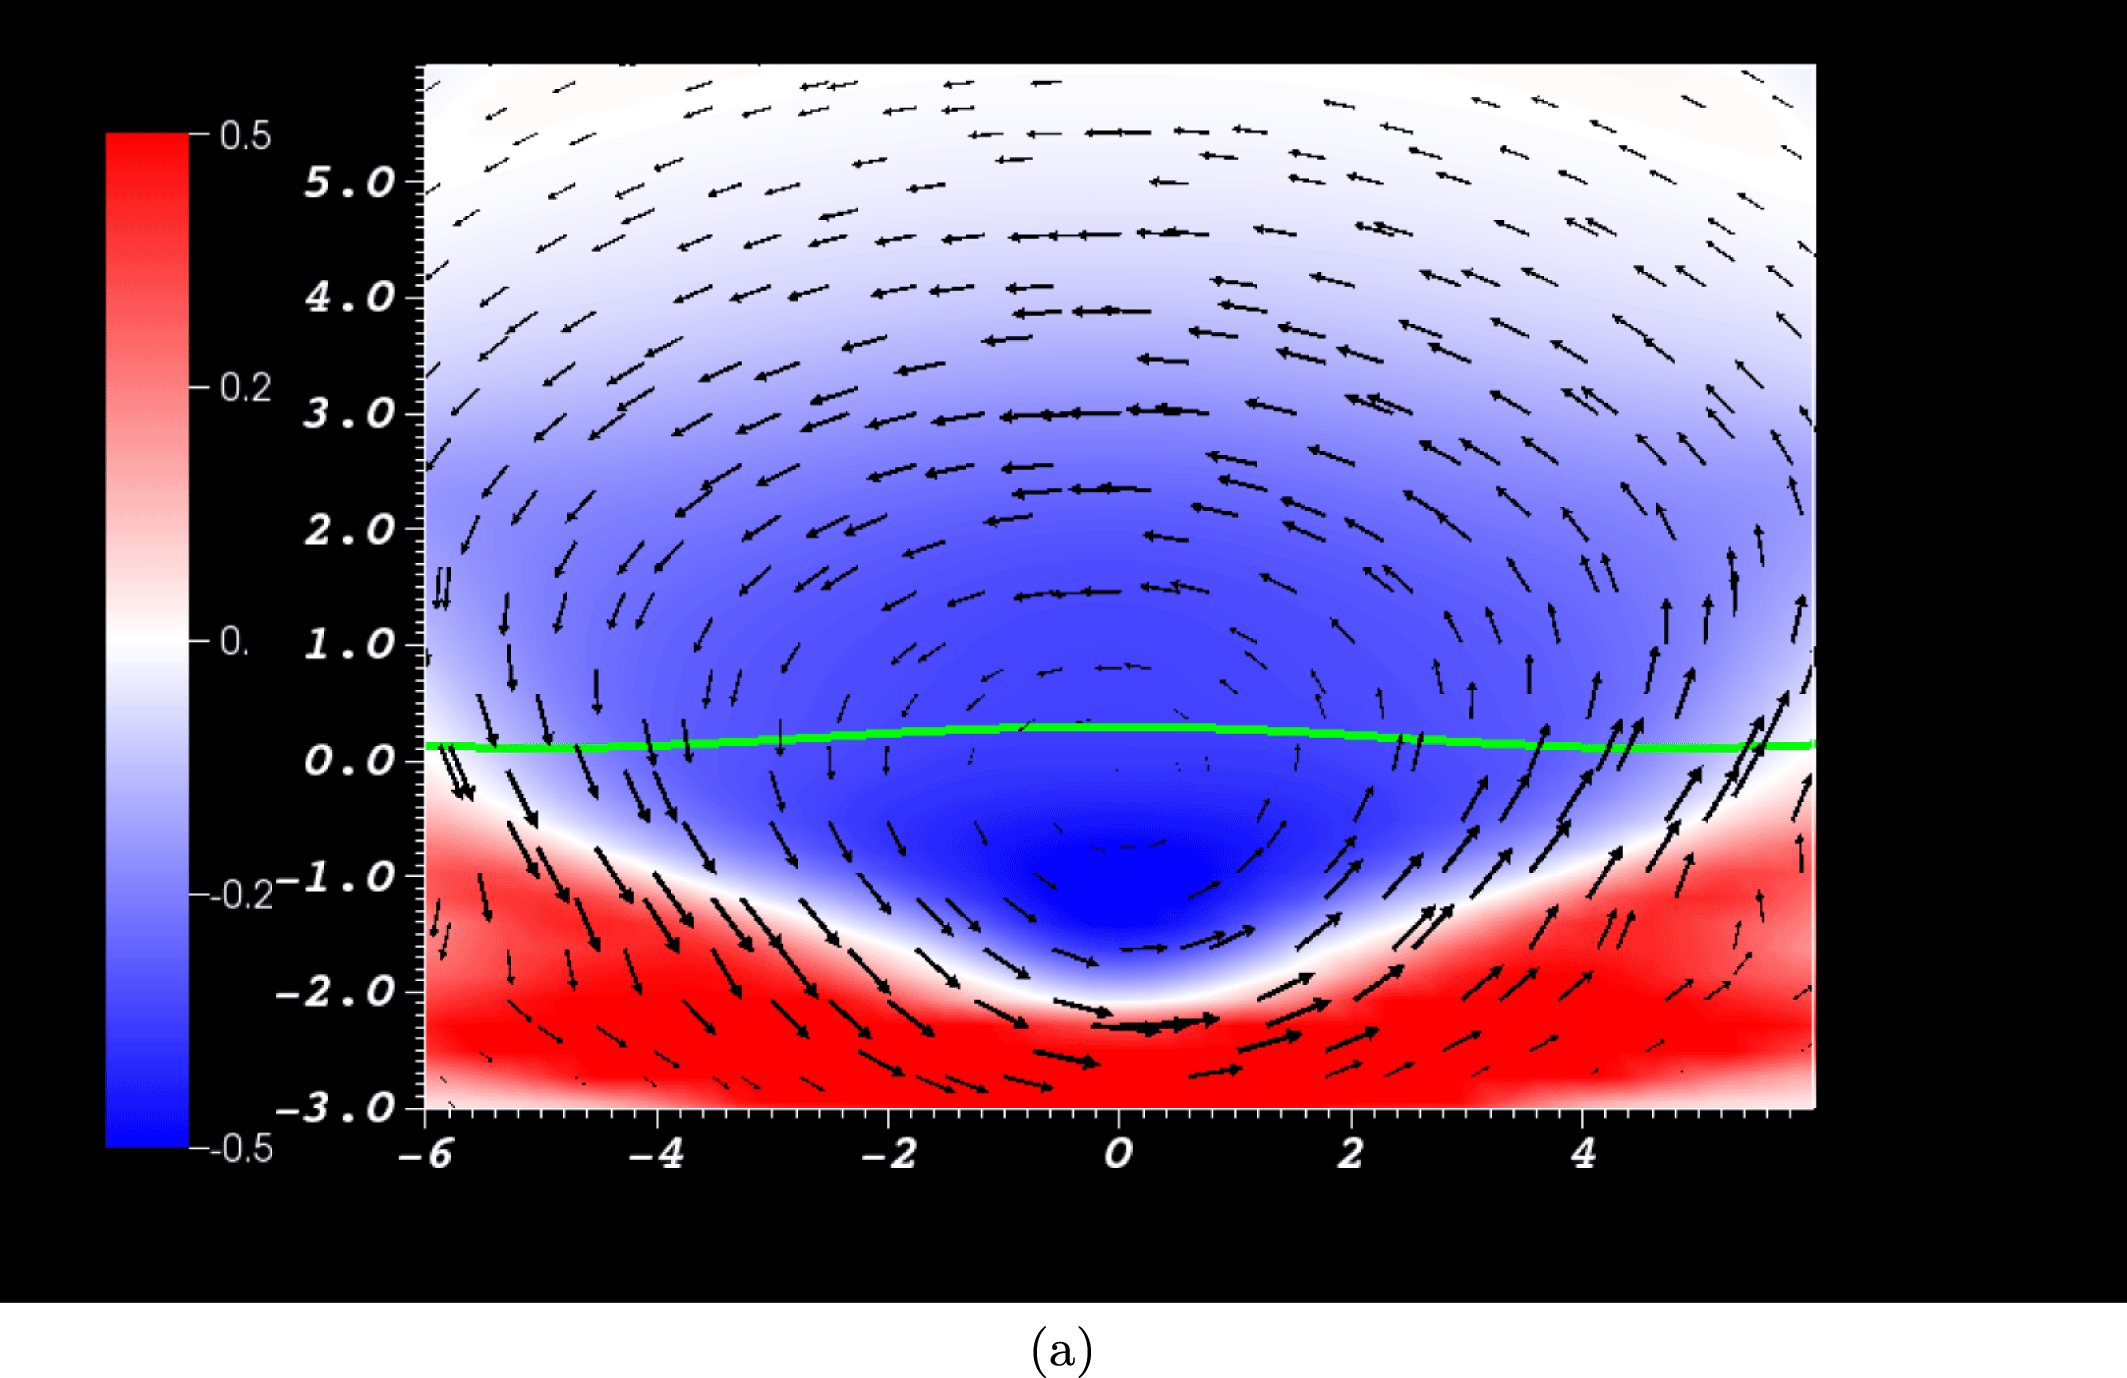
Figure 13. A slice of the vector field in the plane orthogonal to the PIL at
![]() $t=30$
, just prior to the spike in the time series
$t=30$
, just prior to the spike in the time series
![]() $\text{d}L_{v}/\text{d}t$
shown in figure 11(c). Also shown as a green curve is the intersection of the surface
$\text{d}L_{v}/\text{d}t$
shown in figure 11(c). Also shown as a green curve is the intersection of the surface
![]() $P_{v}$
and this plane. The background distribution is the out of plane component of the current density.
$P_{v}$
and this plane. The background distribution is the out of plane component of the current density.
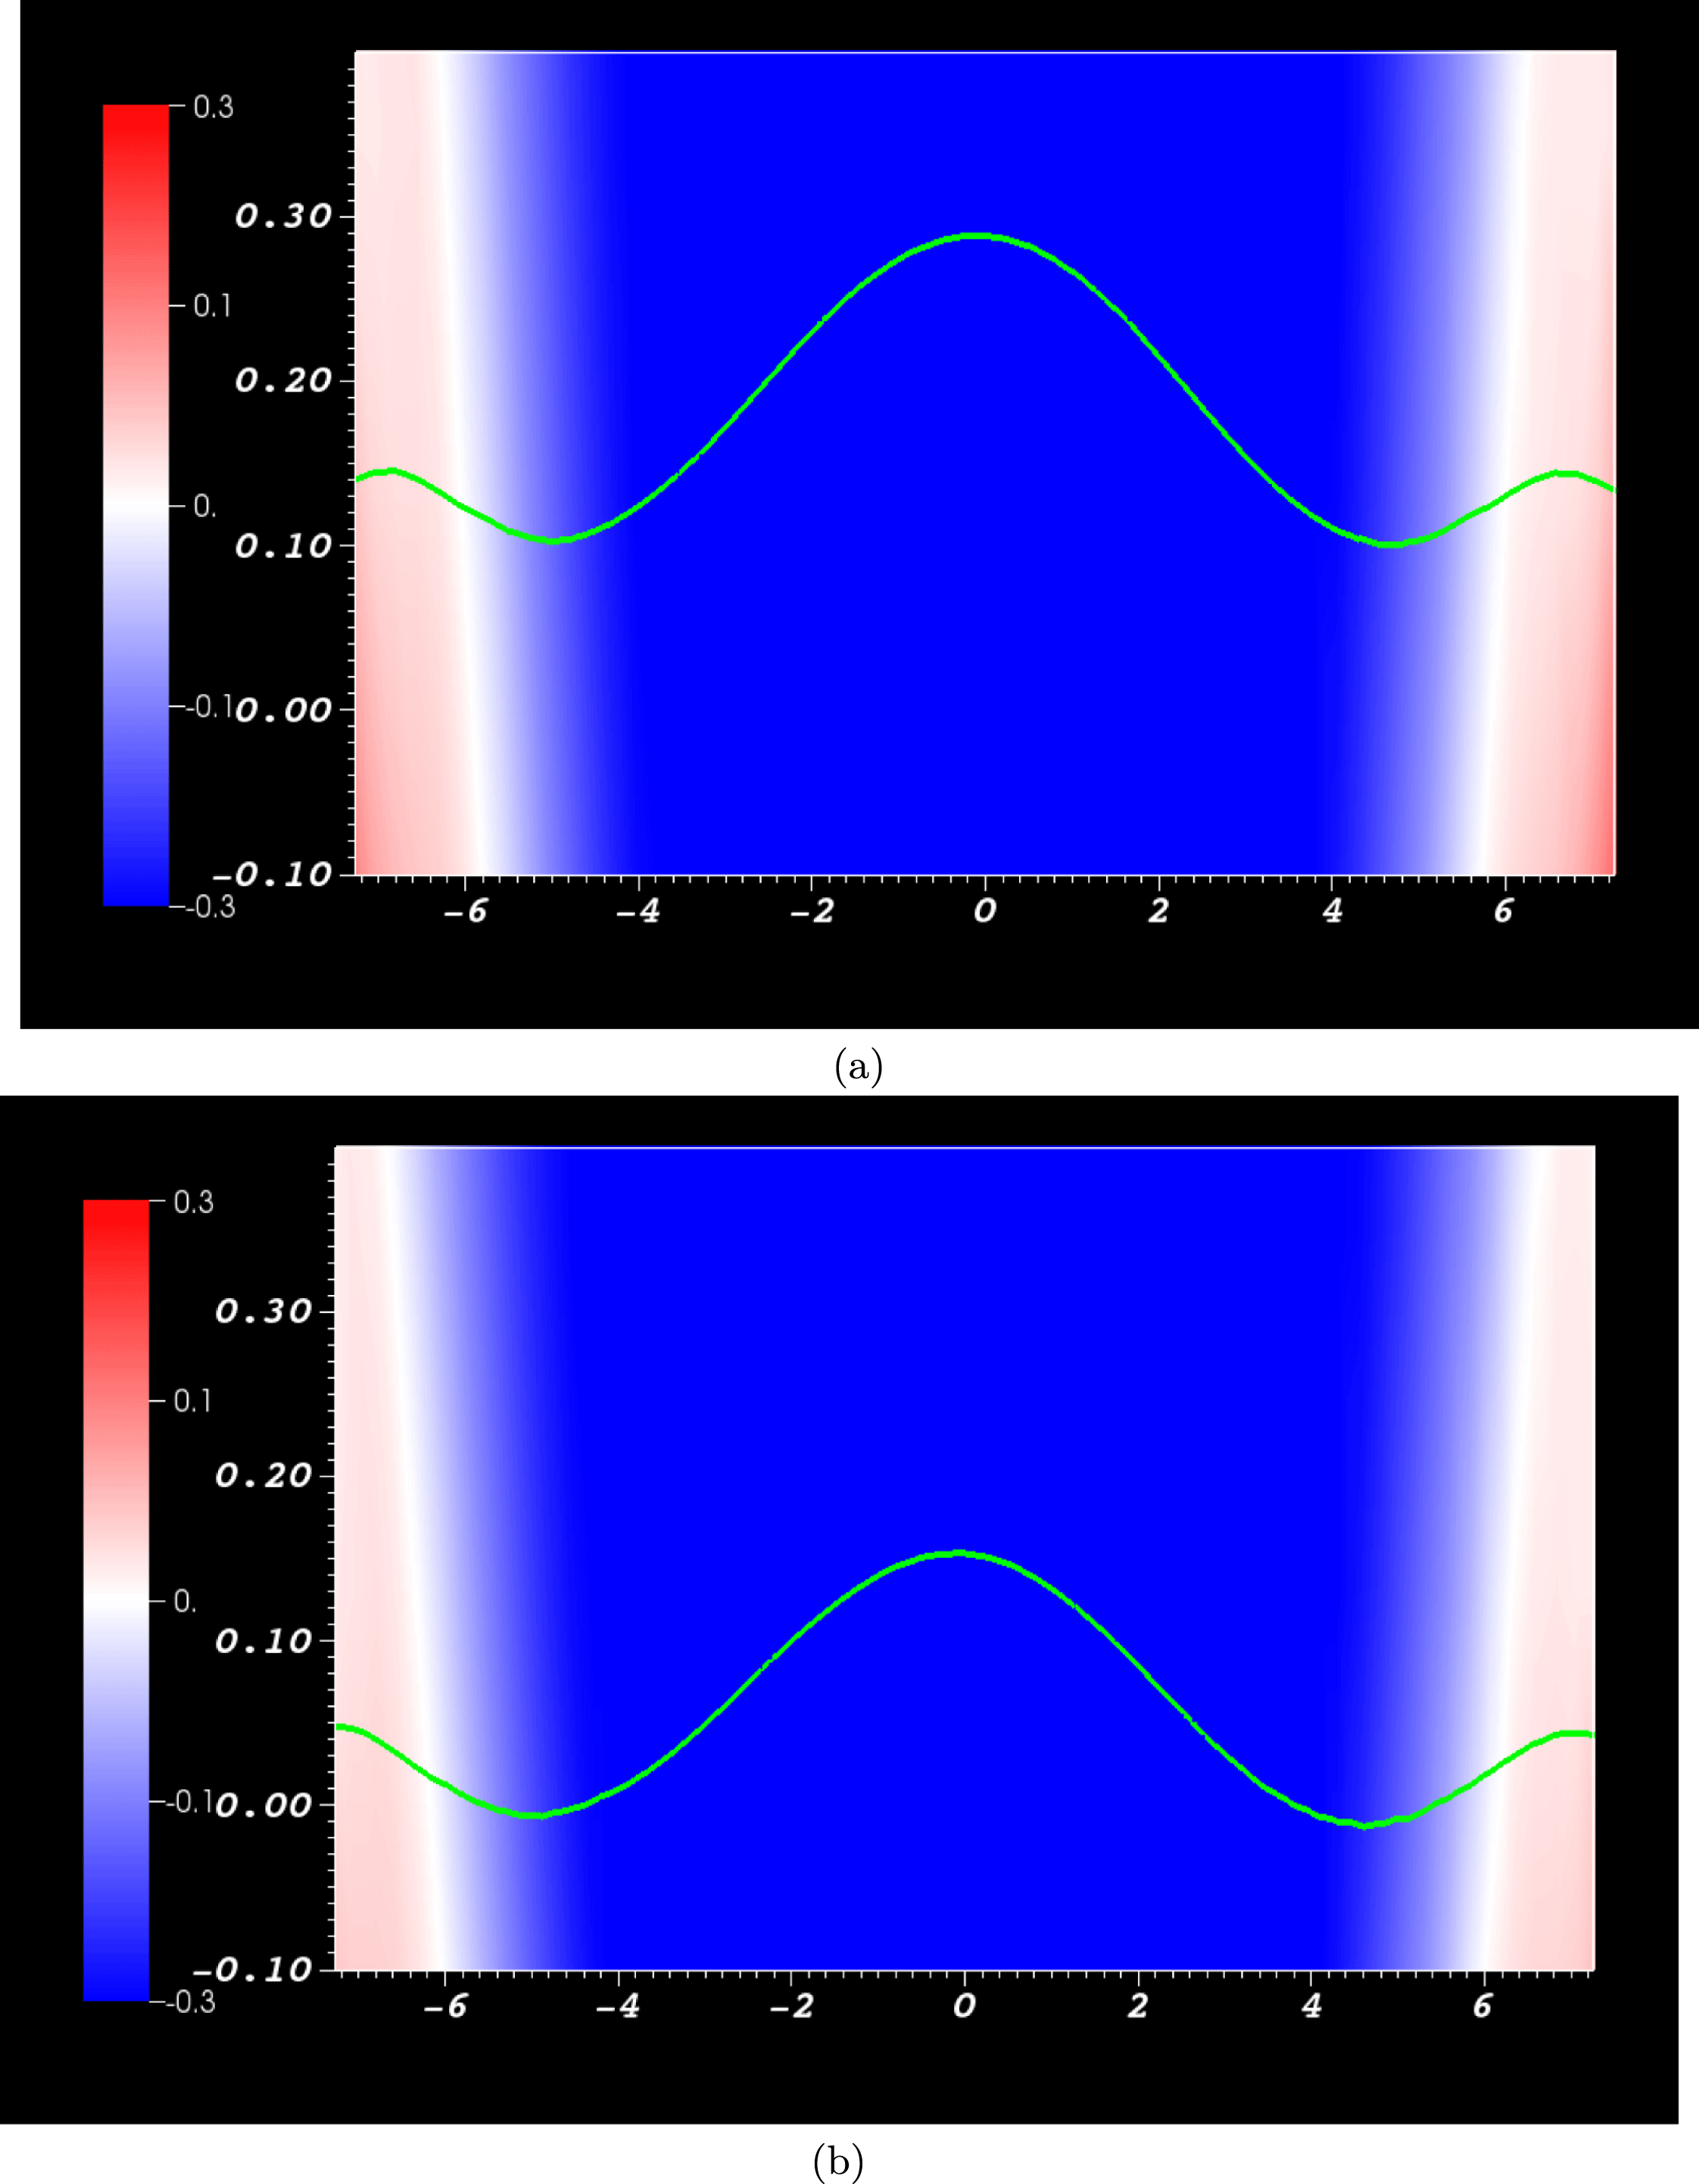
Figure 14. Magnified representations of a slice of the vector field in the plane orthogonal to the PIL at
![]() $t=30$
and
$t=30$
and
![]() $t=31$
, prior to and at the spike in the time series
$t=31$
, prior to and at the spike in the time series
![]() $\text{d}L_{v}/\text{d}t$
shown in figure 11(d). Shown as a green curve is the intersection of the surface
$\text{d}L_{v}/\text{d}t$
shown in figure 11(d). Shown as a green curve is the intersection of the surface
![]() $P_{v}$
and this plane. The background distribution is the out of plane component of the current density. (a) shows (
$P_{v}$
and this plane. The background distribution is the out of plane component of the current density. (a) shows (
![]() $t=30$
) a magnification of the region of figure 13 which contains the curve
$t=30$
) a magnification of the region of figure 13 which contains the curve
![]() $\unicode[STIX]{x1D70C}=1$
. (b) shows (
$\unicode[STIX]{x1D70C}=1$
. (b) shows (
![]() $t=31$
) the same distribution as in (a) but at the time of the spike. The
$t=31$
) the same distribution as in (a) but at the time of the spike. The
![]() $\unicode[STIX]{x1D70C}=1$
curve has dropped vertically by a value of approximately
$\unicode[STIX]{x1D70C}=1$
curve has dropped vertically by a value of approximately
![]() $0.5$
.
$0.5$
.
The winding time series, panels (c,d) of figure 9, show significant qualitative differences compared to the
![]() $z=0$
input calculations shown in panels (c,d) of figure 3. There is one significant period of negative input rate
$z=0$
input calculations shown in panels (c,d) of figure 3. There is one significant period of negative input rate
![]() $\text{d}L_{v}/\text{d}t$
at
$\text{d}L_{v}/\text{d}t$
at
![]() $t=31$
. This is near the end of the period when the central part of the field (containing the original tube axis) emerges at the photosphere (see figure 13). The spike coincides with a relatively sharp (negative) change in the height of the
$t=31$
. This is near the end of the period when the central part of the field (containing the original tube axis) emerges at the photosphere (see figure 13). The spike coincides with a relatively sharp (negative) change in the height of the
![]() $\unicode[STIX]{x1D70C}=1$
surface from
$\unicode[STIX]{x1D70C}=1$
surface from
![]() $t=30$
(figure 14
a) to
$t=30$
(figure 14
a) to
![]() $t=31$
(figure 14
b). This change results in a significant change in the negative helicity input as the flux rope core moves further beyond the photospheric boundary. It was confirmed that this jump in the moving photospheric surface was atypically large from
$t=31$
(figure 14
b). This change results in a significant change in the negative helicity input as the flux rope core moves further beyond the photospheric boundary. It was confirmed that this jump in the moving photospheric surface was atypically large from
![]() $t=30$
to
$t=30$
to
![]() $t=31$
by comparison to typical changes in its morphology over single time step of size
$t=31$
by comparison to typical changes in its morphology over single time step of size
![]() $1$
. After this, the input rate
$1$
. After this, the input rate
![]() $\text{d}L_{v}/\text{d}t$
falls to a relatively small rate. It is interesting to note that this occurs due to a relatively fast change in the geometry of the
$\text{d}L_{v}/\text{d}t$
falls to a relatively small rate. It is interesting to note that this occurs due to a relatively fast change in the geometry of the
![]() $\unicode[STIX]{x1D70C}=1$
surface, rather than a sudden change in field topology, indicating that this may be an important factor in interpreting observational inputs of field topology. The oscillations shown in the helicity input rate
$\unicode[STIX]{x1D70C}=1$
surface, rather than a sudden change in field topology, indicating that this may be an important factor in interpreting observational inputs of field topology. The oscillations shown in the helicity input rate
![]() $\text{d}H_{v}/\text{d}t$
are still present but, as shown in figure 11(d), these have a small effect on the net helicity injected into the photosphere, by comparison to the sharp negative input around
$\text{d}H_{v}/\text{d}t$
are still present but, as shown in figure 11(d), these have a small effect on the net helicity injected into the photosphere, by comparison to the sharp negative input around
![]() $t=30$
.
$t=30$
.
It is intriguing that the (moving photosphere) winding input more clearly represents the transition between the emergence of the field’s twisted core to the photosphere (the
![]() $\unicode[STIX]{x1D70C}=1$
surface) followed by the lack of changing topological input due to the core getting stuck at this surface. The significantly reduced (at least on a relative scale) size of the oscillations in comparison to the helicity input results from the lack of field strength weighting in the winding input. The inclusion of field strength in the helicity input rate magnifies the oscillatory signal due to the central core of the field being immediately surrounded by strong field – slight dips under the photospheric boundary produce high signals because of the strong field strengths. Another way to view this result is that the winding input treats the oscillation at the photosphere as not especially interesting at later times as it is not really indicating the input of new topological information into the atmosphere.
$\unicode[STIX]{x1D70C}=1$
surface) followed by the lack of changing topological input due to the core getting stuck at this surface. The significantly reduced (at least on a relative scale) size of the oscillations in comparison to the helicity input results from the lack of field strength weighting in the winding input. The inclusion of field strength in the helicity input rate magnifies the oscillatory signal due to the central core of the field being immediately surrounded by strong field – slight dips under the photospheric boundary produce high signals because of the strong field strengths. Another way to view this result is that the winding input treats the oscillation at the photosphere as not especially interesting at later times as it is not really indicating the input of new topological information into the atmosphere.
5.4 Mixed helicity emergence
We now consider a mixed helicity field
![]() $\boldsymbol{B}_{b}$
, specified by (3.23) with
$\boldsymbol{B}_{b}$
, specified by (3.23) with
![]() $n=2$
. The emergence of mixed helicity (braided) magnetic fields and their associated dynamics was first described in Prior & MacTaggart (Reference Prior and MacTaggart2016).
$n=2$
. The emergence of mixed helicity (braided) magnetic fields and their associated dynamics was first described in Prior & MacTaggart (Reference Prior and MacTaggart2016).
5.4.1 Physical characteristics of the emergence
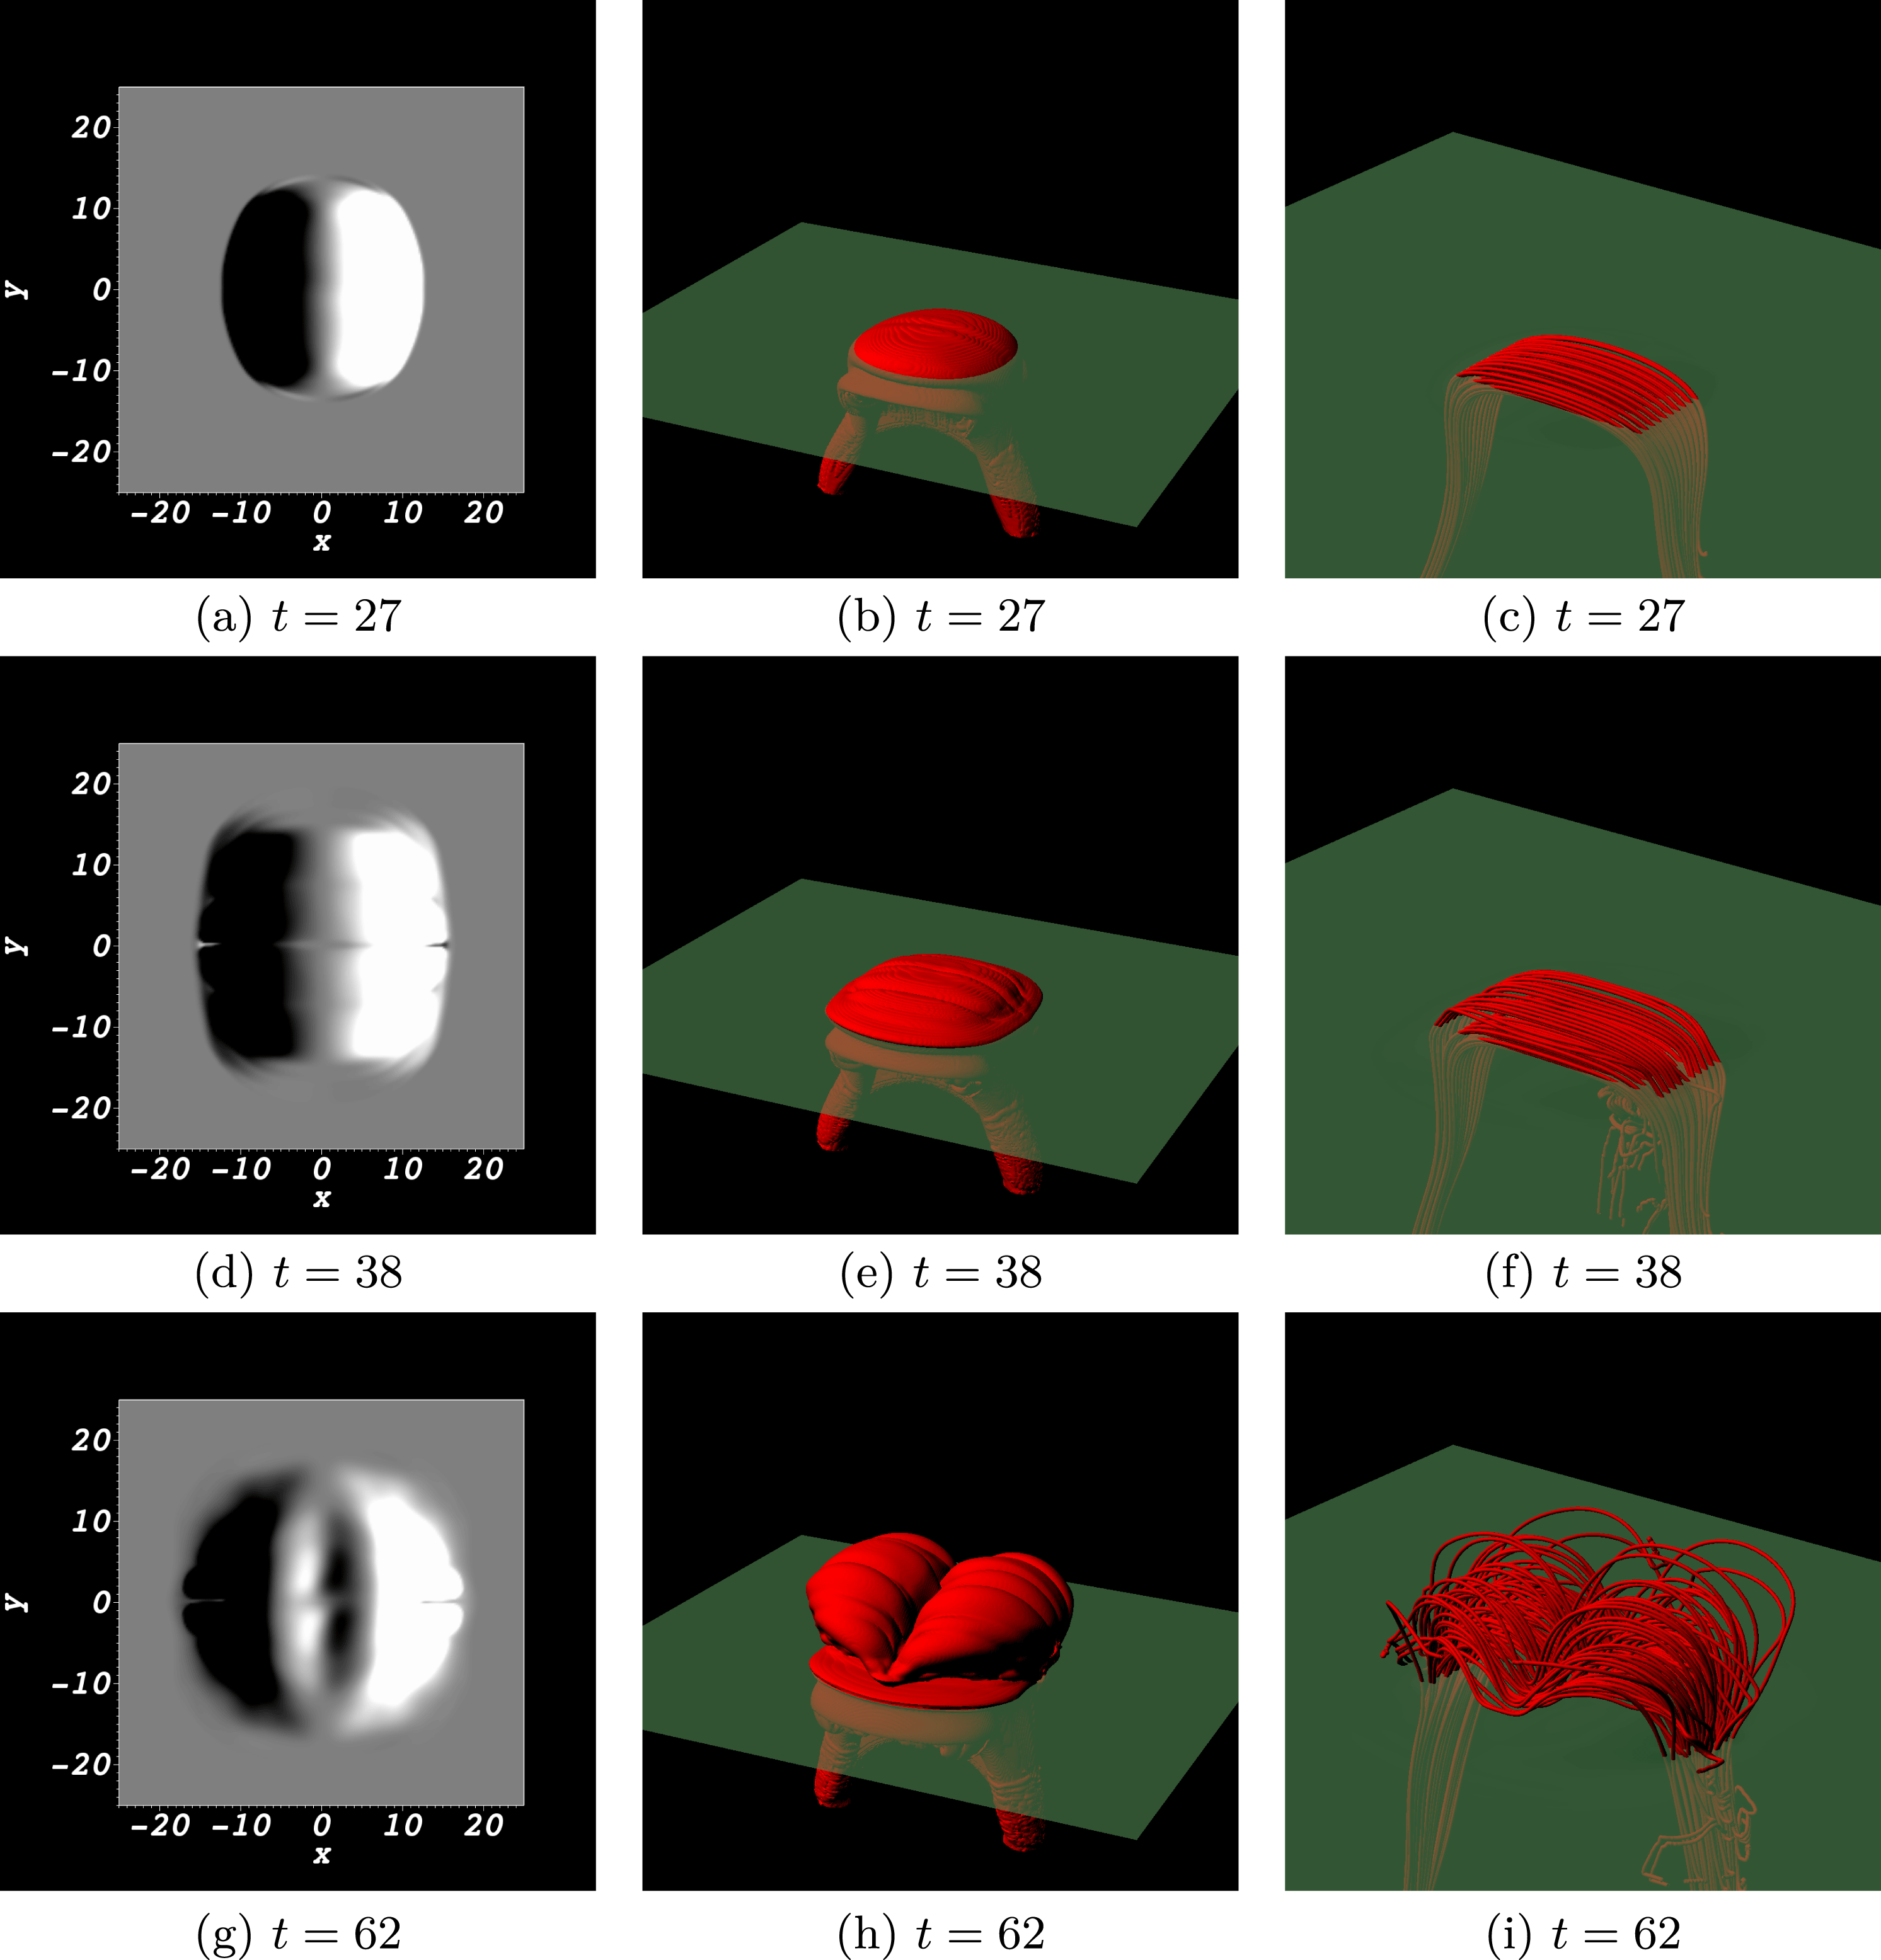
Figure 15. Illustrative distributions characterizing the emergence of a mixed helicity flux rope with
![]() $n=2$
twist pairs. (a,d,g) are magnetograms. (a) depicts (
$n=2$
twist pairs. (a,d,g) are magnetograms. (a) depicts (
![]() $t=27$
) a bipole structure associated with the initial emergence phase. In (d) (
$t=27$
) a bipole structure associated with the initial emergence phase. In (d) (
![]() $t=38$
), this distribution has separated slightly and there also appear to be some weak thin horizontal structures appearing at the centre of the domain. In (g) (
$t=38$
), this distribution has separated slightly and there also appear to be some weak thin horizontal structures appearing at the centre of the domain. In (g) (
![]() $t=62$
), these weak additional structures have developed into pairs of bipoles whose polarity oppose that of the larger initial bipole. (b,e,h) are current contours (
$t=62$
), these weak additional structures have developed into pairs of bipoles whose polarity oppose that of the larger initial bipole. (b,e,h) are current contours (
![]() $|\boldsymbol{j}|=0.01$
) which indicate the field’s expansion. Also indicated is the plane
$|\boldsymbol{j}|=0.01$
) which indicate the field’s expansion. Also indicated is the plane
![]() $z=0$
. (c,f,i) are representative field lines.
$z=0$
. (c,f,i) are representative field lines.
Various illustrative visualizations of the emerging field’s evolution are shown in figure 15. As for the twisted tube, the emerging field gets trapped below the photosphere before becoming subject to the magnetic buoyancy instability and rising into the coronal region. The magnetograms (a,d,g) show that, in addition to a larger bipole structure developing, there is also an additional formation of smaller bipole structures in between these larger poles with orientations in opposition to that of the large bipole. In (b,e,h), contours of the current density structure show the field’s expansion, which is restricted along the PIL of the main bipole. This behaviour is in contrast to the single structure found in the twisted case (figure 2) which shows a more uniform expansion. The field lines, shown in (c,f,i) indicate a pair of intertwined field line arcades linked by a centrally dipped section (which partially submerges, as we will see later). There is no significant twisting in the field lines. It was established in Prior & MacTaggart (Reference Prior and MacTaggart2016) that the dips in the current contours coincide with plasma draining and are the nonlinear manifestations of a Rayleigh–Taylor instability.
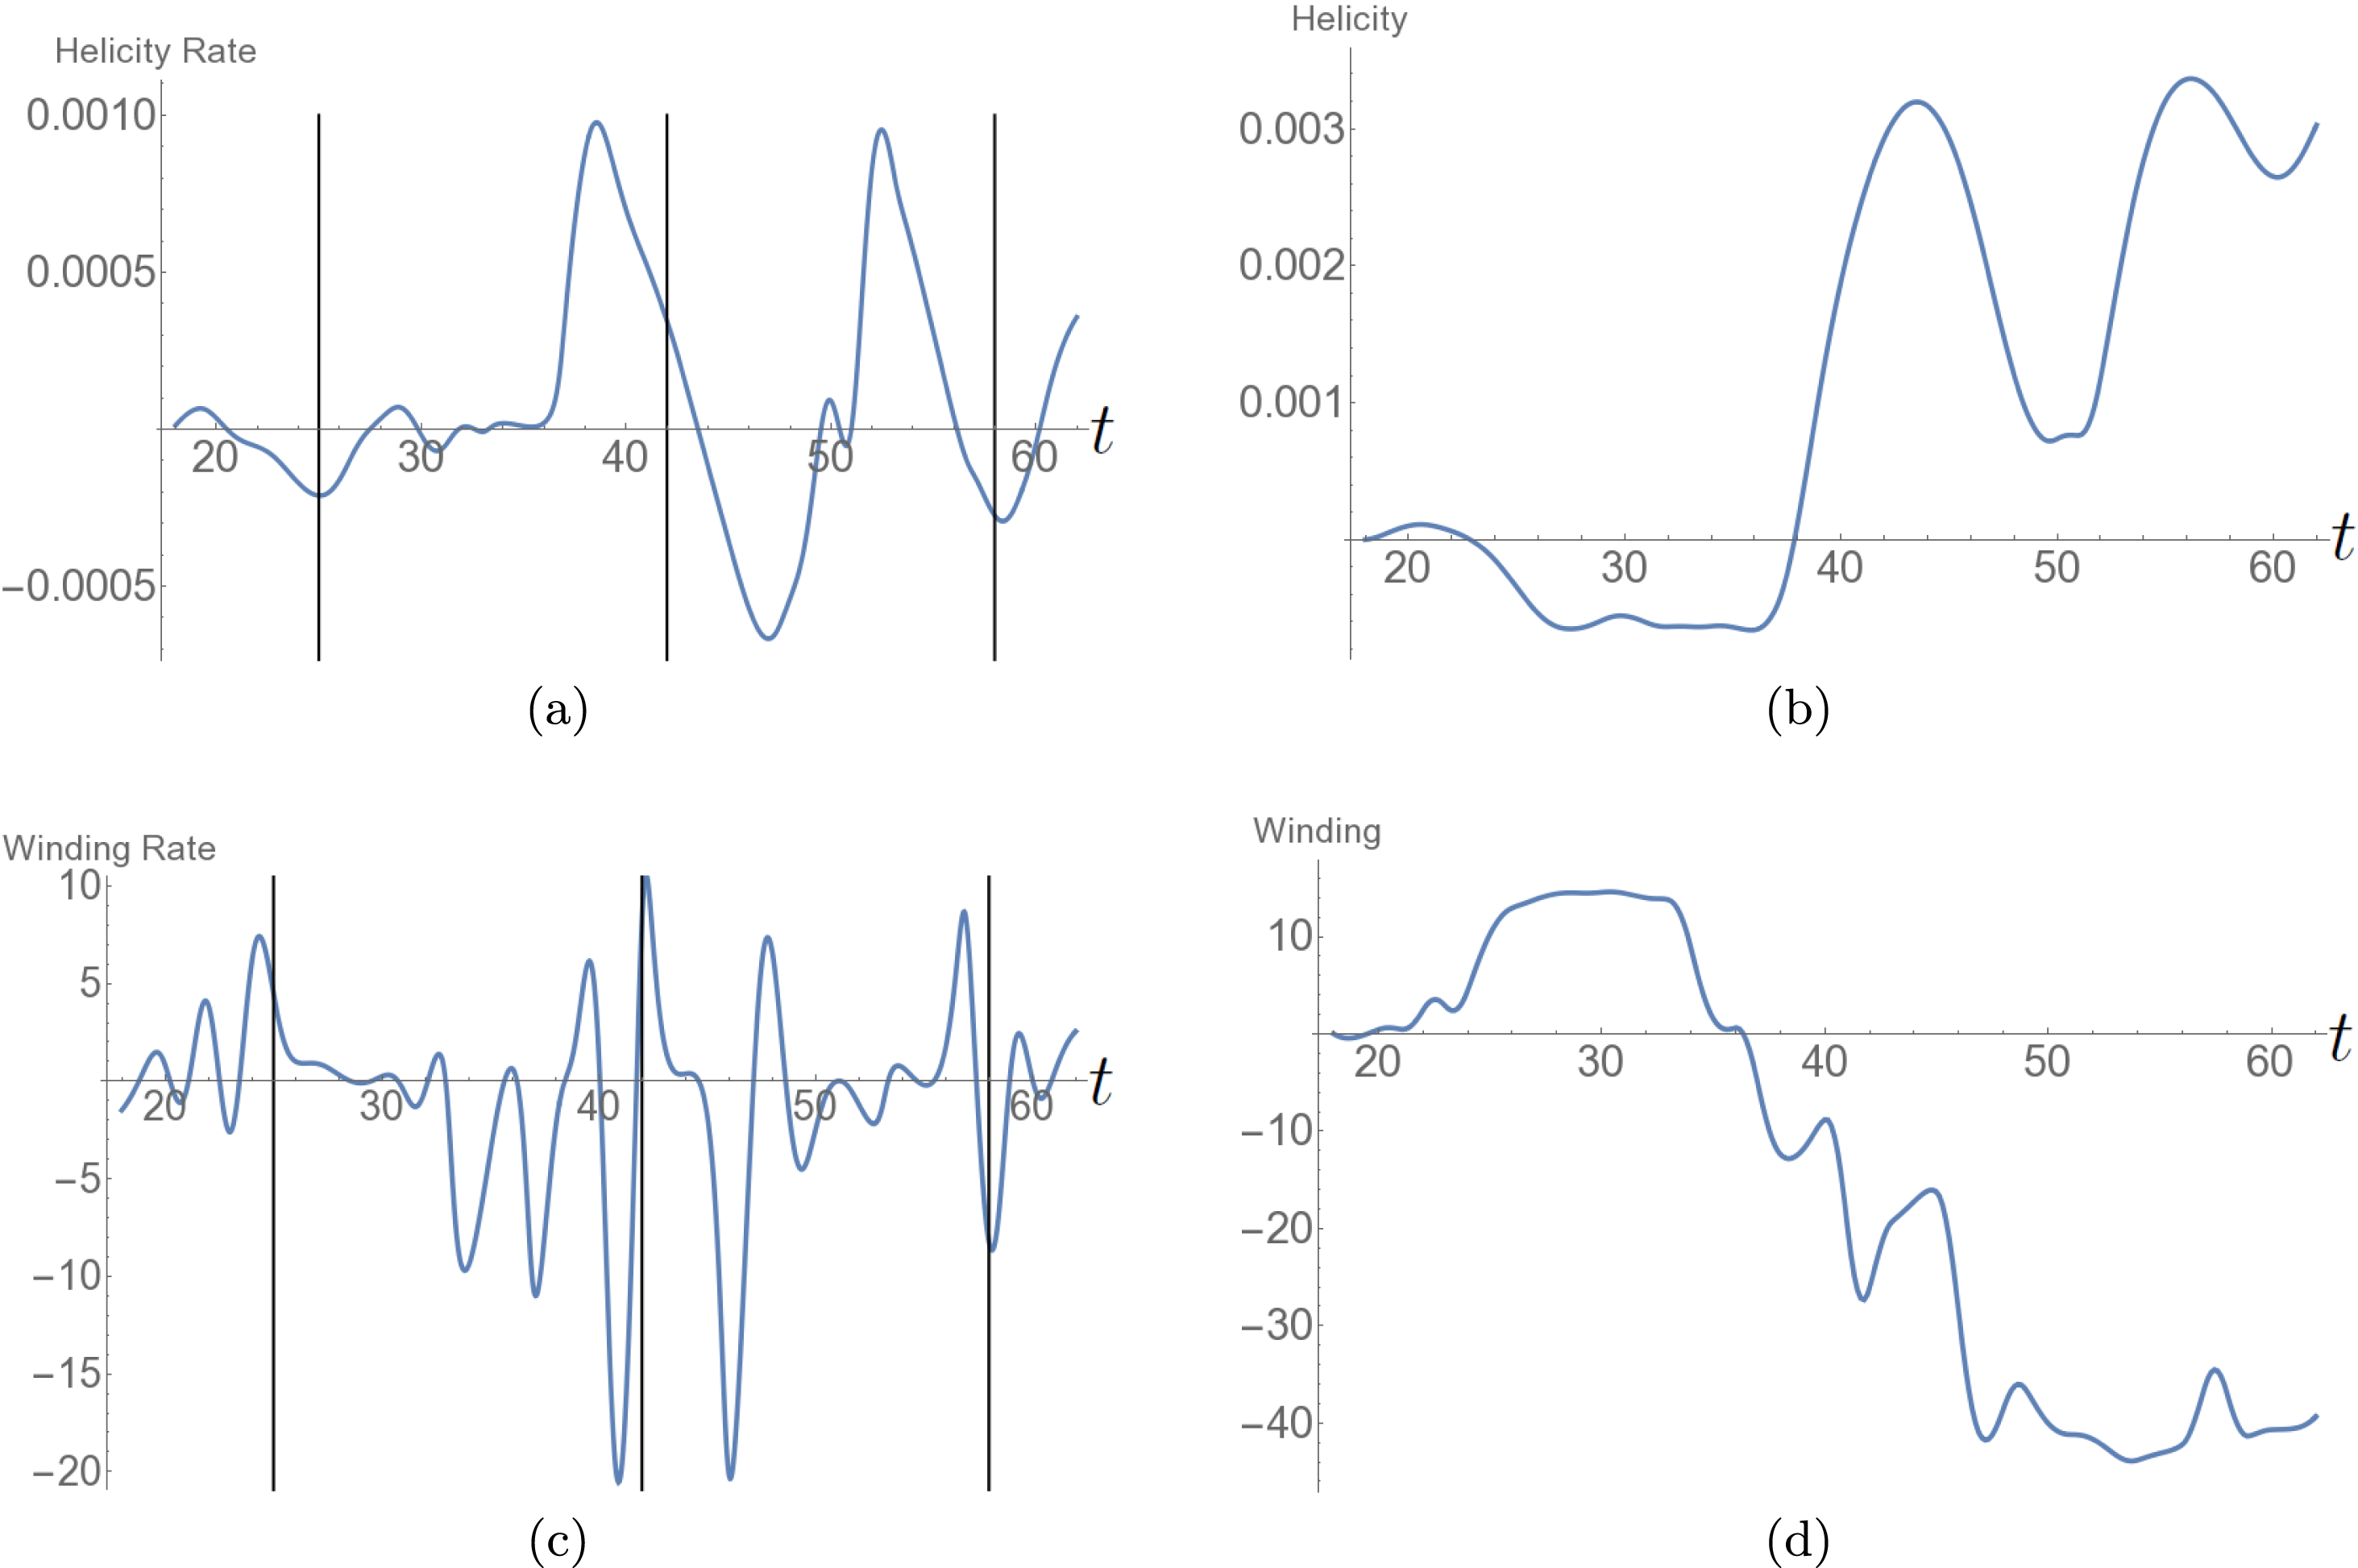
Figure 16. Photospheric helicity and winding inputs for the emergence of the mixed helicity field. (a) The helicity input rate
![]() $\text{d}H/\text{d}t$
. The input is both positive and negative. Also shown are lines at
$\text{d}H/\text{d}t$
. The input is both positive and negative. Also shown are lines at
![]() $t=25,42$
and
$t=25,42$
and
![]() $48$
. (b) The net helicity input
$48$
. (b) The net helicity input
![]() $H(t)$
. (c) The winding rate
$H(t)$
. (c) The winding rate
![]() $\text{d}L/\text{d}t$
. (d) The total winding input
$\text{d}L/\text{d}t$
. (d) The total winding input
![]() $L(t)$
, the sign of this input is generally opposite to that of the helicity.
$L(t)$
, the sign of this input is generally opposite to that of the helicity.
5.4.2 Helicity and winding input: static photosphere
Plots of the time series of the quantities
![]() $\text{d}H/\text{d}t,\,H,\,\text{d}L/\text{d}t$
and
$\text{d}H/\text{d}t,\,H,\,\text{d}L/\text{d}t$
and
![]() $L$
are shown in figure 16. The helicity rate
$L$
are shown in figure 16. The helicity rate
![]() $\text{d}H/\text{d}t$
(a) is both positive and negative and shows oscillatory behaviour (less temporally regular than for the twisted field). The net helicity input
$\text{d}H/\text{d}t$
(a) is both positive and negative and shows oscillatory behaviour (less temporally regular than for the twisted field). The net helicity input
![]() $H(t)$
(b) switches from negative to net positive. The winding input rate
$H(t)$
(b) switches from negative to net positive. The winding input rate
![]() $\text{d}L/\text{d}t$
(c) shows much more rapid variations. The net input
$\text{d}L/\text{d}t$
(c) shows much more rapid variations. The net input
![]() $L$
(d) has a pattern qualitatively similar to the net helicity but with opposing sign. The ratios
$L$
(d) has a pattern qualitatively similar to the net helicity but with opposing sign. The ratios
![]() $H_{t}^{r}$
and
$H_{t}^{r}$
and
![]() $L_{t}^{r}$
are found to be typically 1–2 % (figure 17), indicating the topological input is not far off neutral, as to be expected.
$L_{t}^{r}$
are found to be typically 1–2 % (figure 17), indicating the topological input is not far off neutral, as to be expected.
The distributions
![]() $\text{d}{\mathcal{H}}/\text{d}t$
and
$\text{d}{\mathcal{H}}/\text{d}t$
and
![]() $\text{d}{\mathcal{L}}/\text{d}t$
are shown in figure 18. The snapshots are chosen to display critical characteristics of these distributions which are present at various times of the emergence process.
$\text{d}{\mathcal{L}}/\text{d}t$
are shown in figure 18. The snapshots are chosen to display critical characteristics of these distributions which are present at various times of the emergence process.
There are always four distinct regions of substantial positive and negative helicity (and winding) and these occur in pairs. These regions are generally of similar size and magnitude, which explains why the net helicity (and winding) input is much smaller than its absolute total. In practice, it is difficult to detect the imbalances in the maps of
![]() $\text{d}{\mathcal{H}}/\text{d}t$
that lead to the time series variations shown in figure 16(a). By contrast, the winding distributions
$\text{d}{\mathcal{H}}/\text{d}t$
that lead to the time series variations shown in figure 16(a). By contrast, the winding distributions
![]() $\text{d}{\mathcal{L}}/\text{d}t$
capture more features related to emergence and submergence (we will return to this point later). We ignore the distribution values around the edge of the magnetic domain as the field is very weak there. The field line structure in the boundary current sheet is incoherent and, thus, any apparent winding input is not meaningful.
$\text{d}{\mathcal{L}}/\text{d}t$
capture more features related to emergence and submergence (we will return to this point later). We ignore the distribution values around the edge of the magnetic domain as the field is very weak there. The field line structure in the boundary current sheet is incoherent and, thus, any apparent winding input is not meaningful.
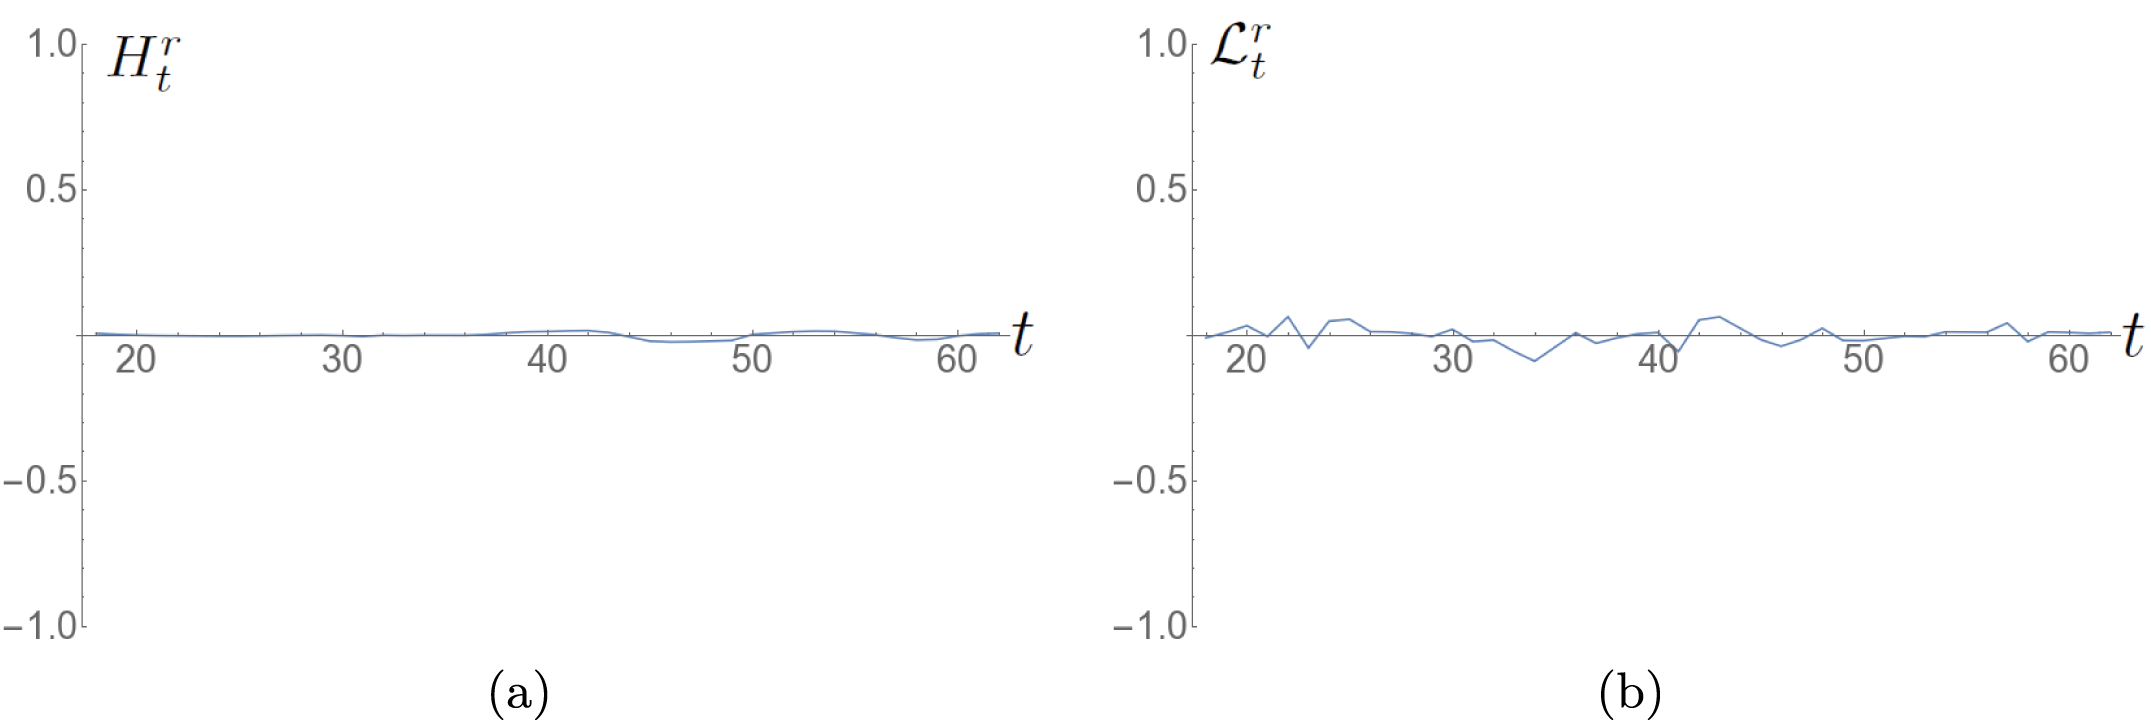
Figure 17. Time series of the ratios (a)
![]() $H_{t}^{r}$
and (b)
$H_{t}^{r}$
and (b)
![]() $L_{t}^{r}$
for the
$L_{t}^{r}$
for the
![]() $n=2$
mixed helicity field emergence.
$n=2$
mixed helicity field emergence.
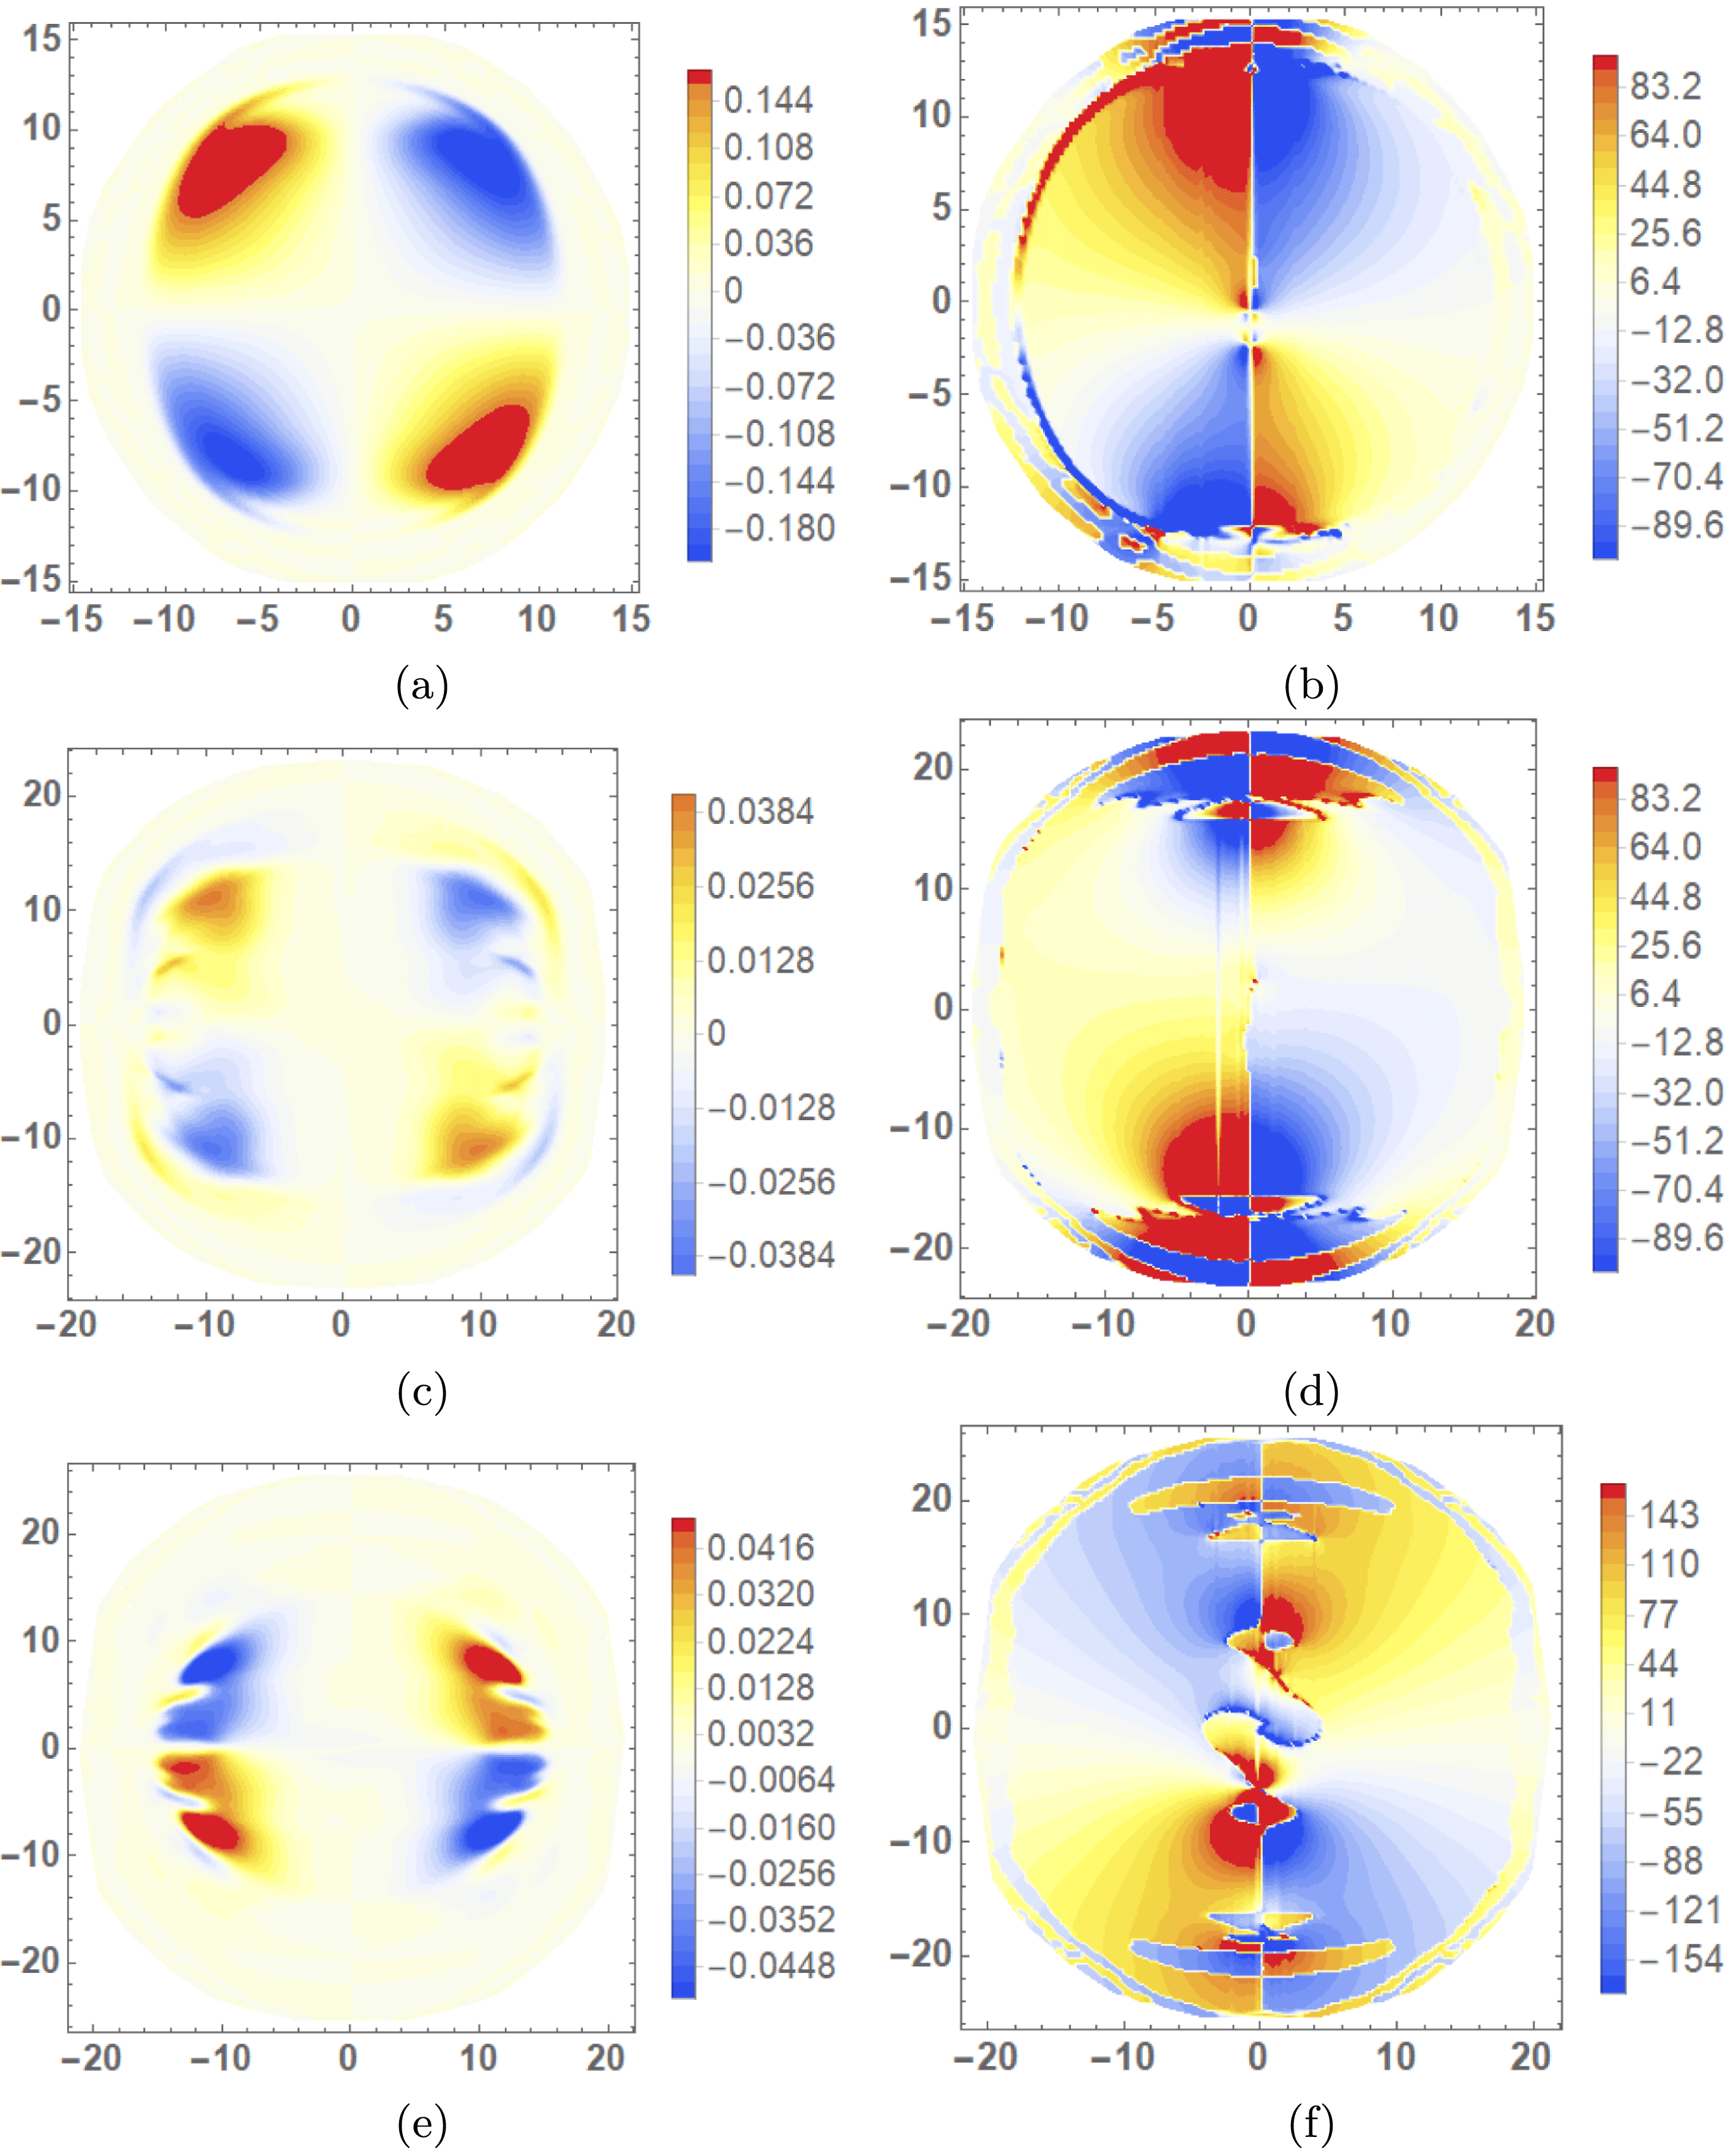
Figure 18. Distributions of
![]() $\text{d}{\mathcal{H}}/\text{d}t$
and
$\text{d}{\mathcal{H}}/\text{d}t$
and
![]() $\text{d}{\mathcal{L}}/\text{d}t$
which indicate the various characteristic stages of the distribution evolutions (indicated with vertical lines on figure 16). (a)
$\text{d}{\mathcal{L}}/\text{d}t$
which indicate the various characteristic stages of the distribution evolutions (indicated with vertical lines on figure 16). (a)
![]() $\text{d}{\mathcal{H}}/\text{d}t$
and (b)
$\text{d}{\mathcal{H}}/\text{d}t$
and (b)
![]() $\text{d}{\mathcal{L}}/\text{d}t$
at
$\text{d}{\mathcal{L}}/\text{d}t$
at
![]() $t=25$
. In both cases there are two significant regions of positive input and two with negative input, a quadrupolar distribution. In (b) the straight PIL is visible along the
$t=25$
. In both cases there are two significant regions of positive input and two with negative input, a quadrupolar distribution. In (b) the straight PIL is visible along the
![]() $y$
axis. (c)
$y$
axis. (c)
![]() $\text{d}{\mathcal{H}}/\text{d}t$
and (d)
$\text{d}{\mathcal{H}}/\text{d}t$
and (d)
![]() $\text{d}{\mathcal{L}}/\text{d}t$
at
$\text{d}{\mathcal{L}}/\text{d}t$
at
![]() $t=42$
. In (c) the four regions from (a) remain but are surrounded by thin strips of helicity input of opposing sign. In (d), by contrast, the sign of the four regions have swapped compared to (b) and there are additional sub regions of positive and negative input centred on the PIL. (e)
$t=42$
. In (c) the four regions from (a) remain but are surrounded by thin strips of helicity input of opposing sign. In (d), by contrast, the sign of the four regions have swapped compared to (b) and there are additional sub regions of positive and negative input centred on the PIL. (e)
![]() $\text{d}{\mathcal{H}}/\text{d}t$
and (f)
$\text{d}{\mathcal{H}}/\text{d}t$
and (f)
![]() $\text{d}{\mathcal{L}}/\text{d}t$
at
$\text{d}{\mathcal{L}}/\text{d}t$
at
![]() $t=48$
. The helicity input (e) still has four dominant domains but they have swapped sign from the distributions in (a,c). In (f) the flux region seen in the latter magnetograms (figure 15) appears as a distorted PIL and there are strong concentrations of helicity either side of it.
$t=48$
. The helicity input (e) still has four dominant domains but they have swapped sign from the distributions in (a,c). In (f) the flux region seen in the latter magnetograms (figure 15) appears as a distorted PIL and there are strong concentrations of helicity either side of it.
The PIL is clear in all
![]() $\text{d}{\mathcal{L}}/\text{d}t$
distributions and its shape varies significantly as various new helicity structures appear (note that all additional structures appear at the PIL).
$\text{d}{\mathcal{L}}/\text{d}t$
distributions and its shape varies significantly as various new helicity structures appear (note that all additional structures appear at the PIL).
5.5 Helicity and winding input: moving photosphere
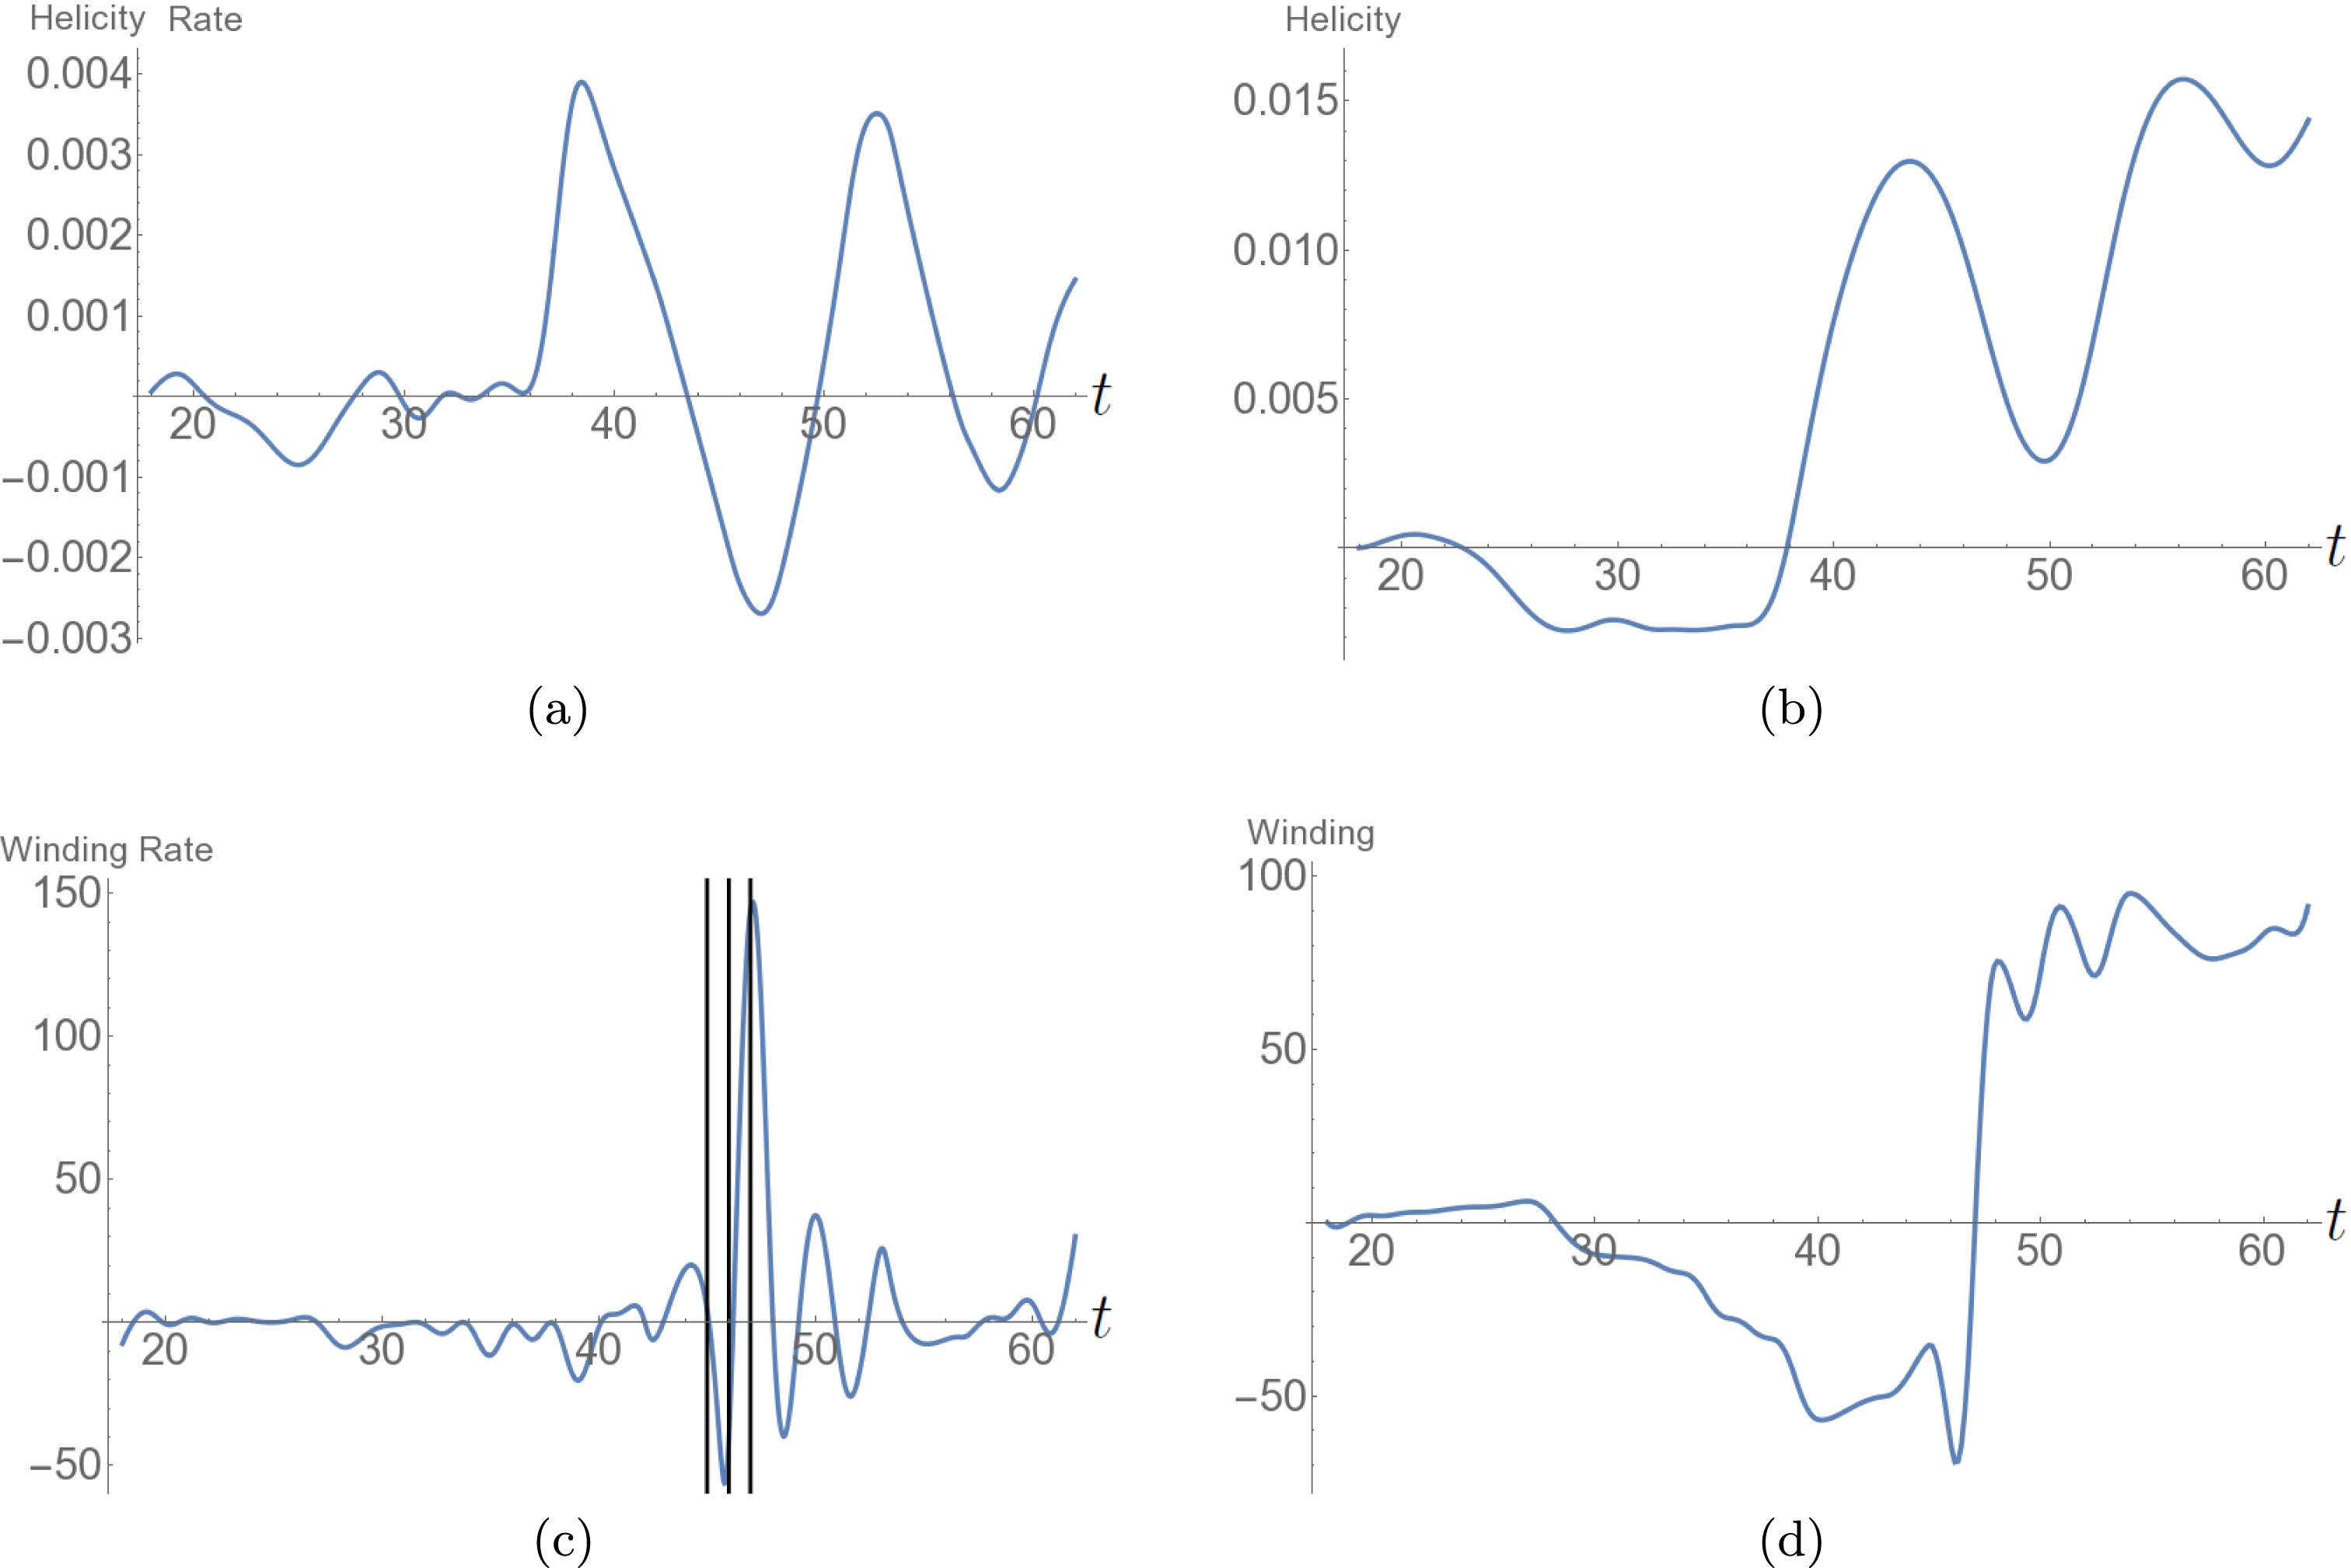
Figure 19. Helicity and winding inputs for the emergence of the mixed helicity field, allowing for the varying photospheric geometry. (a) The helicity input rate
![]() $\text{d}H_{v}/\text{d}t$
. (b) The net helicity input
$\text{d}H_{v}/\text{d}t$
. (b) The net helicity input
![]() $H_{v}(t)$
. (c) The winding rate
$H_{v}(t)$
. (c) The winding rate
![]() $\text{d}L_{v}/\text{d}t$
. The vertical lines mark times
$\text{d}L_{v}/\text{d}t$
. The vertical lines mark times
![]() $t=45,46,47$
at which the field is analysed in detail in the text. (d) The total winding input
$t=45,46,47$
at which the field is analysed in detail in the text. (d) The total winding input
![]() $L_{v}(t)$
.
$L_{v}(t)$
.
Time series of
![]() $\text{d}H_{v}/\text{d}t$
,
$\text{d}H_{v}/\text{d}t$
,
![]() $H_{v}$
,
$H_{v}$
,
![]() $\text{d}L_{v}/\text{d}t$
and
$\text{d}L_{v}/\text{d}t$
and
![]() $L_{v}$
, which account for the varying photospheric geometry, are shown in figure 19. In order to prevent the winding measure being affected by any weak (unresolved) field, we utilize the modified definition of the function
$L_{v}$
, which account for the varying photospheric geometry, are shown in figure 19. In order to prevent the winding measure being affected by any weak (unresolved) field, we utilize the modified definition of the function
![]() $\unicode[STIX]{x1D70E}_{z}$
(4.6) with
$\unicode[STIX]{x1D70E}_{z}$
(4.6) with
![]() $\unicode[STIX]{x1D716}=0.0001$
for the
$\unicode[STIX]{x1D716}=0.0001$
for the
![]() $\text{d}L_{v}/\text{d}t$
and
$\text{d}L_{v}/\text{d}t$
and
![]() $L_{v}$
calculations. As was the case for the twisted field, the only significant change in the helicity time series compared to those shown in figure 16(a,b) is in regard to the magnitudes. This difference could, again, be traced to differences in the vertical velocity distribution. The time series of the winding quantities
$L_{v}$
calculations. As was the case for the twisted field, the only significant change in the helicity time series compared to those shown in figure 16(a,b) is in regard to the magnitudes. This difference could, again, be traced to differences in the vertical velocity distribution. The time series of the winding quantities
![]() $\text{d}L_{v}/\text{d}t$
and
$\text{d}L_{v}/\text{d}t$
and
![]() $L_{v}$
, shown in figure 19(c,d), differ significantly from those shown in figure 16(c,d). We find that this is, in part, due to the varying photosphere
$L_{v}$
, shown in figure 19(c,d), differ significantly from those shown in figure 16(c,d). We find that this is, in part, due to the varying photosphere
![]() $P_{v}$
and partly due to ignoring the contributions from significantly weak regions of the field. As discussed previously, the winding is more sensitive to large input from topologically complex field lines of very weak field strength. Hence, the calculation of the winding requires some care.
$P_{v}$
and partly due to ignoring the contributions from significantly weak regions of the field. As discussed previously, the winding is more sensitive to large input from topologically complex field lines of very weak field strength. Hence, the calculation of the winding requires some care.
The sign of the net input
![]() $L_{v}$
is largely dictated by a significant spike in the input
$L_{v}$
is largely dictated by a significant spike in the input
![]() $\text{d}L_{v}/\text{d}t$
at
$\text{d}L_{v}/\text{d}t$
at
![]() $t=47$
. After this, there are two large oscillations which are more balanced. The net inputs
$t=47$
. After this, there are two large oscillations which are more balanced. The net inputs
![]() $H_{v}$
and
$H_{v}$
and
![]() $L_{v}$
now agree in terms of the net sign of their input over the simulation (as opposed to the quantities
$L_{v}$
now agree in terms of the net sign of their input over the simulation (as opposed to the quantities
![]() $H$
and
$H$
and
![]() $L$
, emphasizing the sensitivity of
$L$
, emphasizing the sensitivity of
![]() $L$
or
$L$
or
![]() $L_{v}$
).
$L_{v}$
).
5.6 Field submergence and deformation
As mentioned above, a clearer transition is revealed by the winding compared to the helicity. The key question to answer here is, what is causing this transition? Some indications can be found in the distributions of
![]() $\text{d}{\mathcal{L}}_{v}/\text{d}t$
shown in figure 20. These distributions are at the times indicated by the parallel lines in figure 19(c). Figure 20(a) displays
$\text{d}{\mathcal{L}}_{v}/\text{d}t$
shown in figure 20. These distributions are at the times indicated by the parallel lines in figure 19(c). Figure 20(a) displays
![]() $\text{d}{\mathcal{L}}_{v}/\text{d}t$
when
$\text{d}{\mathcal{L}}_{v}/\text{d}t$
when
![]() $\text{d}L_{v}/\text{d}t$
is changing from positive to negative. A small region of negative
$\text{d}L_{v}/\text{d}t$
is changing from positive to negative. A small region of negative
![]() $\text{d}{\mathcal{L}}_{v}/\text{d}t$
is visible at the centre (0,0). The region grows in (b), which corresponds to when
$\text{d}{\mathcal{L}}_{v}/\text{d}t$
is visible at the centre (0,0). The region grows in (b), which corresponds to when
![]() $\text{d}L_{v}/\text{d}t$
takes its largest negative value. In (c), which corresponds to the large positive spike in
$\text{d}L_{v}/\text{d}t$
takes its largest negative value. In (c), which corresponds to the large positive spike in
![]() $\text{d}L_{v}/\text{d}t$
and positive jump in
$\text{d}L_{v}/\text{d}t$
and positive jump in
![]() $L_{v}$
, the distribution changes to a clear antisymmetrical pattern. There is no longer the isolated patch of negative
$L_{v}$
, the distribution changes to a clear antisymmetrical pattern. There is no longer the isolated patch of negative
![]() $\text{d}{\mathcal{L}}_{v}/\text{d}t$
at the centre and the PIL is highly deformed.
$\text{d}{\mathcal{L}}_{v}/\text{d}t$
at the centre and the PIL is highly deformed.
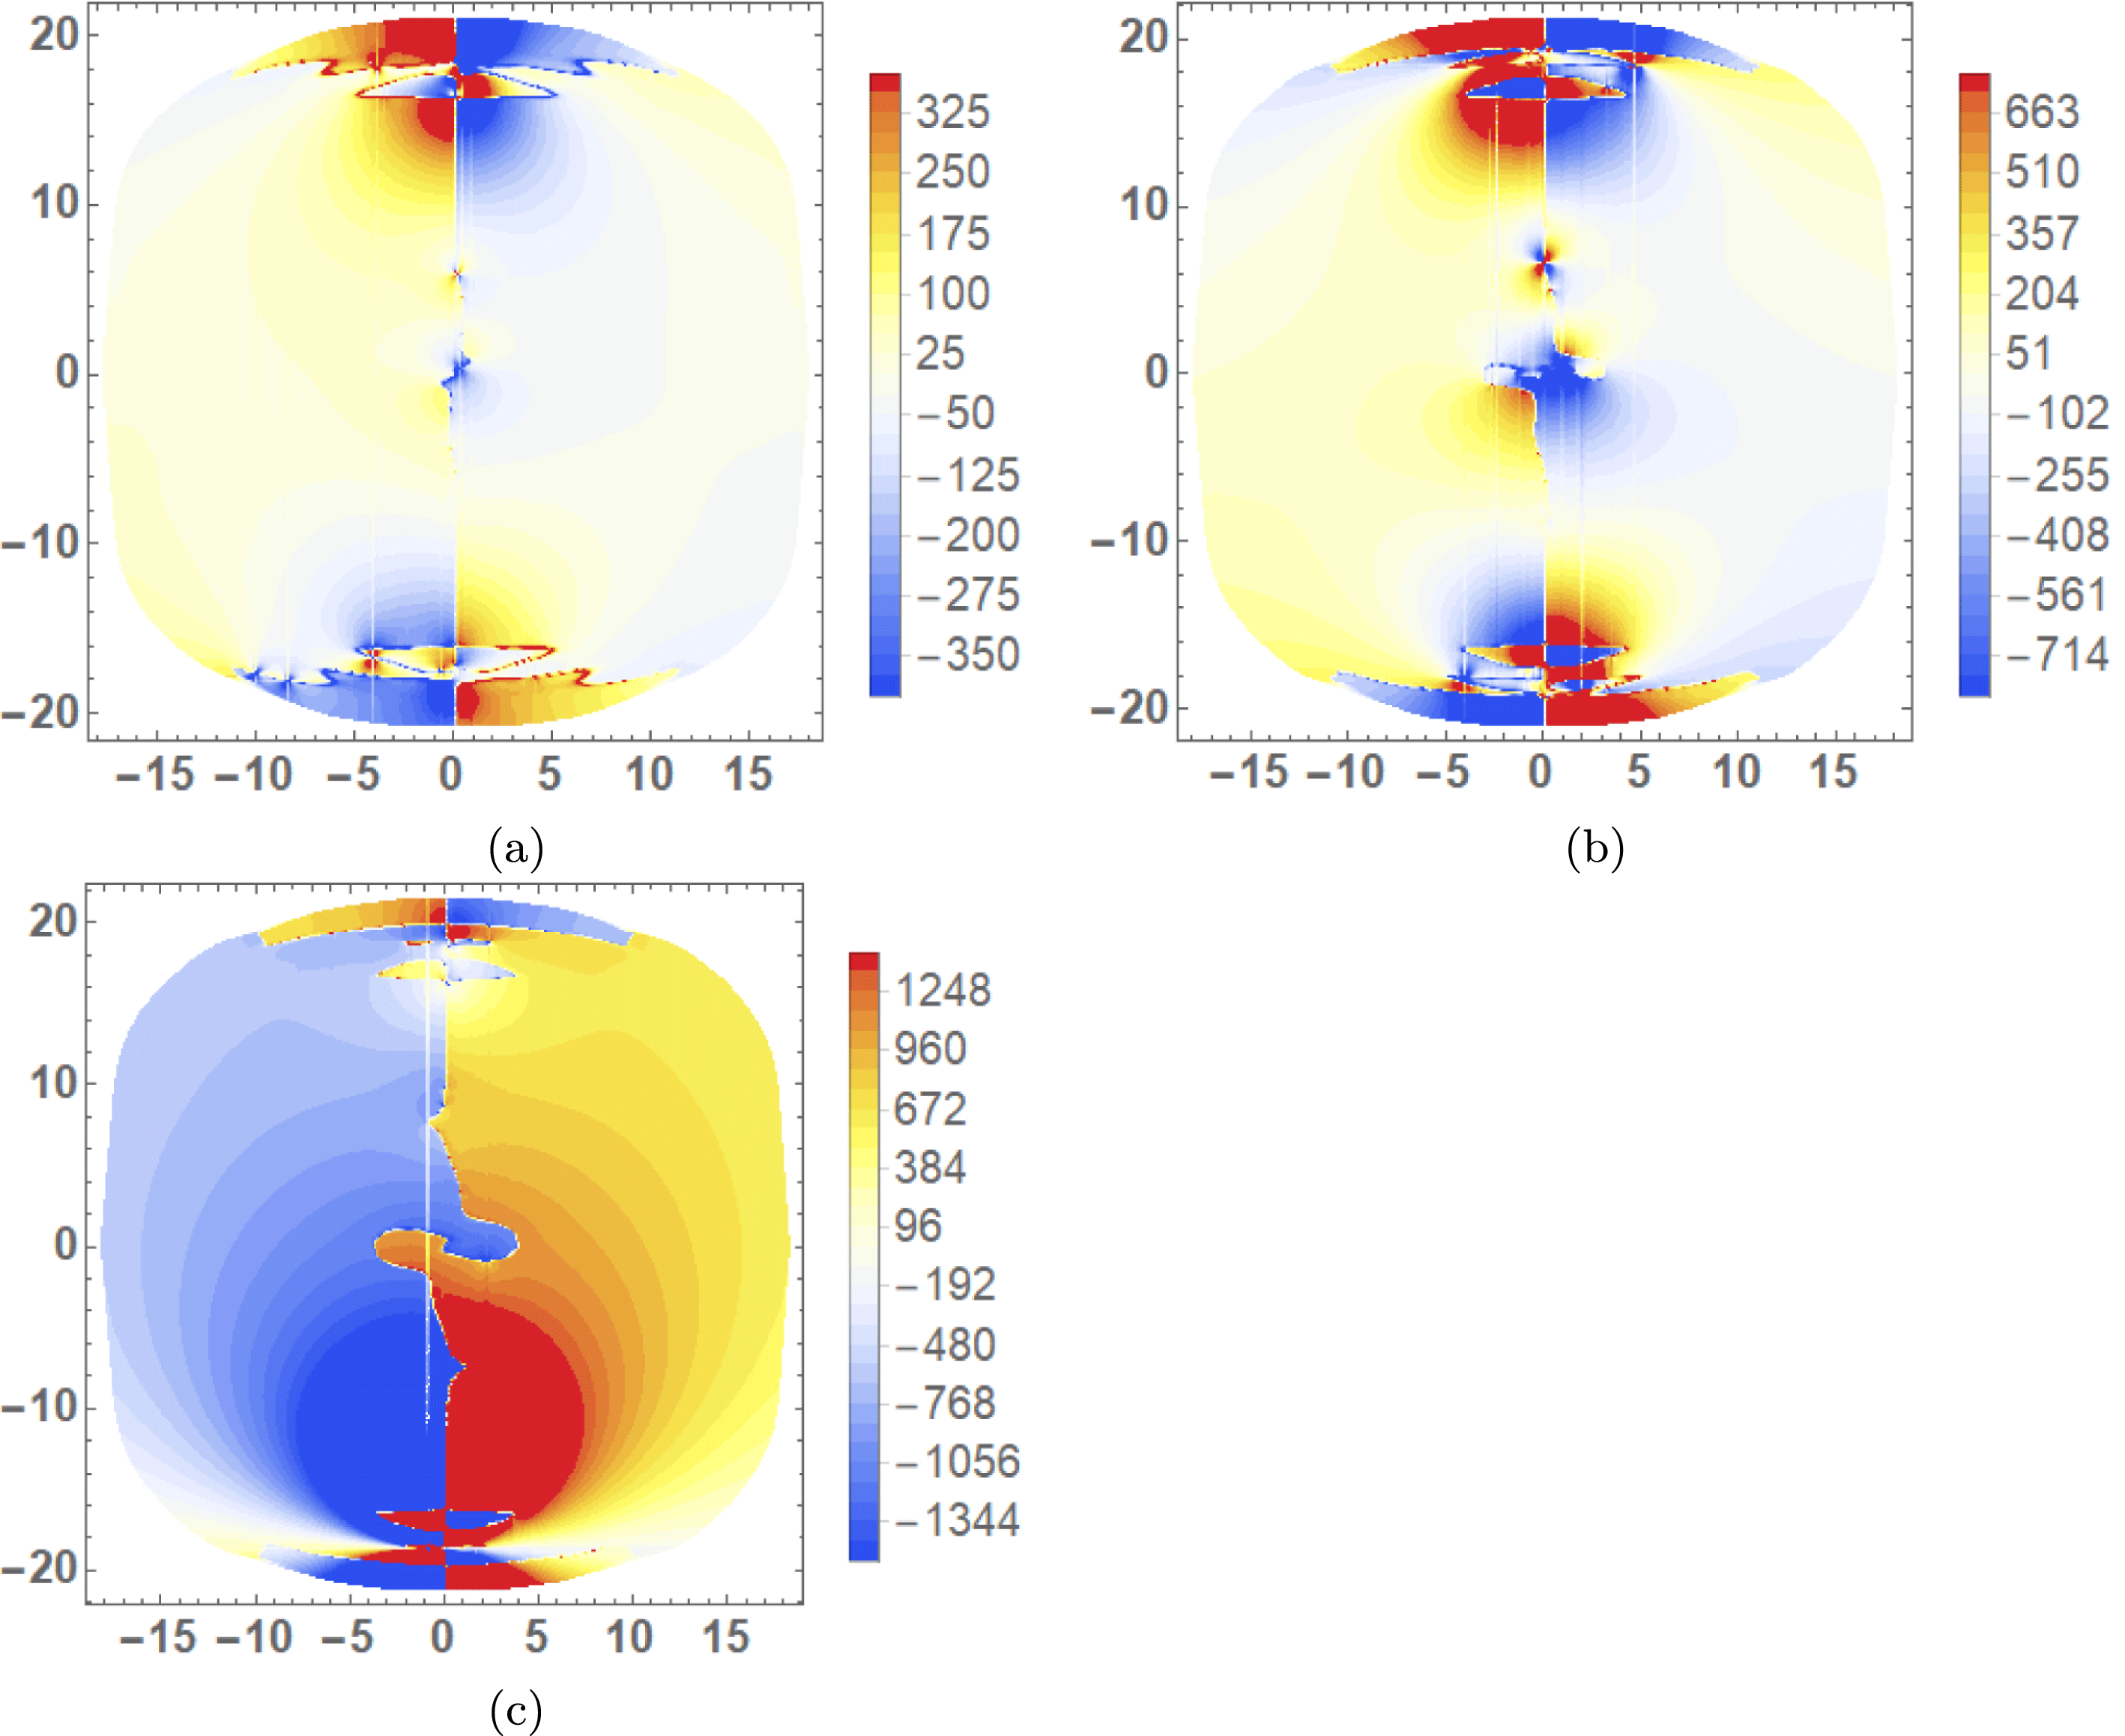
Figure 20. Distributions of the winding input density
![]() $\text{d}{\mathcal{L}}_{v}/\text{d}t$
covering the period of the time series shown in figure 19(d) at which there is a strong spike in input. (a) At
$\text{d}{\mathcal{L}}_{v}/\text{d}t$
covering the period of the time series shown in figure 19(d) at which there is a strong spike in input. (a) At
![]() $t=45$
, before the spike. (b) At
$t=45$
, before the spike. (b) At
![]() $t=46$
. (c) At
$t=46$
. (c) At
![]() $t=47$
at the spike’s peak.
$t=47$
at the spike’s peak.
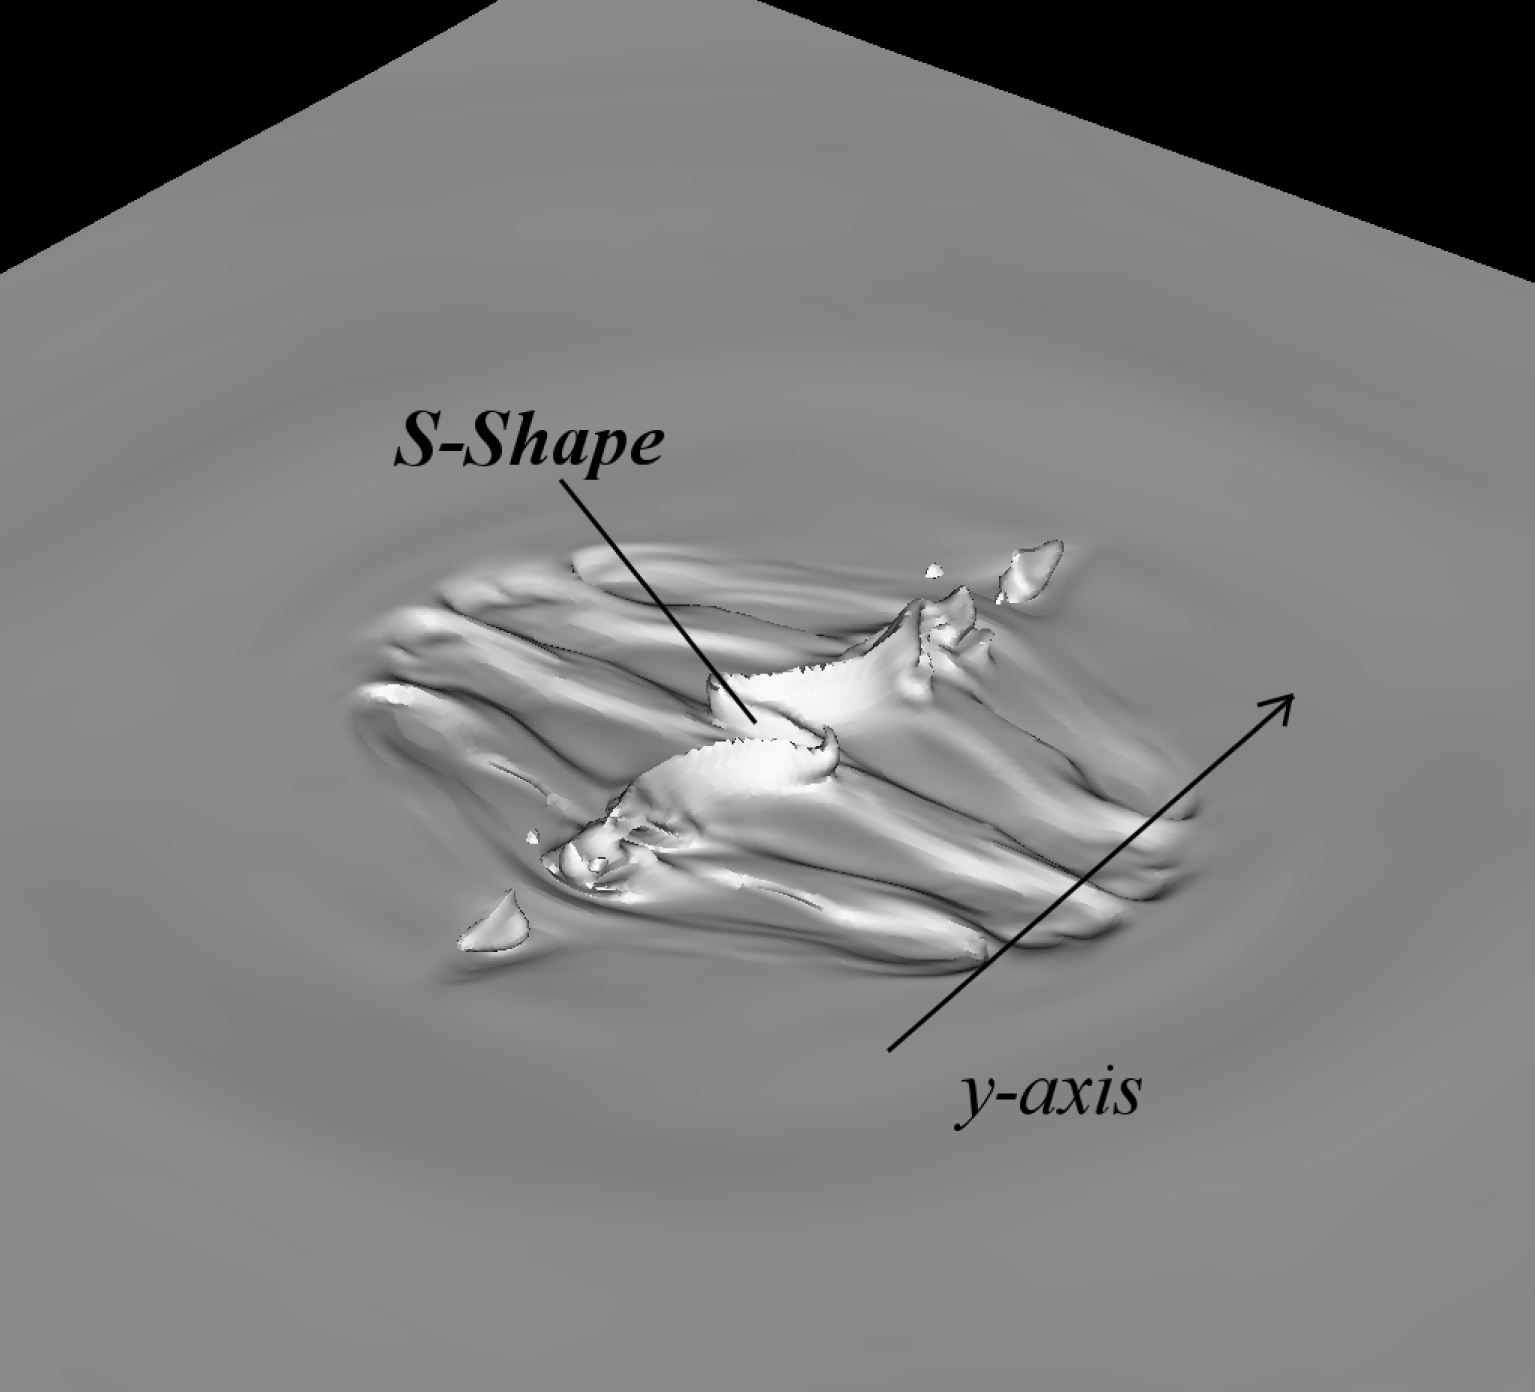
Figure 21. A contour plot of density
![]() $\unicode[STIX]{x1D70C}=0.2$
, slightly above the
$\unicode[STIX]{x1D70C}=0.2$
, slightly above the
![]() $\unicode[STIX]{x1D70C}=1$
photospheric level at
$\unicode[STIX]{x1D70C}=1$
photospheric level at
![]() $t=62$
. There is a an
$t=62$
. There is a an
![]() $s$
-shaped peak in the density profile at the centre of the domain which is parallel to the
$s$
-shaped peak in the density profile at the centre of the domain which is parallel to the
![]() $y$
-direction and has been established to correspond to a pooling of dense plasma in this location. This shape matches the morphology of line observed in the winding input densities
$y$
-direction and has been established to correspond to a pooling of dense plasma in this location. This shape matches the morphology of line observed in the winding input densities
![]() $\text{d}L/\text{d}t$
, shown in figure 18(f), and
$\text{d}L/\text{d}t$
, shown in figure 18(f), and
![]() $\text{d}L_{v}/\text{d}t$
, shown in figure 20(c).
$\text{d}L_{v}/\text{d}t$
, shown in figure 20(c).
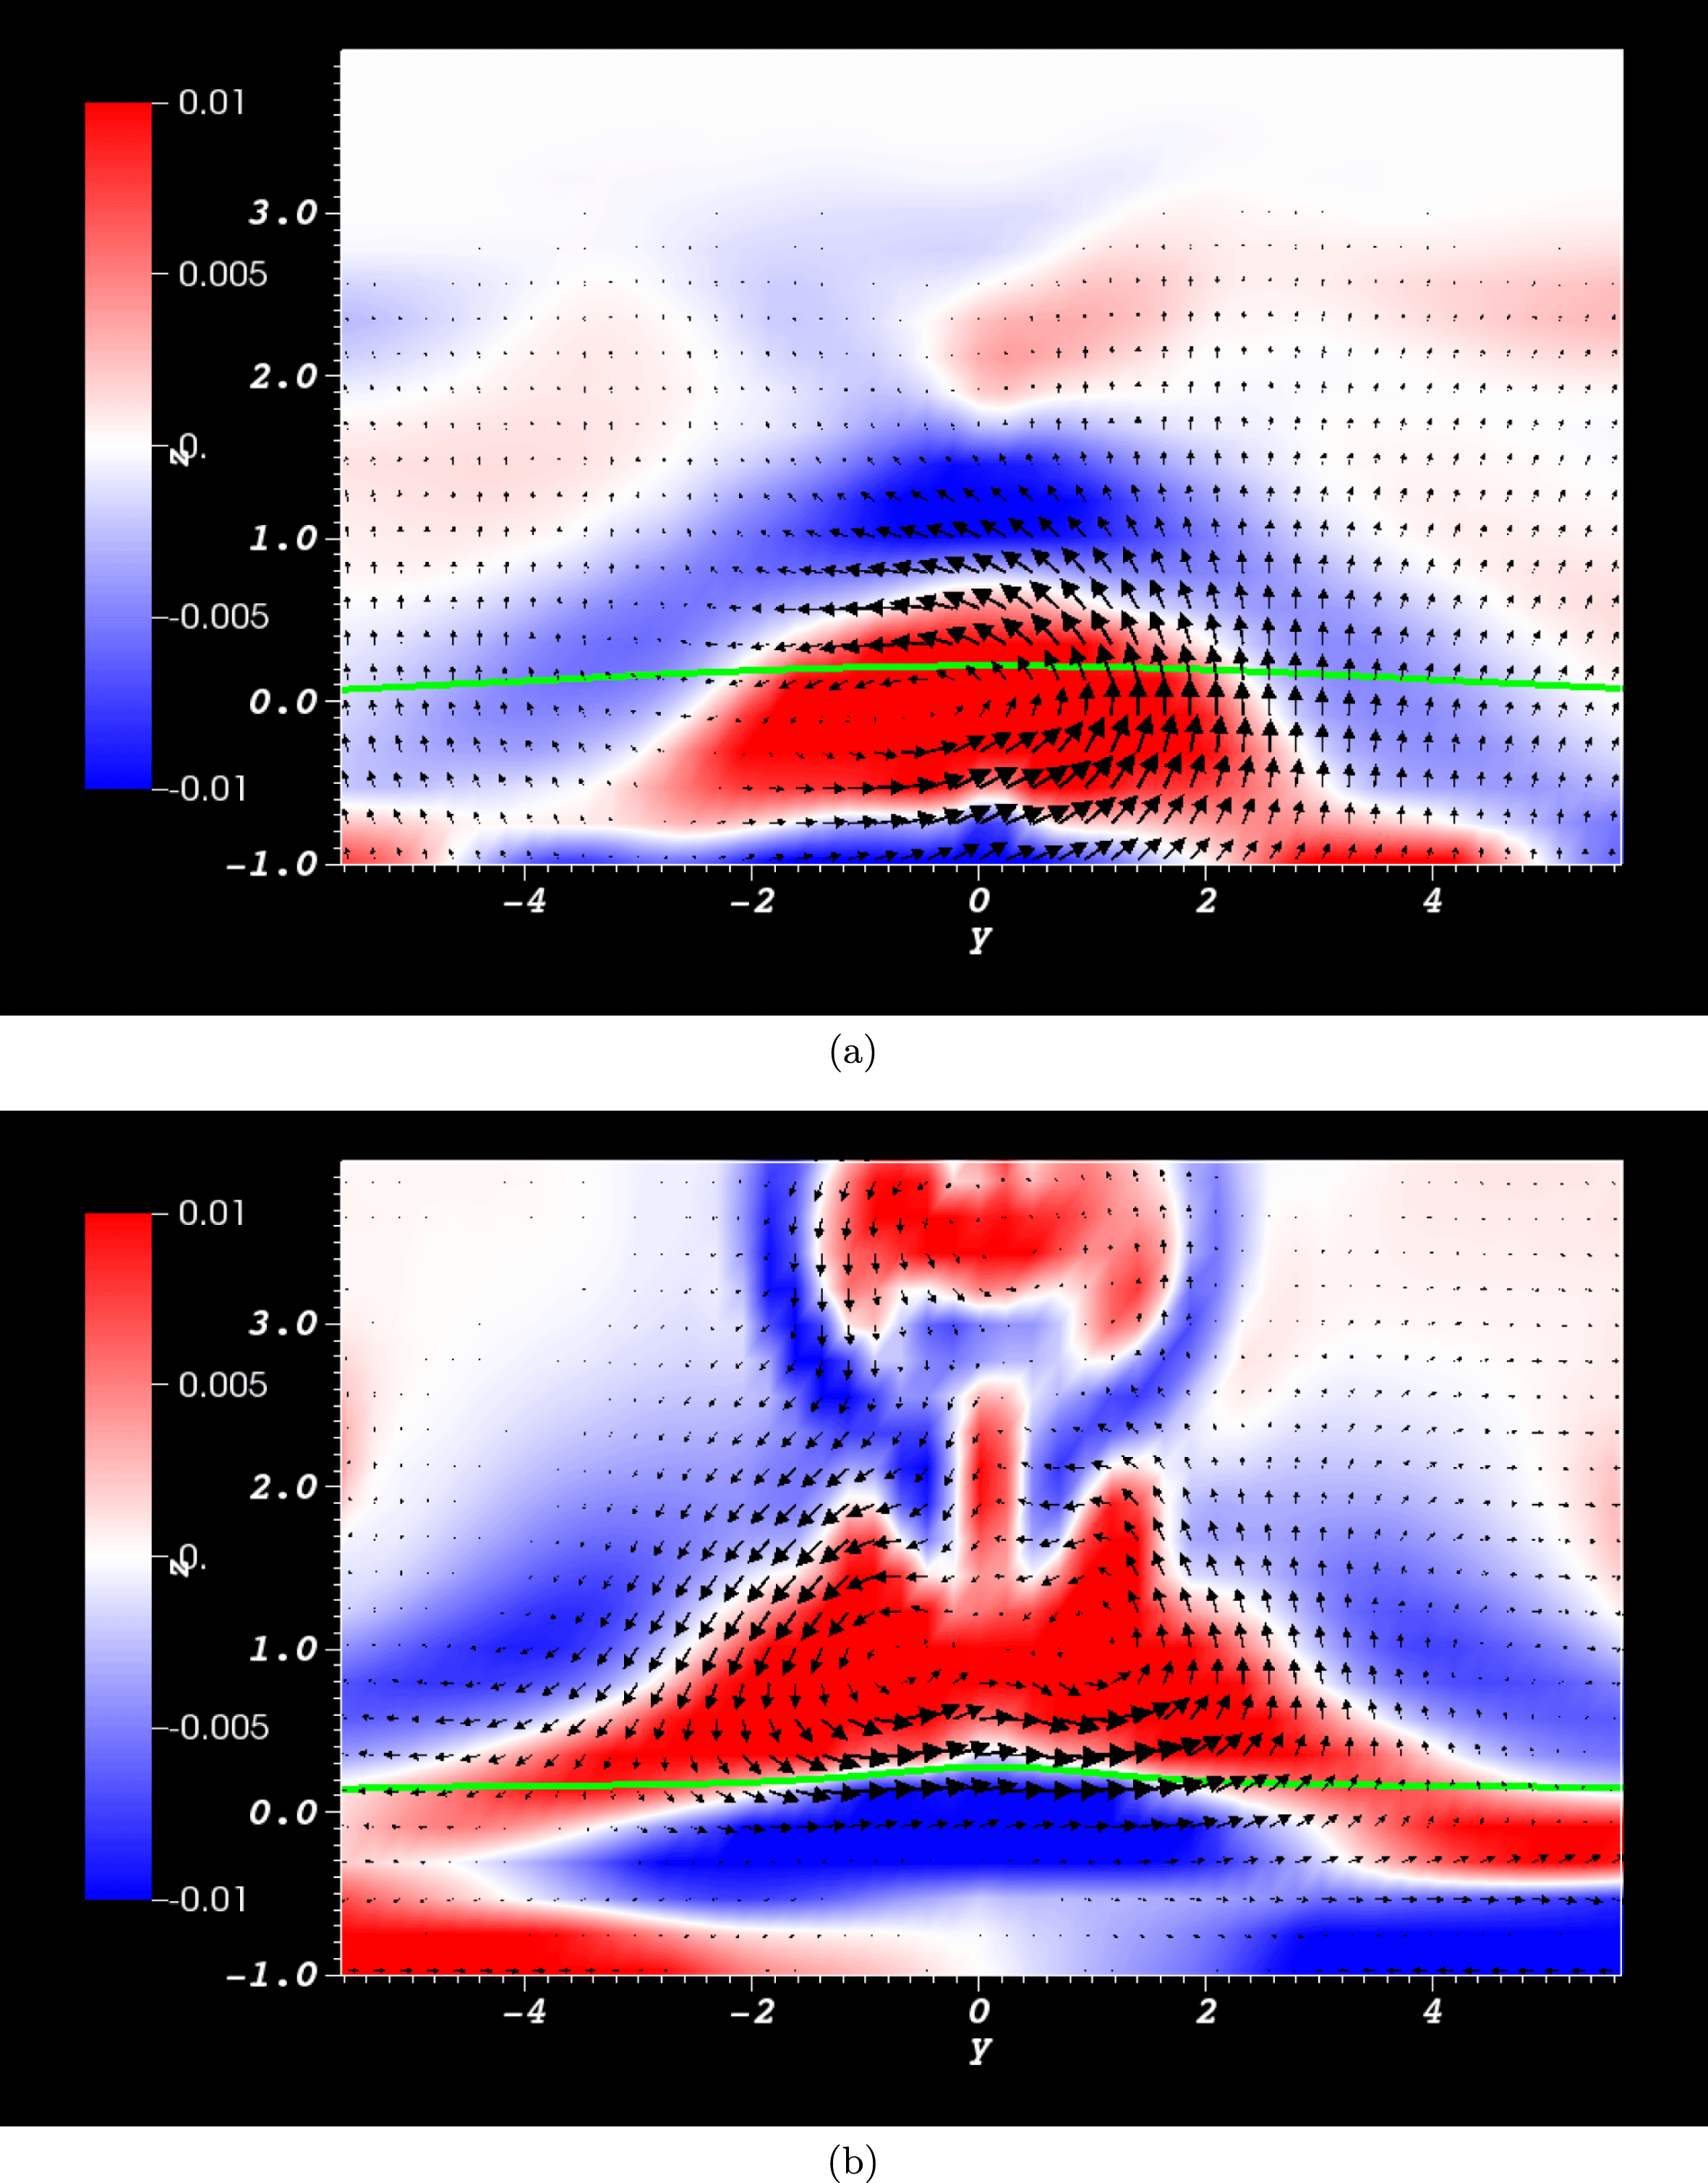
Figure 22. Slices in the
![]() $y$
–
$y$
–
![]() $z$
plane, at the PIL at (a)
$z$
plane, at the PIL at (a)
![]() $t=27$
and (b)
$t=27$
and (b)
![]() $t=42$
, revealing different phases of emergence. The slices display distributions of the out of plane component of the current density. Also shown, as a green line, the
$t=42$
, revealing different phases of emergence. The slices display distributions of the out of plane component of the current density. Also shown, as a green line, the
![]() $\unicode[STIX]{x1D70C}=1$
surface of the moving photosphere. (a) (
$\unicode[STIX]{x1D70C}=1$
surface of the moving photosphere. (a) (
![]() $t=27$
) There is a spiral structure, indicative of a locally twisted field just off the centre of the photospheric domain. It is part way through emerging through the
$t=27$
) There is a spiral structure, indicative of a locally twisted field just off the centre of the photospheric domain. It is part way through emerging through the
![]() $\unicode[STIX]{x1D70C}=1$
photosphere line. (b) (
$\unicode[STIX]{x1D70C}=1$
photosphere line. (b) (
![]() $t=42$
) The previous twist has split in two due to the deformation of the current structure in the atmosphere.
$t=42$
) The previous twist has split in two due to the deformation of the current structure in the atmosphere.
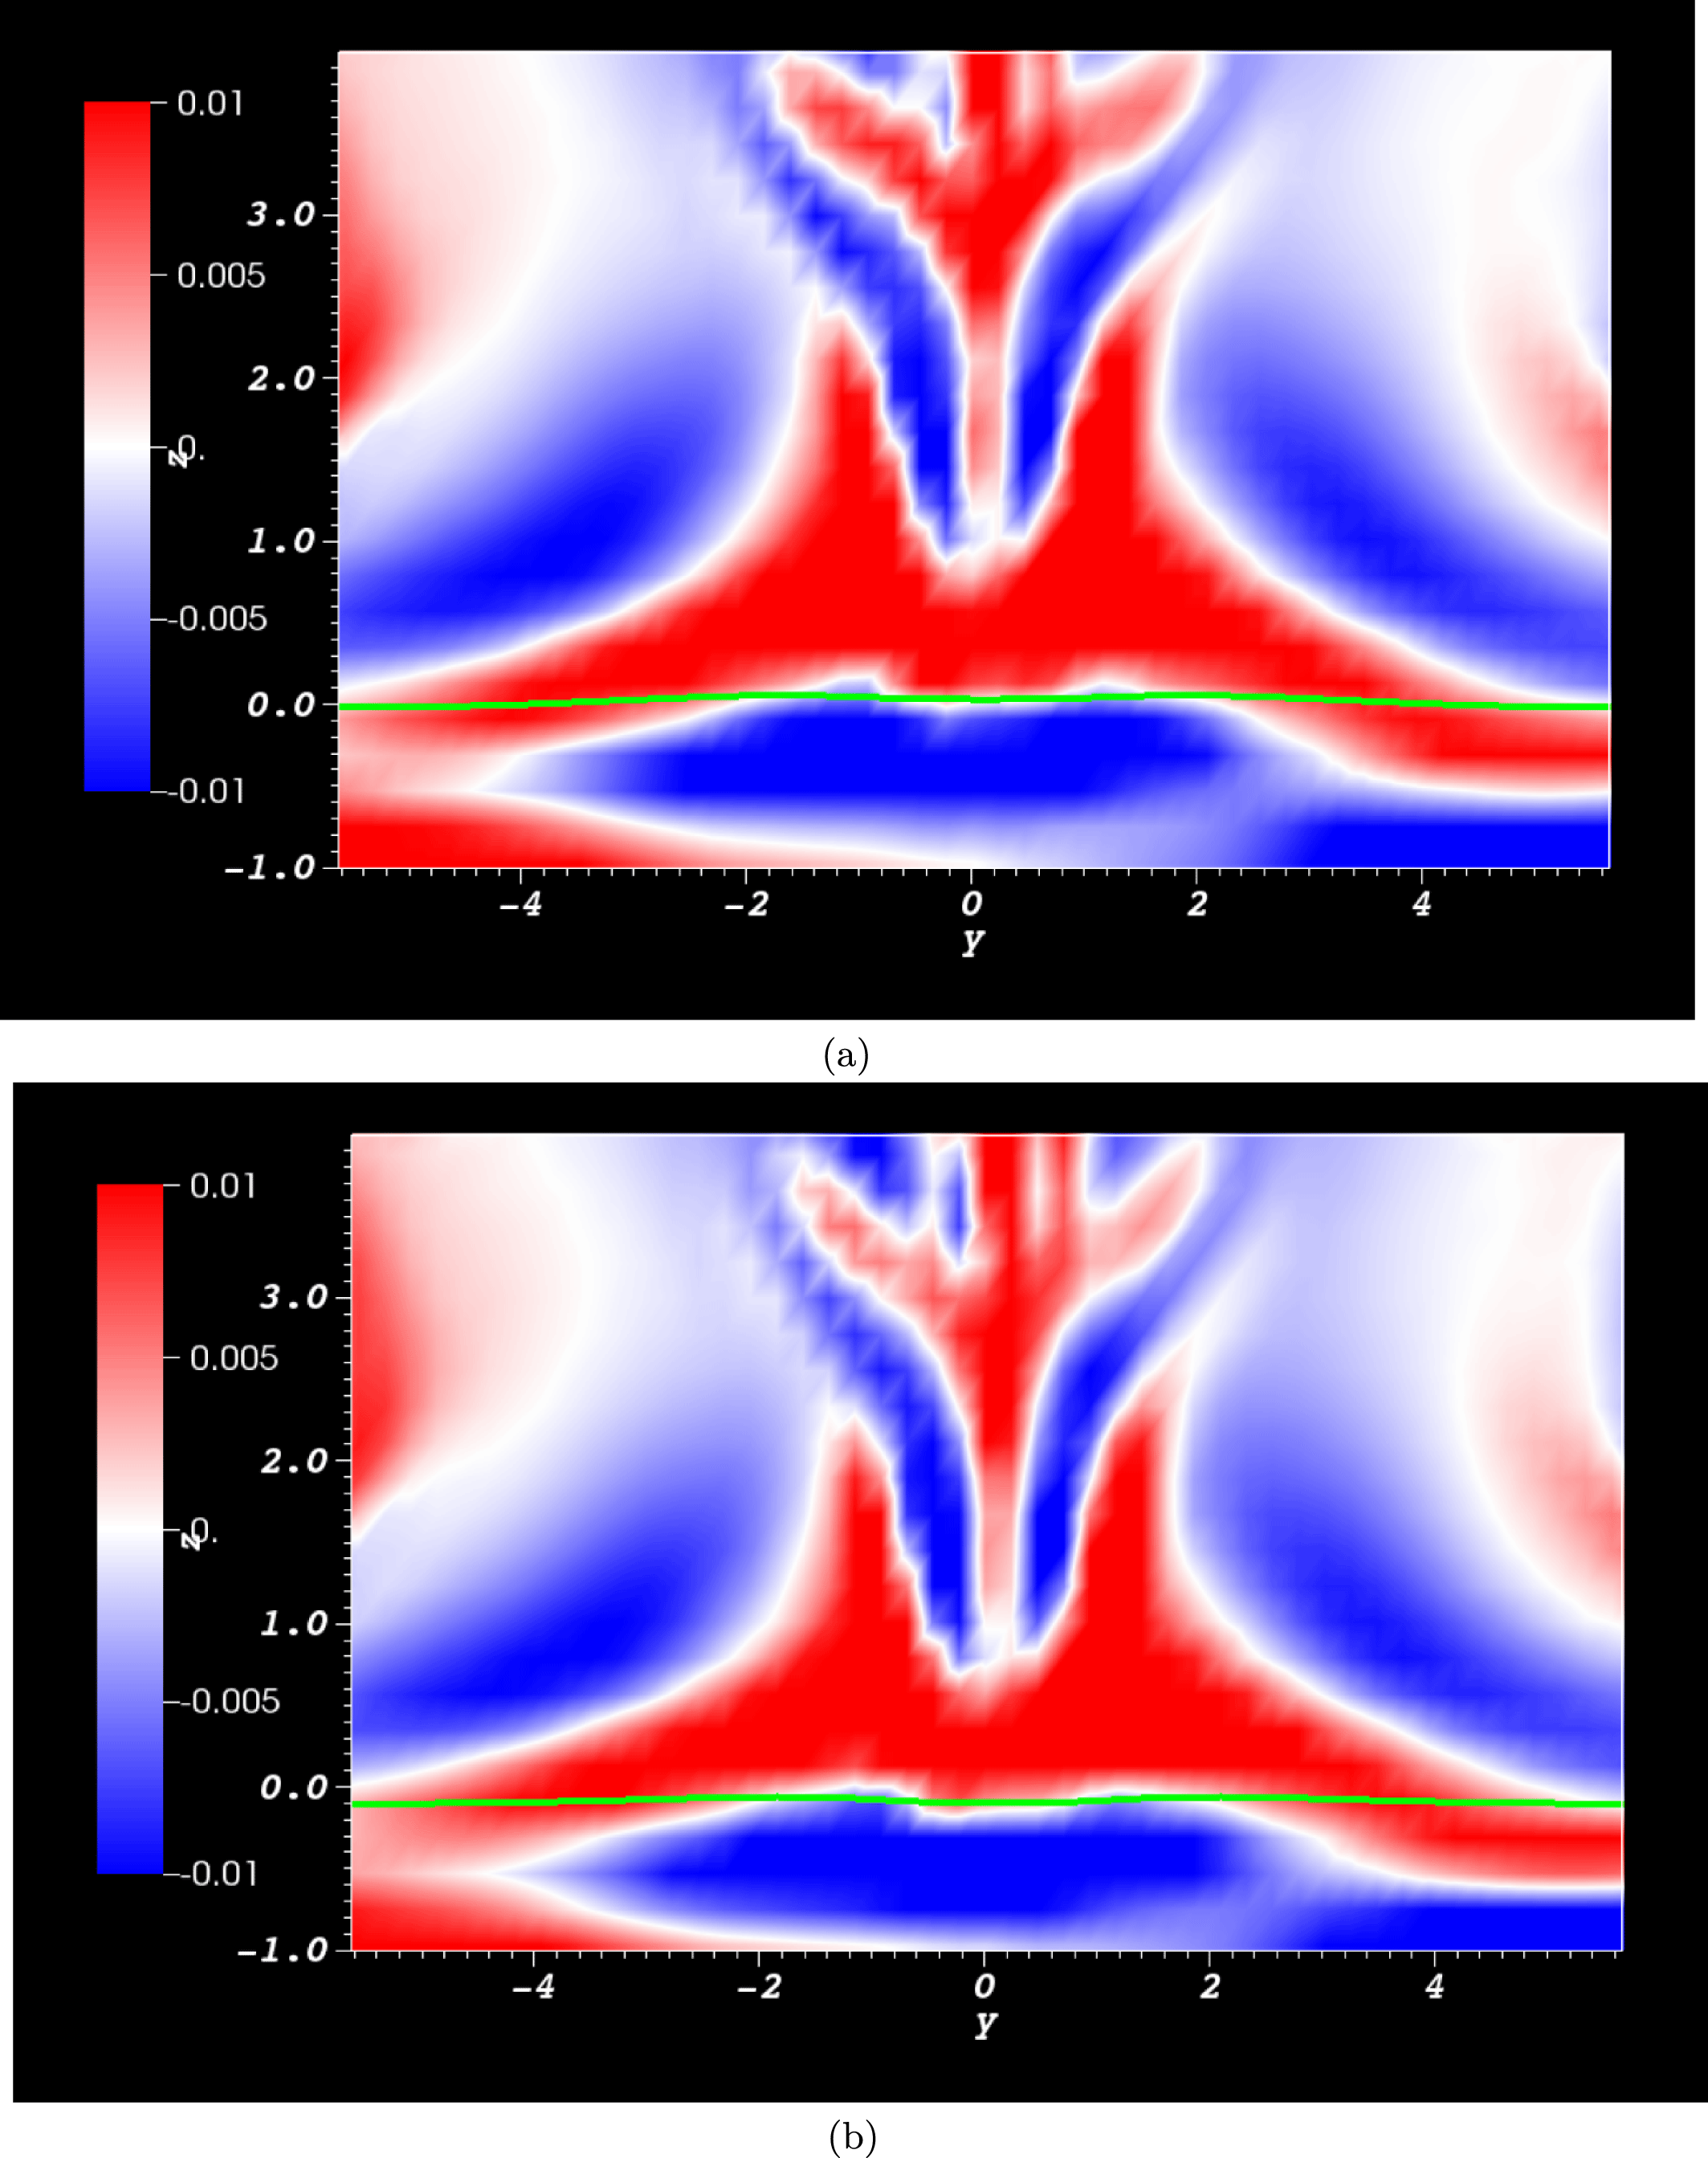
Figure 23. Slices in the
![]() $y$
–
$y$
–
![]() $z$
plane at the PIL at (a)
$z$
plane at the PIL at (a)
![]() $t=46$
and (b)
$t=46$
and (b)
![]() $t=47$
. The slices display distributions of the out of plane component of the current density. Also shown, as a green line, the
$t=47$
. The slices display distributions of the out of plane component of the current density. Also shown, as a green line, the
![]() $\unicode[STIX]{x1D70C}=1$
surface of the moving photosphere.
$\unicode[STIX]{x1D70C}=1$
surface of the moving photosphere.
Since the emerging field has very little twist, it cannot easily support dense plasma in the atmosphere. This manifests itself in the atmosphere as the buckling of the central part of the emerging field, where dense plasma drains and restricts the magnetic field in the lower atmosphere. This process is visualized in figure 15 and the pooling of dense plasma which forms can be seen in figure 21. The patch of negative
![]() $\text{d}{\mathcal{L}}_{v}/\text{d}t$
, described above, indicates the beginning of motion leading to submergence, that is, the movement of helicity carrying field from the atmosphere down to the photospheric boundary. We now characterize various stages of the emergence up to and including this submergence event.
$\text{d}{\mathcal{L}}_{v}/\text{d}t$
, described above, indicates the beginning of motion leading to submergence, that is, the movement of helicity carrying field from the atmosphere down to the photospheric boundary. We now characterize various stages of the emergence up to and including this submergence event.
Figure 22(a) displays the emergence of the mixed helicity field at the (relatively) early time of
![]() $t=27$
. The slice at
$t=27$
. The slice at
![]() $x=0$
displays the
$x=0$
displays the
![]() $x$
-component of current density, the projection of magnetic field arrows on the plane and the position of the moving photosphere. What is shown is a twisted structure beginning to emerge into the atmosphere. Comparison with figure 16 shows that the helicity and winding inputs are still relatively weak. Figure 22(b) displays a similar slice but for the much later time of
$x$
-component of current density, the projection of magnetic field arrows on the plane and the position of the moving photosphere. What is shown is a twisted structure beginning to emerge into the atmosphere. Comparison with figure 16 shows that the helicity and winding inputs are still relatively weak. Figure 22(b) displays a similar slice but for the much later time of
![]() $t=42$
. Comparison with figure 16 shows that this corresponds to the helicity approaching a local (positive) maximum and the winding near its most negative value. A current structure exits in the atmosphere in figure 22(b) that was not present in (a). This current developed due to the buckling of the field due to dense plasma drainage, as described previously. This nonlinear deformation of the field has resulted in two ‘twist units’, as opposed to the single unit displayed in (a). Where the two twist units meet, at
$t=42$
. Comparison with figure 16 shows that this corresponds to the helicity approaching a local (positive) maximum and the winding near its most negative value. A current structure exits in the atmosphere in figure 22(b) that was not present in (a). This current developed due to the buckling of the field due to dense plasma drainage, as described previously. This nonlinear deformation of the field has resulted in two ‘twist units’, as opposed to the single unit displayed in (a). Where the two twist units meet, at
![]() $y=0$
and just above the photosphere, there is a small patch of negative current. This patch corresponds to the patch of negative winding displayed in figure 20(a,b), which reveals this patch growing at the later times of
$y=0$
and just above the photosphere, there is a small patch of negative current. This patch corresponds to the patch of negative winding displayed in figure 20(a,b), which reveals this patch growing at the later times of
![]() $t=45$
and
$t=45$
and
![]() $t=46$
.
$t=46$
.
As mentioned above, figure 20(c) reveals that the patch of negative winding found in figure 20(a,b) disappears. Instead, the winding distribution reveals a highly deformed PIL and winding magnitudes double that of the previous time step. This behaviour is caused by submergence. Consider figure 23. This figure shows
![]() $y$
–
$y$
–
![]() $z$
slices (at
$z$
slices (at
![]() $x=0$
) of the
$x=0$
) of the
![]() $x$
-component of the current density and the photospheric boundary at times (a)
$x$
-component of the current density and the photospheric boundary at times (a)
![]() $t=46$
and (b)
$t=46$
and (b)
![]() $t=47$
, corresponding to the times of the winding distributions in figure 20(b,c). In figure 23(a) the structure of positive current, created by dipped field in the atmosphere, is just glancing the photospheric boundary. In figure 23(b), this structure has passed slightly beneath the photospheric boundary. Despite the appearance of figure 23(a,b) being only marginally different, the submergence of a very small part of the field can have a large impact on the winding distributions (as well as the magnetograms). As submergence continues, the changing current structure leads to a large spike in the winding input (figure 19
c,d).
$t=47$
, corresponding to the times of the winding distributions in figure 20(b,c). In figure 23(a) the structure of positive current, created by dipped field in the atmosphere, is just glancing the photospheric boundary. In figure 23(b), this structure has passed slightly beneath the photospheric boundary. Despite the appearance of figure 23(a,b) being only marginally different, the submergence of a very small part of the field can have a large impact on the winding distributions (as well as the magnetograms). As submergence continues, the changing current structure leads to a large spike in the winding input (figure 19
c,d).
It is interesting to note that the original emerging field (such as the twisted unit in figure 22 a) did not lead to a spike in the winding input. It was only after the emerged field above the photosphere changed and this new structure was submerged that an event was detected in the time series.
Further confirmation that submergence dominates these helicity and winding time series is found, as we did for the twisted case, by examining the velocity flux. Time series of the velocity flux and the
![]() $\text{d}H/\text{d}t$
are compared in figure 24(a). After
$\text{d}H/\text{d}t$
are compared in figure 24(a). After
![]() $t=40$
,
$t=40$
,
![]() ${\mathcal{V}}_{z}<0$
for the period corresponding to the draining and submergence described above. We also note that there is a correlation between oscillations in the helicity input time series and the velocity flux (figure 24
b).
${\mathcal{V}}_{z}<0$
for the period corresponding to the draining and submergence described above. We also note that there is a correlation between oscillations in the helicity input time series and the velocity flux (figure 24
b).

Figure 24. Plots of the velocity flux
![]() ${\mathcal{V}}_{z}$
and its correlation to the helicity input rate. (a) The temporal variation of
${\mathcal{V}}_{z}$
and its correlation to the helicity input rate. (a) The temporal variation of
![]() ${\mathcal{V}}_{z}$
. (b) A comparison of the temporal variation of the quantities
${\mathcal{V}}_{z}$
. (b) A comparison of the temporal variation of the quantities
![]() ${\mathcal{V}}_{z}$
and the helicity input rate
${\mathcal{V}}_{z}$
and the helicity input rate
![]() $\text{d}H/\text{d}t$
(both scaled to lie in the range
$\text{d}H/\text{d}t$
(both scaled to lie in the range
![]() $[0,1]$
).
$[0,1]$
).
6 Conclusions and discussion
This article presents simulations of the emergence of magnetic flux tubes with varying internal geometries and topologies. One simulation considers a twisted tube which has a single sign helicity (negative in this case). The other simulation focusses on a tube of mixed helicity. The two main quantities analysed are the (relative) helicity
![]() $H$
and the winding
$H$
and the winding
![]() $L$
, both found by considering their rate of change through the photosphere. We have performed calculations through a planar surface, representing the initial position of the photosphere in the simulations, as well as a surface of constant density which represents a (potentially) changing photosphere. Both quantities (
$L$
, both found by considering their rate of change through the photosphere. We have performed calculations through a planar surface, representing the initial position of the photosphere in the simulations, as well as a surface of constant density which represents a (potentially) changing photosphere. Both quantities (
![]() $H$
and
$H$
and
![]() $L$
) rely on the same baseline information, the changing entanglement of the points at which magnetic field lines pierce the photosphere, i.e. the evolving field topology affected by both the in-plane fluid motion and the vertical motion of the field passing through the photosphere. The major difference between
$L$
) rely on the same baseline information, the changing entanglement of the points at which magnetic field lines pierce the photosphere, i.e. the evolving field topology affected by both the in-plane fluid motion and the vertical motion of the field passing through the photosphere. The major difference between
![]() $H$
and
$H$
and
![]() $L$
is the weighting of magnetic flux for the helicity input. The following observations emerge from the analysis:
$L$
is the weighting of magnetic flux for the helicity input. The following observations emerge from the analysis:
(i) Large oscillations in the helicity input are consistently related to the reversal of plasma flow across the photosphere, occurring in both the single sign and mixed helicity emergence simulations. These reversals appear in the spatial distributions of the helicity and winding rates as the temporally varying sign of clear structures. These structures can be further correlated to the appearance of flux structures in the magnetogram distributions, leading to several features in the magnetograms being linked to submergence rather than emergence.
(ii) The winding time series tends to be far more sensitive to the emergence (submergence) of field topology and can detect individual events of helicity/winding carrying structures intersecting the photospheric boundary. The helicity time series tends to give more gradual variations in input. It is sensitive to the emergence (submergence) of topologically complex field when this is linked to the transport of significant magnetic flux crossing the photospheric boundary.
(iii) The ratios of the input of helicity and winding to their unsigned equivalents is far larger for the twisted emergence than for the mixed helicity emergence. This result was to be expected based on the initial conditions: the twisted tube has net helicity, the mixed helicity field does not.
(iv) It is important to take the changing geometry of the photosphere into account, particularly for the calculation of the winding. It is also important to remove the effect of weak or unresolved field, which can affect the winding calculation both quantitatively and qualitatively.
Based on our analysis of the simulations, we make the following suggestions which may aid or enhance the analysis of observational flux emergence data:
(i) We recommend that both the helicity and winding input distributions and time series should be calculated. This task should be straight forward, in one sense, as the only main difference in the calculation of the winding compared to the helicity is to substitute an indicator function measuring the sign of $B_{z}$
instead of $B_{z}$
itself. Since the winding is more sensitive to noise, however, suitable preprocessing of the observational data will be required. If possible, the varying geometry of the photosphere should be accounted for as it can affect both the magnitude and morphology of the input time series.
$B_{z}$
itself. Since the winding is more sensitive to noise, however, suitable preprocessing of the observational data will be required. If possible, the varying geometry of the photosphere should be accounted for as it can affect both the magnitude and morphology of the input time series.(ii) We recommend that the behaviour of the helicity and winding rates and distributions should be correlated to the vertical velocity flux, where possible. This would aid in determining if a new structure in a magnetogram is the result of emergence or submergence, a task which would be difficult if reliable information is restricted only to photospheric magnetograms. On that note, we acknowledge that the $\text{d}H/\text{d}t$
and ${\mathcal{V}}_{z}$
time series for the twisted field simulation show a shift between anti-correlation and correlation (figure 9
d), while for the mixed helicity simulation these quantities appear to be more coherently correlated (figure 24
b). Although we have not investigated the relationship between the time series in detail, that is beyond recognizing when magnetic field is emerging or submerging, it is an area worthy of future study and may reveal important characteristics of the emergence of different types of magnetic field.
${\mathcal{V}}_{z}$
time series for the twisted field simulation show a shift between anti-correlation and correlation (figure 9
d), while for the mixed helicity simulation these quantities appear to be more coherently correlated (figure 24
b). Although we have not investigated the relationship between the time series in detail, that is beyond recognizing when magnetic field is emerging or submerging, it is an area worthy of future study and may reveal important characteristics of the emergence of different types of magnetic field.(iii) We recommend a combined analysis of the winding input time series and distributional information. These can be used to detect events in which magnetic field structures with complex topology pass through the photosphere (from above or below). This approach provides more information than magnetogram distributions, which indicate new emergence/submergence events but no information regarding their topological content. However, care must be taken to discount events which have significantly weak magnetic field and may be spurious. Such events may have little significance for the overall evolution of the emerging magnetic field. This point is made clear in the difference between the winding series for the mixed helicity field. In the non-moving surface case the sign of the total helicity and winding inputs differ (figure 16 b,d). It is entirely plausible that this can occur for a field which has significant small-scale but well defined topology (something with a high winding measure) that occurs in a region of weak field ( $B_{z}\ll 1$
). Then the helicity assigns a very small weight to this topology (winding) due to the multiplication by a very small $B_{z}$
. However, as discussed above, in simulations of emergence into an, initially, magnetically empty region above the photosphere, there is a current sheet surrounding the emerging flux rope. In practice this leads to a small region on the boundary of the emerged field where the field strength rapidly decreases to zero. The field line structure in this boundary layer is not resolved and, therefore, not to be trusted. It was found that by removing these contributions, the helicity and winding inputs have the same overall sign (see figure 19
b,d). A significant part of this change was found to be due to the cutoff in field strength applied to the winding calculations. The size of $\unicode[STIX]{x1D716}$
(used in the cutoff) that needs to be prescribed will depend on the implementation of how the magnetic field is approximated numerically. In particular, it will depend on the numerical scheme (finite difference, finite element, etc.) and the grid resolution. Without rigorous theoretical results, a ‘trial and error’ approach to $\unicode[STIX]{x1D716}$
selection is recommended. If the value is too low, the winding results will be significantly different for slightly higher values of $\unicode[STIX]{x1D716}$
. If the value is too high, field that can be resolved numerically may be removed from the calculation.
$\unicode[STIX]{x1D716}$
. If the value is too high, field that can be resolved numerically may be removed from the calculation.(iv) We recommend that both the helicity and winding ratios, $H_{t}^{r}$
and $L_{t}^{r}$
, should be calculated. Again, these calculations should be straight forward as they use the same basic information as the helicity and winding inputs. The evidence from our study suggests that a consistently low value of these ratios is indicative of an emerging mixed helicity structure where the internal twisting in the field is not dominated by one sign. Our results suggest that a ratio below $5\,\%$
is indicative of a mixed helicity field. That being said, we have only considered a strongly twisted case. For emerging fields with lower twists, the ratio may also be small and this is something to be considered in future work.
Apart from the points mentioned above, there are several directions in which to carry this work forward. So far, we have considered emerging regions before the formation of any eruptions, i.e. the motion we have studied is effectively ideal. How non-ideal effects (e.g. reconnection) change the helicity and winding signatures, including their interpretation, remains to be studied. It is known that for high magnetic Reynolds number plasmas, dissipative losses to the (relative) helicity in the volume are small (Berger Reference Berger1984; Pariat et al. Reference Pariat, Valori, Démoulin and Dalmasse2015; Sturrock et al. Reference Sturrock, Hood, Archontis and McNeill2015). This is true typically of dissipative helicity loss at the photospheric surface (Pariat et al. Reference Pariat, Valori, Démoulin and Dalmasse2015; Sturrock et al. Reference Sturrock, Hood, Archontis and McNeill2015). However, this does not necessarily imply that local reconnection rates are low (which depend on the electric current), just that the average losses are small. Thus, since there are small regions of relatively high current at the photosphere in these simulations, there may be some regions where local losses are significant. This, in turn, may lead to significant local changes in field topology.
Since our focus in this study was not on the field’s evolution above the photosphere, we did not make direct calculations of the relative helicity in the volume above the photosphere. This calculation has been performed in various flux emergence studies in which the changing structure of the field above the photosphere was of significant focus (e.g. Pariat et al. Reference Pariat, Valori, Démoulin and Dalmasse2015, Reference Pariat, Leake, Valori, Linton, Zuccarello and Dalmasse2017; Sturrock et al. Reference Sturrock, Hood, Archontis and McNeill2015). As an example comparison, the helicity input in the twisted case of this manuscript has a linear total input with an oscillatory component. This behaviour is in line with the results of Sturrock et al. (Reference Sturrock, Hood, Archontis and McNeill2015) (allowing for the fact that the oscillations in our study are larger due to the field’s twisted core getting stuck at the photosphere), who perform the relative helicity calculation in the volume and confirm, as expected, that the total helicity input is approximately equal to the relative helicity in the volume. Theoretically, as long as the emerging field does not interact with the boundaries of the computational domain and the evolution is ideal, the helicity flux and direct calculations should give identical results. Errors in different numerical implementations and resistive effects can play a role in making these results diverge, so checking both calculations is, generally, a good idea. This time, however, we feel that the above comparison with the results of Sturrock et al. (Reference Sturrock, Hood, Archontis and McNeill2015) justifies our decision to postpone such calculation checks for a thorough study of the topology of the field above the photosphere.
Further to this, previous analyses of helicity dissipation have only considered the effects of scalar diffusion. In flux emergence applications, a diffusion tensor, with components parallel and perpendicular to the magnetic field, represents a more accurate diffusion model for the region between the photosphere and the corona. Further still, diffusion perpendicular to the magnetic field can be orders of magnitude larger than that parallel to the field, in this region (e.g. Arber et al. Reference Arber, Haynes and Leake2007). Therefore, more work needs to be done to investigate both the global and local dissipative effects on helicity and winding.
Another important aspect for further study, revealed by our results, is the sensitivity of helicity and winding to changes at the photosphere. The present model should be updated to include a convectively unstable solar interior.
Acknowledgements
We acknowledge the computational resources provided by the EPSRC funded ARCHIE-WeSt High Performance Computer (www.archie-west.ac.uk), EPSRC grant no. EP/K000586/1.


