Choline is an essential micronutrient involved in multiple physiological functions, serving as a component of the predominant phospholipids in cell membranes (phosphatidylcholine and sphingomyelin) to support structural integrity and signal transduction, a precursor for the neurotransmitter acetylcholine in nerve signalling, and a methyl donor through its metabolite betaine for DNA methylation and homocysteine reduction(Reference Zeisel and da Costa1–Reference Zeisel and Blusztajn3). Betaine can be obtained from foods and endogenously derived from choline. When it acts as a methyl donor, the amount of dietary choline is spared for optimal nutrition. As an osmolyte, betaine is highly compatible with enzyme function and protects cells from environmental stress without disturbing cellular metabolism(Reference Craig4). Previous studies suggest that prolonged inadequate intake of choline may increase the risk of non-alcoholic fatty liver disease, muscle dysfunction, cancer and neurological disorders(Reference Zeisel and da Costa1,Reference Zeisel, Klatt and Caudill5) . However, unabsorbed phosphatidylcholine/choline and betaine from the diet would be transformed into trimethylamine by the gut microflora and subsequently, to trimethylamine-N-oxide by the hepatic enzyme flavin monooxygenase-3, which is widely known as a risk factor for human health conditions, including all-cause mortality, hypertension, CVD, diabetes, cancer and kidney function(Reference Li, Lu and Yuan6). To date, evidence remains insufficient to establish an estimated average requirement for choline and betaine due to scarce data on dietary intake of choline and betaine(Reference Zeisel and da Costa1,7–Reference Society9) .
Dietary choline exists in lipid-soluble forms (phosphatidylcholine and sphingomyelin) or water-soluble forms (free choline, phosphocholine and glycerophosphocholine). Two forms are different in absorption, metabolism and function though they are interconvertible in the body. Phosphatidylcholine is the most abundant form of choline in foods, especially in animal foods(Reference Zeisel and da Costa1). Plant foods like cereals, vegetables, soyabeans and legumes are also good sources of choline, particularly water-soluble forms. Generally, animal products have a higher content of total choline than plant foods(Reference Patterson, Bhagwat and Williams10). Plant foods such as spinach, quinoa and wheat germ are rich in betaine. As such, dietary intake of total choline, individual choline forms and betaine may vary in populations with different dietary patterns(Reference Van Parys, Karlsson and Vinknes11).
So far, only four studies evaluated dietary choline and betaine intake in North American and European populations with Western dietary patterns abundant in animal foods(Reference Wallace and Fulgoni12–Reference Yonemori, Lim and Koga15). However, limited data are available on Chinese populations consuming predominantly plant-based diets. Of note, with the economic development, China has been experiencing a transition from traditional Chinese diets to westernised diets over the past decades(Reference Zhai, Du and Wang16). However, changes in dietary choline and betaine intake during the nutrition transition remain unclear in the Chinese population. Understanding these trends will help improve dietary recommendations and nutrition policy-making in China. Against this background, we investigated the trends in dietary intake and food sources of total choline, individual choline forms and betaine in Chinese adults over 20 years.
Methods
Participants
All data used in this study were derived from the China Health and Nutrition Survey (CHNS), an ongoing, open and prospective cohort study to examine how sociodemographic and economic changes in China affect nutrition and health-related outcomes across the life cycle. Initiated in 1989 with a partial sample, the full survey was conducted in 1991, 1993, 1997, 2000, 2004, 2006, 2009, 2011 and 2015. The study population was drawn by a multistage, random cluster design in each of the twelve participating provinces (Liaoning, Jiangsu, Shandong, Henan, Hubei, Hunan, Guangxi, Guizhou, Heilongjiang, Beijing, Shanghai and Chongqing). Detailed information on survey procedures has been previously described elsewhere(Reference Zhang, Zhai and Du17). The CHNS was conducted according to the guidelines laid down in the Declaration of Helsinki, and all procedures involving human subjects was approved by institutional review boards at the University of North Carolina at Chapel Hill, the National Institutes of Health (R01-HD-30880, DK-056350, R24-HD-050924, R01-HD-38700) and the National Institute of Nutrition and Food Safety (P2C-HD-050924, T32-HD-007168). Written informed consent was obtained from all participants.
Our analysis focused on adults aged 18 years or above who participated in the CHNS during 1991–2011. We excluded participants, who had missing dietary data or implausible energy intake (< 700 kcal/d or > 4200 kcal/d for men; < 500 kcal/d or 3500 kcal/d for women), who were pregnant or breast-feeding or who had incomplete records. Finally, we included 23 467 participants (11 188 men and 12 279 women) with 69 514 total observations, 63 % of whom attended at least two rounds of surveys (online Supplementary Fig. 1 and 2).
Dietary assessment
Dietary intake was assessed using three consecutive 24-h dietary recalls at the individual level in combination with a weighing measurement of food inventory at the household level over the same 3 d in each survey round by trained field interviewers. The three consecutive days were randomly allocated from Monday to Sunday. The accuracy of the dietary method has been validated previously in CHNS(Reference Zhang, Zhai and Du17). Total energy intake was calculated by multiplying the consumption of each food item by the energy content of a standard portion (100 g) based on the Chinese Food Composition Tables (C-FCT)(18–20). Intake of choline and betaine was assessed according to the US Department of Agriculture (USDA) Database for Choline Content of Common Foods, release 2(Reference Patterson, Bhagwat and Williams10). Choline and betaine content was estimated using a nutritionally equivalent food if a food item was not listed in the USDA database or calculated based on individual ingredients in the recipe if a dish was not included in the USDA database. Total choline was defined as the sum of five individual choline compounds, including free choline, phosphocholine, glycerophosphocholine, phosphatidylcholine and sphingomyelin. Water-soluble choline was calculated as the sum of free choline, phosphocholine and glycerophosphocholine, and lipid-soluble choline was calculated as the sum of phosphatidylcholine and sphingomyelin.
To calculate food sources of choline and betaine, we divided food items into ten groups: cereals, red meat, white meat, vegetables, eggs, soyabean, tubers and mixed beans, condiments (mainly soya sauce made from soya and wheat) and cooking oils. The remaining foods (e.g. dairy products, fruit, nuts, processed food products and beverages) were combined as other food groups for their contributions to total choline and betaine intake under 1 % in 1991. The proportion contribution of each food source to choline/betaine intake was calculated by choline/betaine from the corresponding food category divided by total choline/betaine intake.
Covariates
Sociodemographic factors, including age, sex, residence area, geographic region and education level, were collected using structured questionnaires. According to the natural boundary of the Qinling Mountains and the Huaihe River in China, we classified the geographic region into northern (Heilongjiang, Liaoning, Shandong, Henan and Beijing) and southern regions (Jiangsu, Hubei, Shanghai, Chongqing, Hunan, Guangxi and Guizhou). Per capita annual household income was classified into four groups according to quartiles (low, medium, high and very high) within each survey round. A comprehensive urbanisation index was developed to capture the spectrum from rural to urban environments, using indicators across twelve domains: population density, economic activity, traditional and modern markets, transportation infrastructure, sanitation, communications, housing, education, diversity, health infrastructure and social services(Reference Jones-Smith and Popkin21). Body weight and height were measured using seca 206 wall-mounted metal tapes (seca, Hamburg, Germany) per standard procedures(Reference Zhai, Du and Wang16). Body mass index (BMI) was calculated as weight (kg) divided by the square of height (m).
Statistical analysis
All statistical analyses were conducted in men and women separately. General characteristics were expressed as mean and standard deviation or median and interquartile range for continuous variables and numbers (percentages) for categorical variables. Linear mixed-effect models were used to calculate adjusted means and 95 % CI of dietary choline and betaine intake after adjusting for age, urbanisation index, total energy intake, BMI (< 18·5, 18·5–23·9, 24·0–27·9 and ≥ 28·0 kg/m2), education level (junior school or below, senior school, college or higher), household income level (quartiles) and geographic region (southern and northern). To test for linear trends, we treated the survey year as a continuous variable in the models. We also analysed the intake trends stratified by age (18–50, 50–65 and > 65 years), BMI (< 18·5, 18·5–23·9, 24·0–27·9 and ≥ 28·0 kg/m2), residence area (urban and rural), geographic region (northern and southern), urbanisation index (quartiles), education level (junior school or below, senior school, college or higher) and household income level (quartiles). The heterogeneity in intake trends by subgroups was tested with the likelihood ratio test comparing the models with and without the interaction term between survey year and subgroup variables. The proportion of participants meeting the adequate intake (AI) for choline was estimated as the number of participants reaching the AI (450 mg/d for men and 380 mg/d for women) based on the latest Dietary Reference Intakes for Chinese(Reference Society9) divided by total number of participants. All statistical analyses were performed using R version 4.2.2. All tests were two-tailed, and P ≤ 0·05 was considered statistically significant.
Results
A total of 11 188 men and 12 279 women were included in this study. Participant characteristics across the survey rounds are presented in Table 1. The mean age of men ranged from 41·5 to 51·5 years and of women from 42·1 to 51·4 years (P-trend < 0·001). Over time, the proportion of participants who resided in urban areas increased in line with increasing urbanisation index and household income level (P-trend < 0·001). Educational attainment also increased, with the proportion of participants having a college or above degree increasing from 3·2 % in 1991 to 14·4 % in 2011 among men and from 1·3 % in 1991 to 11·0 % in 2011 among women (P-trend < 0·001).
* Continuous variables are presented as mean (sd) or median (P25, P75), and categorical variables are presented as n (%).
† Linear trends across survey years were assessed by using linear mixed-effects regression models.
Trends in dietary choline and betaine intake
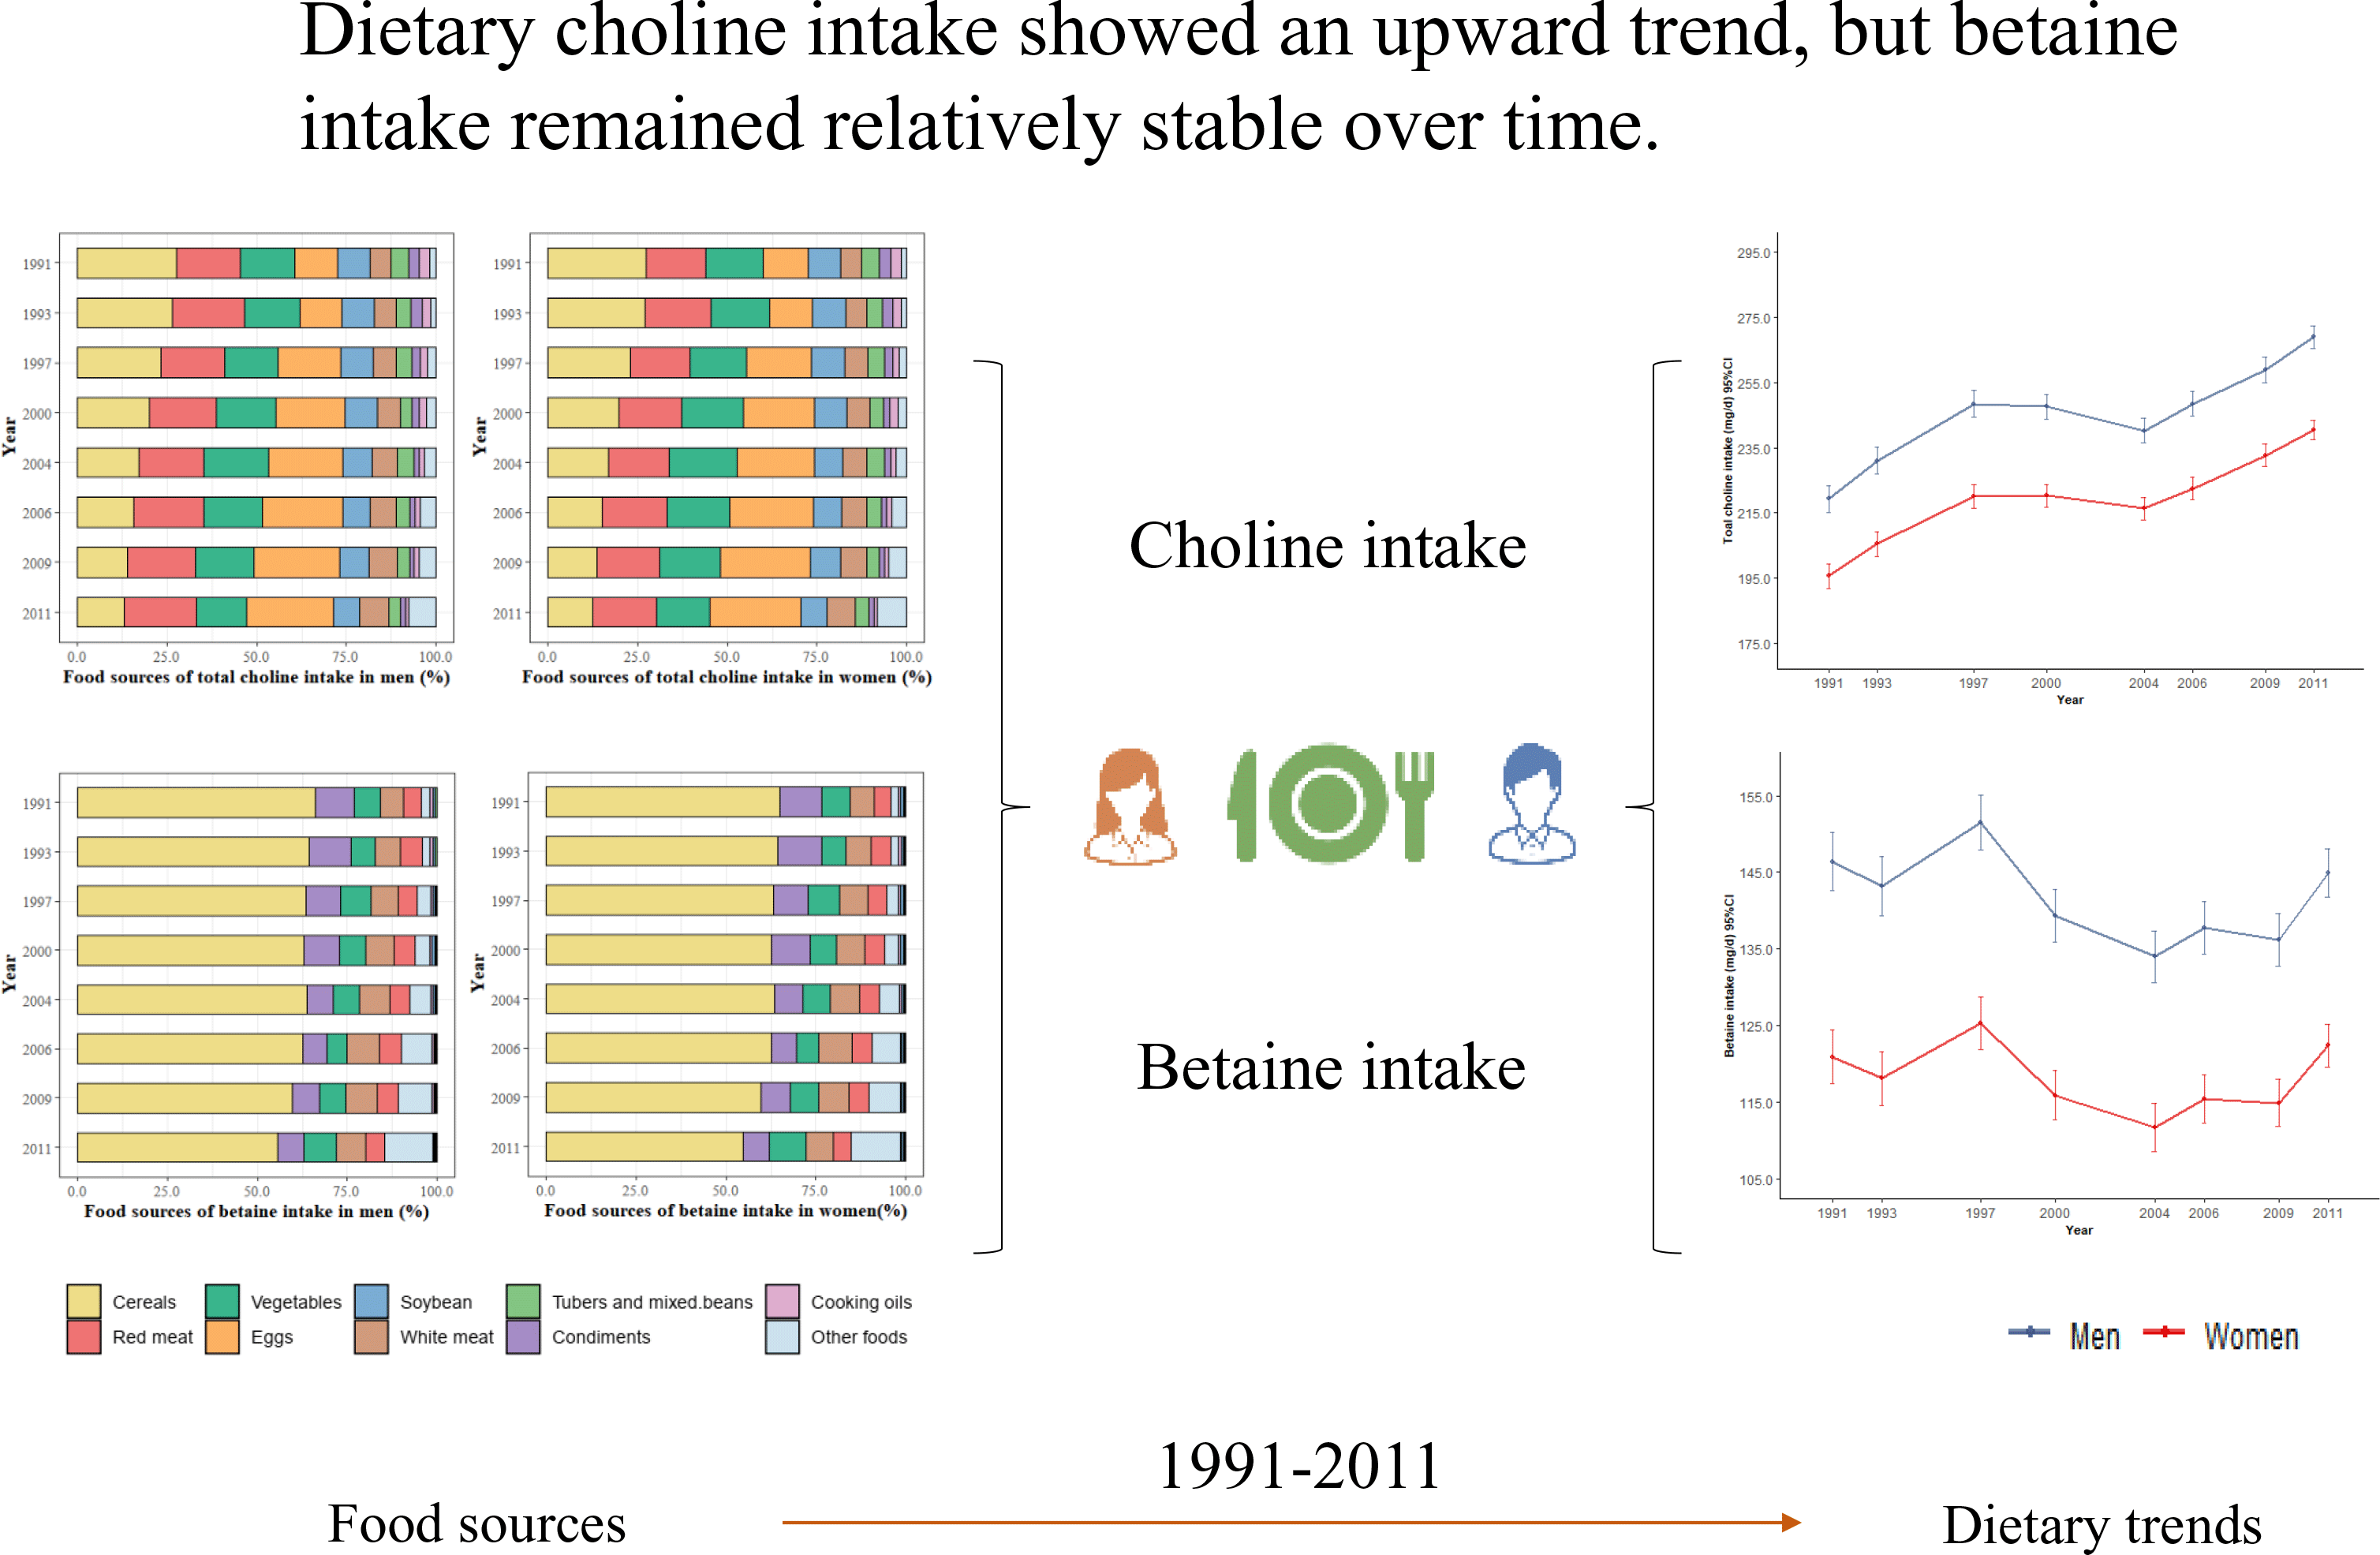
Men had higher choline and betaine intakes than women. Between 1991 and 2011, total choline intake increased from 219·3 (95 % CI 215·1, 223·4) mg/d to 269·0 (95 % CI 265·6, 272·5) mg/d in men and from 195·6 (95 % CI 191·8, 199·4) mg/d to 240·4 (95 % CI 237·4, 243·5) mg/d in women (both P-trends < 0·001) (Table 2 and Fig. 1(a)). The estimated proportion of participants reaching the AI for choline changed from 3·5 % in 1991 to 7·8 % in 2011 among men and from 4·0 % in 1991 to 9·3 % in 2011 among women (Fig. 2, P-trend < 0·001).
* Adjusted for age, urbanisation index, total energy intake, BMI (< 18·5, 18·5–23·9, 24·0–27·9 and ≥ 28·0 kg/m2), education level (junior school or below, senior school, college or higher), household income level (quartiles) and geographic region (southern and northern).
† Tests for linear trends were conducted using linear mixed-effects regression models.
Both dietary intake of water-soluble choline (from 88·1 mg/d to 96·3 mg/d in men and from 78·0 mg/d to 85·4 mg/d in women) and lipid-soluble choline (from 132·0 mg/d to 173·7 mg/d in men and from 118·3 mg/d to 155·9 mg/d in women) increased during 1991–2011 (Table 2, Fig. 1(b) and (c), all P-trends < 0·001). The relative contribution of lipid-soluble choline intake to total choline intake increased from 50·1 % in 1991 to 63·0 % in 2011 in men and from 49·9 % in 1991 to 62·8 % in 2011 in women (online Supplementary Fig. 4). Phosphatidylcholine was the predominant form of choline, increasing from 123·7 mg/d to 162·7 mg/d in men and from 111·0 mg/d to 146·4 mg/d in women between 1991 and 2011, representing 46·7 % in 1991 and 58·8 % in 2011. Free choline was the second most abundant type of choline, rising from 55·9 mg/d to 60·4 mg/d in men and from 49·3 mg/d to 53·6 mg/d in women, accounting for 31·8 % in 1991 and 23·1 % in 2011. Dietary intake of glycerophosphocholine, sphingomyelin and phosphocholine and their relative contributions to total choline intake were almost unchanged during 1991–2011 (Table 2 and online Supplementary Fig. 4).
Betaine intake ranged within 134·0–151·5 mg/d in men (P-trend < 0·001) and 111·7–122·4 mg/d in women (P-trend > 0·05), which was rolling during 1991–2011 (Table 2 and Fig. 1(d)).
Trends in food sources of choline and betaine
In men and women, food sources of choline were similar. Cereals, red meat, vegetables, eggs, soyabeans and white meat remained the top six sources of dietary total choline in each survey year, cumulatively supplying 85·7∼89·7 % of choline (Fig. 3(a) and (b)). However, choline intake from cereals, vegetables and soyabeans decreased from 51·7 %% to 34·6 % and that from eggs, red meat and white meat increased from 35·6 % to 52·2 % between 1991 and 2011. Cereals were the primary source of choline during 1991–2000 but dropped to the fourth during 2004–2011 with a continuing downward trend. Meanwhile, the contribution of eggs to total choline intake was doubled in 2011 (24·0 % in men and 25·3 % in women) compared with that in 1991 (12·0 % in men and 12·5 % in women). And it had ranked at the top since 2004 in both sexes. Water-soluble choline was mainly derived from plant-based foods (exceeding 65 %), including cereals, vegetables, soyabeans, tubers and mixed beans (Fig. 3(c) and (d)). Whereas lipid-soluble choline was primarily sourced from animal products, including red meat, eggs and white meat, whose contribution increased from 51·1 % to 69·5 % in men and from 50·3 % to 67·9 % in women during 1991–2011. Cereals were the main food source of betaine; however, its contribution to betaine intake decreased from 66·2 % to 55·7 % in men and from 65·0 % to 54·7 % in women between 1991 and 2011. (Fig. 3(g) and (h)).
Trends in dietary choline and betaine intake in subgroups
Chinese adults among different age groups had similar dietary choline intake in 1991; however, older adults (>65 years) showed the least increase in choline intake over time (P-interaction < 0·001, online Supplementary Table 1–2). For both sexes, the estimated proportion of choline intake reaching the AI remained the lowest in older adults (online Supplementary Fig. 3(a) and (b)). Chinese adults with higher BMI (online Supplementary Tables 3 and 4), living in urban areas (online Supplementary Tables 5 and 6), with higher urbanisation indexes (online Supplementary Tables 9 and 10), education level (online Supplementary Tables 11 and 12) and household income level (online Supplementary Tables 13 and 14) had a higher intake of and a larger increase in dietary choline than their counterparts (P-interaction < 0·05). Dietary choline and betaine intake was lower in the southern than in the northern, but the gap had been narrowing over time (all P-interactions < 0·05 except for lipid-soluble choline in women; online Supplementary Table 7 and 8).
Discussion
During 1991–2011, dietary total choline intake grew by nearly 20 % in both Chinese men and women, with a remarkable increase in lipid-soluble choline (particularly phosphatidylcholine) intake and a slight increase in water-soluble choline intake. Consequently, in 2011, the proportion of adults achieving AI for choline was about 2·3 times that in 1991. Adults with younger age, higher BMI or higher socio-economic status had a higher choline intake and experienced more growth of the intake. Cereals, red meat, vegetables, eggs, soyabeans and white meat remained the top six food sources of choline. However, choline from animal foods (e.g. red meat, eggs and white meat) steadily increased by about 16 %, whereas choline from plant foods (e.g. cereals, soyabeans and vegetables) gradually declined by about 17 %, which was consistent with the transition from traditional plant-based diets to westernised dietary patterns during the past decades in China(Reference Zhai, Du and Wang16). Dietary betaine intake was relatively steady over time.
Although dietary total choline intake had increased substantially in Chinese adults during 1991–2011 (219·3–269·0 mg/d in men and 195·6–240·4 mg/d in women), it was still lower compared with that in Americans (405 (sd 3·30) mg/d in men and 273 (sd 2·13) mg/d in women during 2009–2014)(Reference Wallace and Fulgoni12), Europeans (332–468 mg/d in men and 269–404 mg/d in women during 2000–2012)(Reference Vennemann, Ioannidou and Valsta13) and Japanese (445–513 mg/d in men and 388–442 mg/d in women during 1992–2008)(Reference Nagata, Wada and Tamura22). In terms of individual choline forms, phosphatidylcholine was the predominant form of choline, followed by free choline, glycerophosphocholine, phosphocholine and sphingomyelin in our study, which is consistent with other studies(Reference Van Parys, Braekke and Karlsson23–Reference Cho, Zeisel and Jacques26). By 2011, phosphatidylcholine intake among Chinese adults had risen and approached that observed in other populations(Reference Van Parys, Karlsson and Vinknes11,Reference Yonemori, Lim and Koga15) . Glycerophosphocholine intake was notably lower, often half or even less compared with other populations(Reference Van Parys, Karlsson and Vinknes11,Reference Yonemori, Lim and Koga15,Reference Van Parys, Braekke and Karlsson23,Reference Yang, Lipworth and Shu27) , and almost unchanged in China during 1991–2011. AI of choline is needed for neurotransmitter synthesis, cell membrane signalling, lipid transport and methyl group metabolism(Reference Zeisel and da Costa1). However, higher choline intake, particularly phosphatidylcholine, has been associated with an elevated risk of CVD, diabetes, cancers and all-cause mortality, which was partly mediated by gut microbial production of trimethylamine-N-oxide(Reference Li, Lu and Yuan6,Reference Tang, Wang and Levison28) . Although individual choline forms are interchangeable in the body, their bioavailability and effects on human health are different(Reference Leermakers, Moreira and Kiefte-de Jong29). Further studies are required to examine the association between different forms of choline intake and health outcomes in Chinese adults.
Consistent with findings from previous studies(Reference Wallace and Fulgoni12,Reference Vennemann, Ioannidou and Valsta13,Reference Yonemori, Lim and Koga15,Reference Nagata, Wada and Tamura22) , men exhibited greater choline intake than women, partially attributed to their larger food consumption. Of note, we observed significant differences in dietary choline intake among Chinese adults with different socio-economic status. Chinese adults in urban areas or with higher BMI, urbanisation indexes, education level and household income level had a higher dietary choline intake than their counterparts and also underwent more increases in the intake. Two studies reported comparable dietary choline intake in urban communities of Shanghai (318 mg/d in men and 289 mg/d in women) and Taiwan (372 mg/d in men and 265 mg in women)(Reference Yu, Shu and Xiang30,Reference Chu, Wahlqvist and Chang31) to our participants residing in urban areas.
Our results showed that the major food sources of choline were cereals, red meat, vegetables, eggs, soyabeans and white meat in both sexes. However, the relative contribution of animal foods to dietary choline had been progressively increasing, whereas that of plant foods had been continuously decreasing over time. The changes in food sources of choline, as well as dietary intake of lipid-soluble, were aligned with the transition of Chinese diets with the economic growth and rapid modernisation in China(Reference Zhai, Du and Wang16). The national nutrition surveys from 1982 to 2012 showed that the traditional Chinese diets characterised by large amounts of cereals and vegetables and relatively low amounts of animal foods gradually transitioned to a westernised diet rich in animal foods and processed foods(Reference Huang, Wang and Wang32). The ranking of food sources of choline in our population during 2004–2011 was similar to that in westerners(Reference Yonemori, Lim and Koga15,Reference Van Parys, Braekke and Karlsson23,Reference Chiuve, Giovannucci and Hankinson25,Reference Detopoulou, Panagiotakos and Antonopoulou33) , but their relative contributions were different. Compared with Americans(Reference Yonemori, Lim and Koga15,Reference Chiuve, Giovannucci and Hankinson25,Reference Cho, Zeisel and Jacques26) and Europeans(Reference Vennemann, Ioannidou and Valsta13,Reference Van Parys, Braekke and Karlsson23,Reference Detopoulou, Panagiotakos and Antonopoulou33) , Asians consumed more choline from eggs, seafood and soya foods and less choline from red meat, poultry and dairy products(Reference Yonemori, Lim and Koga15,Reference Nagata, Wada and Tamura22) . For water-soluble choline, coffee, dairy products and white meat accounted for more than 40 % in the Nurses’ Health Study(Reference Chiuve, Giovannucci and Hankinson25); and dairy products, drinks, white meat and vegetables accounted for over 70 % in the Hordaland Health Study(Reference Van Parys, Braekke and Karlsson23), whereas plant foods including cereals, vegetables, soyabeans, and tubers and beans accounted for above 65 % in Chinese adults. The consumption of processed food has increased markedly since 1991(Reference Zhai, Du and Wang16), which may explain the increasing contribution of other food groups to choline intake in our study.
Dietary betaine intake was relatively steady during 1991–2011 (134·0–151·5 mg/d in men and 111·7–125·3 mg/d in women) in Chinese adults, which were lower than that in Greek (306–314 mg/d)(Reference Detopoulou, Panagiotakos and Antonopoulou33) and Japanese (239–350 mg/d)(Reference Nagata, Wada and Tamura22). Nevertheless, previous studies conducted in Guangzhou(Reference Zhang, Pan and Li34) and Taiwan(Reference Chu, Wahlqvist and Chang31) reported similar betaine intake to our study. Unlike choline, plant foods, especially wheat, are the most common sources of betaine(Reference Ross, Zangger and Guiraud35). Wheat consumption had decreased since 1982 and then slightly increased from 2002 to 2013 and other cereals (mainly whole grains) continuously declined during 1982–2013 among Chinese adults(Reference Yu, Zhao and Zhao36), which might explain the fluctuation in betaine intake in the current study. As a methyl donor, betaine transfers the one-carbon unit to homocysteine to form serum methionine, which can reduce the amount of dietary choline required(Reference Craig4). Epidemiological studies have shown that higher betaine intake, whether from diet or supplements, is associated with lower concentrations of total homocysteine and inflammatory markers, reduced risk of hypertension, CVD and mortality, as well as improved muscle strength, and better liver and kidney health in humans(Reference Cho, Zeisel and Jacques26,Reference Yang, Lipworth and Shu27,Reference Detopoulou, Panagiotakos and Antonopoulou33,Reference Millard, Musani and Dibaba37,Reference Mirrafiei, Radkhah and Chambari38) . We observed that adults in southern China had a lower betaine intake than those in northern China, which might be likely due to differences in dietary patterns. Southerners generally consumed rice-based diets, characterised by large amount of rice, vegetables, red meat, poultry and fish, whereas northerners usually adopted wheat-based diets, characterised by high consumption of wheat, tubers and eggs and low consumption of vegetables and meat(Reference Zhao, Zhao and Gao39). Different staple food selections may largely contribute to variations in betaine intake across China. Overall, 100 grams of rice contains less than 1 mg of betaine, while 100 grams of wheat has 70 mg of betaine(Reference Yu, Zhao and Zhao36).
To our knowledge, this study is the first to demonstrate the trends in dietary intake and food sources of total choline, individual choline forms and betaine over 20 years in a large sample of Chinese adults. The CHNS study is unique because it captures the economic, social and nutritional changes in China during the past decades. However, several limitations should also be acknowledged. First, consecutive 3-d 24-h dietary records might not represent long-term dietary intake and cannot reflect seasonal variations in diets. Second, the content of choline and betaine referred to the USDA database due to limited data in the C-FCT.
In conclusion, our study showed an upward trend in dietary intake of choline, particularly phosphatidylcholine, in Chinese adults during 1991–2011. The main contributors to dietary choline converted from plant foods to animal sources. Adults with older age and lower socio-economic status were at increased risk of choline deficiency. Betaine intake remained relatively stable. These findings will enhance our understanding of changes in dietary choline and betaine intake during the nutrition transition and inform nutrition policy-making in China. Moderately increasing the consumption of animal-derived foods, such as eggs, red meat, poultry and seafood, will help increase choline intake among vulnerable populations. However, further studies are needed to explore the long-term influences of these changes on the health of the Chinese population.
Supplementary material
For supplementary material/s referred to in this article, please visit https://doi.org/10.1017/S0007114524002691
Acknowledgements
This research used data from CHNS. The authors thank the National Institute for Nutrition and Health, China Center for Disease Control and Prevention, Carolina Population Center (P2C-HD-050924, T32-HD-007168), the University of North Carolina at Chapel Hill, the National Institutes of Health (R01-HD-30880, DK-056350, R24-HD-050924, R01-HD-38700) and the National Institutes of Health Fogarty International Center (D43-TW-009077, D43-TW-007709) for financial support for the CHNS data collection and analysis files from 1989 to 2015 and future surveys and the China-Japan Friendship Hospital, Ministry of Health, for support for CHNS 2009, Chinese National Human Genome Center at Shanghai since 2009, and Beijing Municipal Center for Disease Prevention and Control since 2011.
No funding.
P. Y. C. and S. L. W. contributed equally to the paper. P. Y. C., S. L. W., H. L. Z., K. J. L. and A. P. F. contributed to the conception of the study and designed the research. P. Y. C. performed the analyses and wrote the draft of the manuscript. S. L. W., P. S. T., Y. S., J. L. L., T. Y. P., W. T. W., W. L., K. J. L. and A. P. F. contributed to data collating, suggestion on statistical analysis, interpretation of findings and revision of the manuscript. A. P. F. critically revised the manuscript. All authors read and approved the final version of the manuscript and agree to be accountable for all aspects of work ensuring integrity and accuracy.
The authors declared none.
Data described in the manuscript, code book and analytic code will be made available upon request.