Introduction
Climate change and global warming have become important topics for the scientific community and media in recent years. The concentrations of greenhouse gases such as carbon dioxide in the atmosphere, which absorb outgoing longwave radiation and are responsible for global warming, have been increasing dramatically. Though evidence for global climate change has been well established by scientific communities around the world, the effects of these changes on regional climates still need to be investigated. Regional-scale forcings induced by the regional topographical features, along with land-use characteristics, modify the effect of climate change. For example, the special orographical features of the Indian subcontinent, such as the high Himalayan mountain ranges, can have an impact on climate change. Since we are concerned about the consequences of global warming and climate change in the future, it is necessary to study the effect of global climate changes on the regional scale. Limited-area models, which are mostly used for mesoscale weather forecasting, are also being used for regional climate-change studies, by nesting them with global circulation models (Reference Giorgi and MearnsGiorgi and Mearns, 1991). Several dynamical and statistical models have been used in climate-change studies over the Himalaya (Reference Bajracharya, Mool and ShresthaBajracharya and others, 2007; Reference ChaujarChaujar, 2009; Reference Marke and HankMarke and Hank, 2009; Reference ShresthaShrestha, 2009).
The changing climate and warming of the atmosphere has a large impact on water resources, agriculture and the overall economy of the country. Variations in the frequency and intensity of extreme weather events, such as floods, droughts, cyclones and western disturbances, and the occurrence of weather events such as heat and cold waves over India allow scientific communities to examine whether parameters associated with these events can be considered as evidence for climate change in India. Thus it is necessary to study different aspects of climate change, based on the available long-term data over the region.
Several observational studies show significant temperature and precipitation changes in India over the long term. A recent study shows that the all-India mean annual temperature increased by 0.5°C during 1901–2003 (Reference Kothawale and Rupa KumarKothawale and Rupa Kumar, 2005). This increase is consistent with the expected effects from global warming. The trend in the pre-monsoon (March–May) temperature over the western Himalaya has been studied by Reference Yadav, Park, Singh and DubeyYadav and others (2004) using observations and reconstructions from tree rings. They found the pre-monsoon minimum temperature tended to decrease during the late 20th century. They also found that the rate of decrease of minimum temperature is three times that of the rate of decrease of maximum temperature, indicating that the minimum temperature is the larger contributor to the cooling trend in the pre-monsoon mean temperature. The temperature and precipitation trends over north and south India for different phases of the monsoon were investigated by Reference Dash and HuntDash and Hunt (2007) and Reference Dash, Jenamani, Kalsi and PandaDash and others (2007). They found large differences in trends in minimum temperature and cloud cover between north and south India and asymmetry in increasing temperature trends between different seasons. They also found a reduction in the summer monsoon (June–September) rainfall over India, and suggested this reduction can be explained by both climate change and the mesoscale effects of the mountains on monsoon flow. Long-term trends in the maximum, minimum and mean temperatures over the northwestern Himalaya during the 20th century (Reference Bhutiyani, Kale and PawarBhutiyani and others, 2007) suggest a significant rise in air temperature in the northwestern Himalaya, with winter warming occurring at a faster rate. The study also shows that significant warming started in the late 1960s, with the highest rate of increase between 1990 and 2009. Reference Dimri and GanjuDimri and Ganju (2007) simulated wintertime temperature and precipitation over the western Himalaya. They used a regional climate model and found that temperature is underestimated and precipitation is overestimated in the Himalaya. However, studies by Reference Fowler and ArcherFowler and Archer (2006) show some conflicting results. Using Upper Indus Basin (UIB) data, they show a decreasing trend in mean annual temperature since the 1960s, that has become more pronounced since the 1970s. In contrast, they found an increasing trend in mean winter (December–February) temperature during 1960–2000. The changing trends of temperature and precipitation over the western Himalaya were examined by Dimri and Kumar (2008), who calculated the number of warm and cold events during winter (December-February) for 1975–2006. They found a trend of increasing temperature and decreasing precipitation at some specific locations. Observational studies (Reference Kripalani, Kulkarni and SabadeKripalani and others, 2003) also revealed that the area of spring snow cover across the western Himalaya has been declining and the snow has been melting faster from winter to spring since 1993, which may be due to global warming.
In this paper, we investigate these changing patterns over the western Himalaya. The region is an important source of snow and ice. Snowfall starts in early November and stops by the end of April, depending on the altitude of the area. Glacial ice is found over the Karakoram mountain range throughout the year. It is therefore important to study the impact of global climate change and warming on the glaciers, snow and ice of this region. In the complex mountainous regions of the western Himalaya, only a limited number of studies were carried out during the period 1901–2003 to analyze the temperature and precipitation trends in the global climate-change scenario.
The present study extends recent results to highlight certain trends and present possible explanations, in terms of cloud amount and occurrences of western disturbances. We present spatial as well as temporal variability of the trends in temperature, snowfall and cloud amounts over the western Himalayan region as a whole, and also over its four mountain ranges: Pir Panjal, Shamshawari, Greater Himalaya and Karakoram.
Data and Methodology
The Snow and Avalanche Study Establishment (SASE) is involved in weather and avalanche forecasting for the western Himalaya. The observational network of SASE includes ∼60 surface observatories and three upper-air stations spread over the western Himalaya. Data are collected from these stations twice a day (at 0830h and 1730h Indian Standard Time (IST)). The maximum and minimum temperatures are collected using maximum and minimum thermometers and the diurnal mean is calculated by taking a simple average of these two values. The snowfall is collected over a snow stack (a plane surface with a 1 m measuring stick perpendicular to the surface) every 3 hours during a snowstorm, otherwise at 0830 h and 1730h IST. The 24 hour accumulated snow depth was measured and used in this study. Different snow and meteorological data have been collected over these stations and archived at SASE for different periods of time. In the present study, the longterm observed wintertime data (November–April) of maximum, minimum and mean temperature, snowfall, cloud percentage, number of occurrences of western disturbances and number of snowfall days at 18 SASE station locations, situated in different ranges of the western Himalaya, are considered. It should be noted that data for different parameters are available for different time periods. Only years when consistent data are present for all the stations are considered here. No effort has been made to interpolate or fill in the gaps due to missing data in any month or year. Figure 1 is a map of the study region showing the meteorological stations and mountain ranges. In order to study temperature change over the western Himalaya, the anomaly of seasonal minimum, maximum and mean temperature was calculated to determine whether there is any signal of warming over the region. The total seasonal snow depth was used to study the temporal trend of snowfall. The cloud percentage was calculated, noting that 8 octa of cloud is equivalent to 100%. The number of western disturbances was obtained from the archives of SASE.
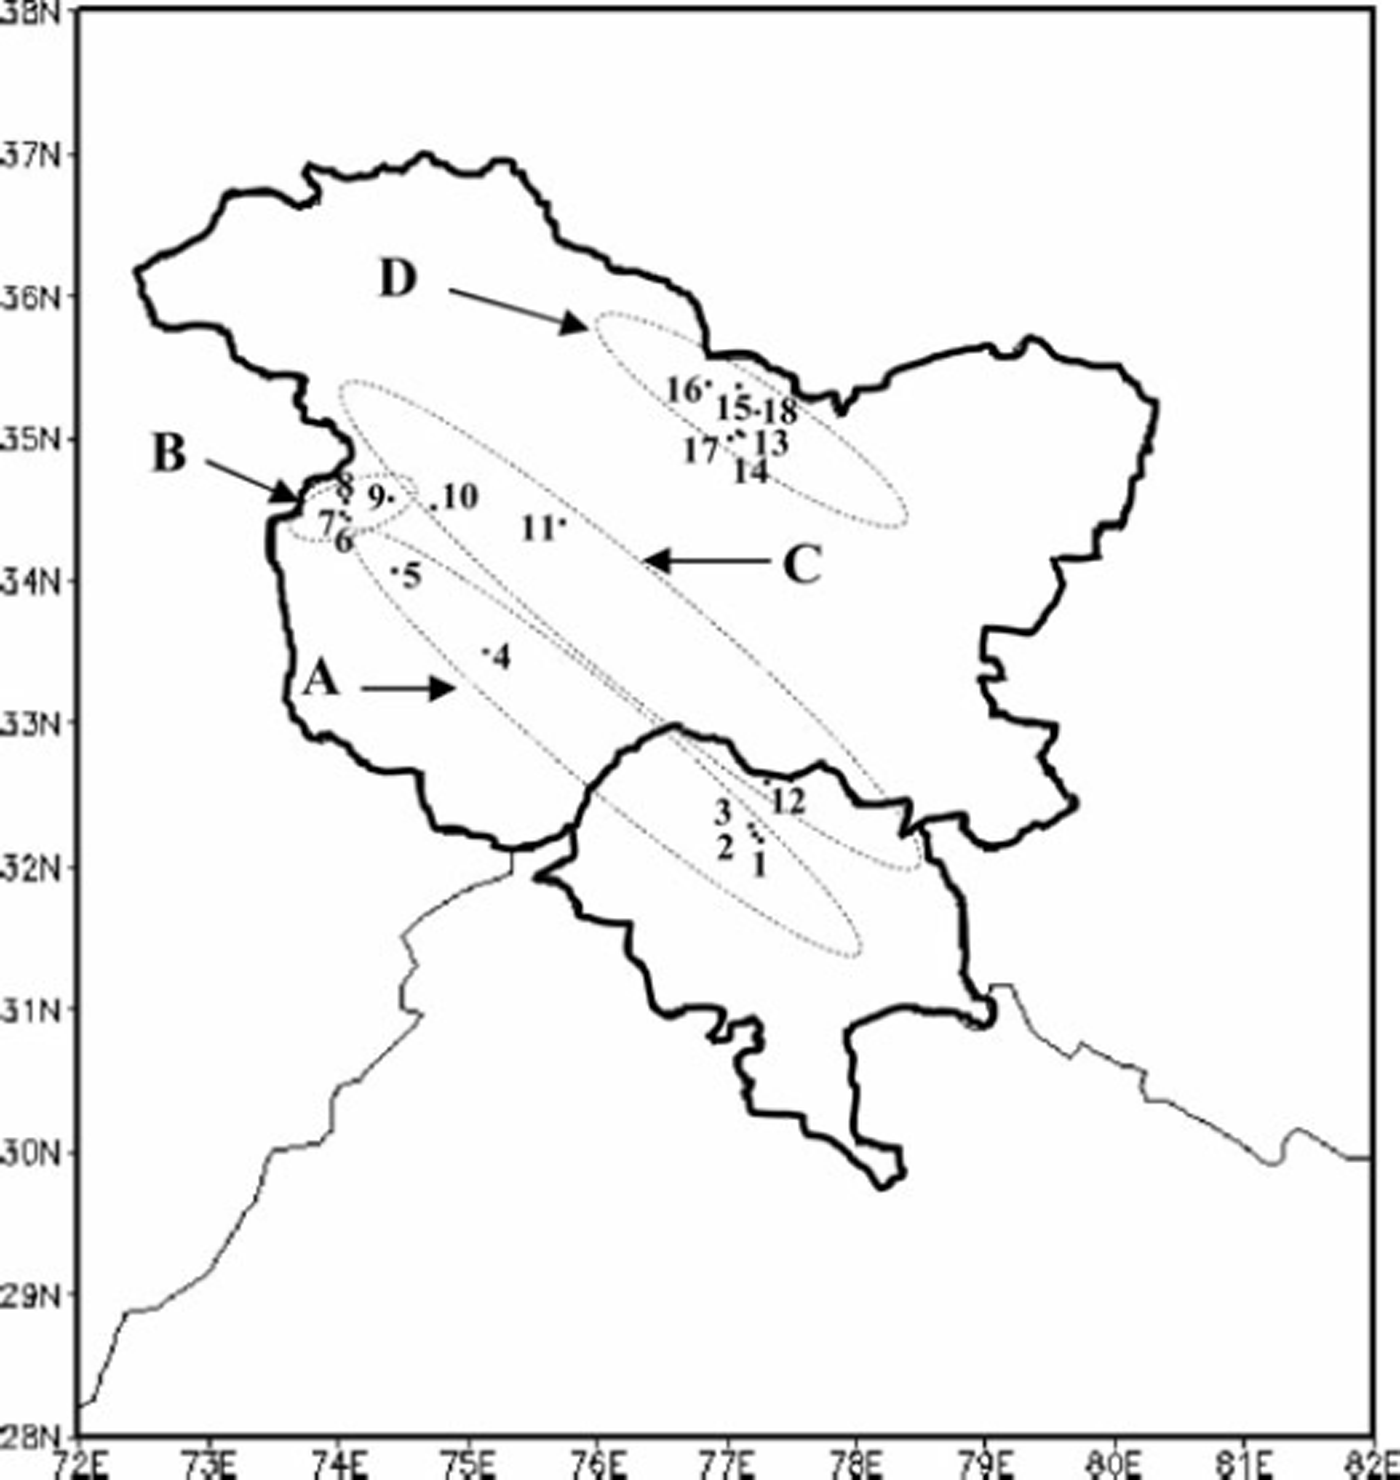
Fig. 1. A map of the study region showing the four ranges of the western Himalaya and the station locations chosen for the study. The mountain ranges are A: Pir Panjal; B: Shamshawari; C: Greater Himalaya; D: Karakoram. The station locations are listed in Table 1.
Table 1. Station locations shown in Figure 1

Results
Seasonal temperature
A study of long-term temperature trends helps to establish the first indications of global or regional warming. Figure 2 depicts the seasonal temperature anomalies in maximum, minimum and mean temperatures for 1984/85 to 2007/08. The temperatures are averaged over the 18 SASE stations. Figure 2a shows the seasonal mean temperature over the western Himalaya has increased by ∼2°C. The maximum temperature has increased by ∼2.8°C (Fig. 2b). The minimum temperature has increased by ∼1 °C (Fig. 2c), which is small in comparison to the mean and maximum temperatures. In a recent study, Reference Dash, Jenamani, Kalsi and PandaDash and others (2007) found an increase of 0.9°C in annual maximum temperature over the western Himalaya. For annual minimum temperature, they saw a decrease of ∼1.9°C during 1955–72, followed by an increasing trend over more recent decades. It is well known Shekhar and others: Climate-change studies in the western Himalaya that the western Himalaya is a complex geographical region with several local warming and cooling domains and slopes. This complexity suggests that the effects of climate change may differ from one place to another. In order to examine the changes in maximum and minimum temperature more thoroughly, four ranges of the western Himalaya (Pir Panjal, Shamshawari, Greater Himalaya and Karakoram) are considered. Results show the seasonal maximum and minimum temperatures have increased over all the ranges of the western Himalaya, except the Karakoram range, where there is a decreasing trend (Fig. 3). The Pir Panjal range shows an increase in maximum temperature of 0.8°C (Fig. 3a) and an increase in minimum temperature of 0.6°C (Fig. 3b) during the period 1988–2008. Similarly, the Shamshawari range shows an increase in maximum and minimum temperatures by 2 and 1°C, respectively (Fig. 3c and d). The Greater Himalaya shows an increase in maximum and minimum temperatures of 1 and 3.4°C, respectively (Fig. 3e and f). However, over the Karakoram range decreases of ∼1.6 and 3°C are seen in maximum and minimum temperatures, respectively (Fig. 3g and h). It should be noted that the temperature maximum is increasing at a greater rate than the temperature minimum over the Pir Panjal and Shamshawari ranges, whereas the temperature maximum is decreasing at a slower rate than the minimum over the Karakoram range. The decreasing trends in temperatures over the Karakoram range need further investigation in the context of climate change elsewhere in the western Himalaya.

Fig. 2. Time series of (a) mean, (b) maximum and (c) minimum temperature anomalies for November–April over the western Himalaya. The dotted lines in this and subsequent figures are simple trends of the time series of the parameters.

Fig. 3. Time series of maximum (a, c, e, g) and minimum temperature anomalies (b, d, f, h) for the four mountain ranges. (a, b) Pir Panjal, (c, d) Shamshawari, (e, f) Greater Himalaya and (g, h) Karakoram.
Seasonal snowfall
It is expected that changes in temperature due to climate change in the atmosphere lead to a change in the pattern of snowfall over different ranges in the western Himalaya. In general, more snowfall is expected in a warmer atmosphere, as a result of more evaporation followed by more cloud formation. However, a recent study shows reduced snowfall over the western Himalaya in a warming climate (Reference Dimri, Kumar, Satyawali and GanjuDimri and Kumar, 2008). Reduction of snowfall can be explained by the combined effect of climate change and mesoscale influences of the mountains. Figure 4 depicts total seasonal snowfall over the western Himalaya and each of its four ranges. The snowfall shows a decreasing trend over all the mountain ranges, though the magnitude of the decrease is different for different ranges. Figure 4a shows a decrease in total seasonal snowfall of 280cm over the entire western Himalaya between 1988/89 and 2007/08. The snowfall decreased by ∼280, 80 and 440 cm over the Pir Panjal, Shamshawari and Greater Himalaya ranges, respectively (Fig. 4b-e). The decreasing trends in precipitation are consistent with the increasing trends in maximum and minimum temperatures shown in Figure 3. The decreasing trend in total seasonal snowfall over the Karakoram range is only ∼40 cm. It should be noted that most of the glaciers are found in the Karakoram range of the western Himalaya. High-speed melting of glaciers across the Himalaya during the past few decades has been reported (e.g. Reference AgetaAgeta, 2001; Reference HewittHewitt, 2005). Hewitt also reported, however, that some glaciers of the central Karakoram are growing and attributed this to the higher elevations and distinct climatic regimes of these glaciers. Hewitt made a detailed examination of the central Karakoram climate data. He found an increasing trend in winter temperature which he concluded was not critical for these higher glaciers. Glaciers are melting in the eastern Himalaya due to local warming effects, such as increased fossil fuel burning and deforestation. In the present study, the decreasing trend of both maximum and minimum temperature, as well as the negligible decreasing trend in seasonal snowfall over the Karakoram range during 1988–2008, needs to be more carefully examined to determine the significance of climate change and global warming on the region.
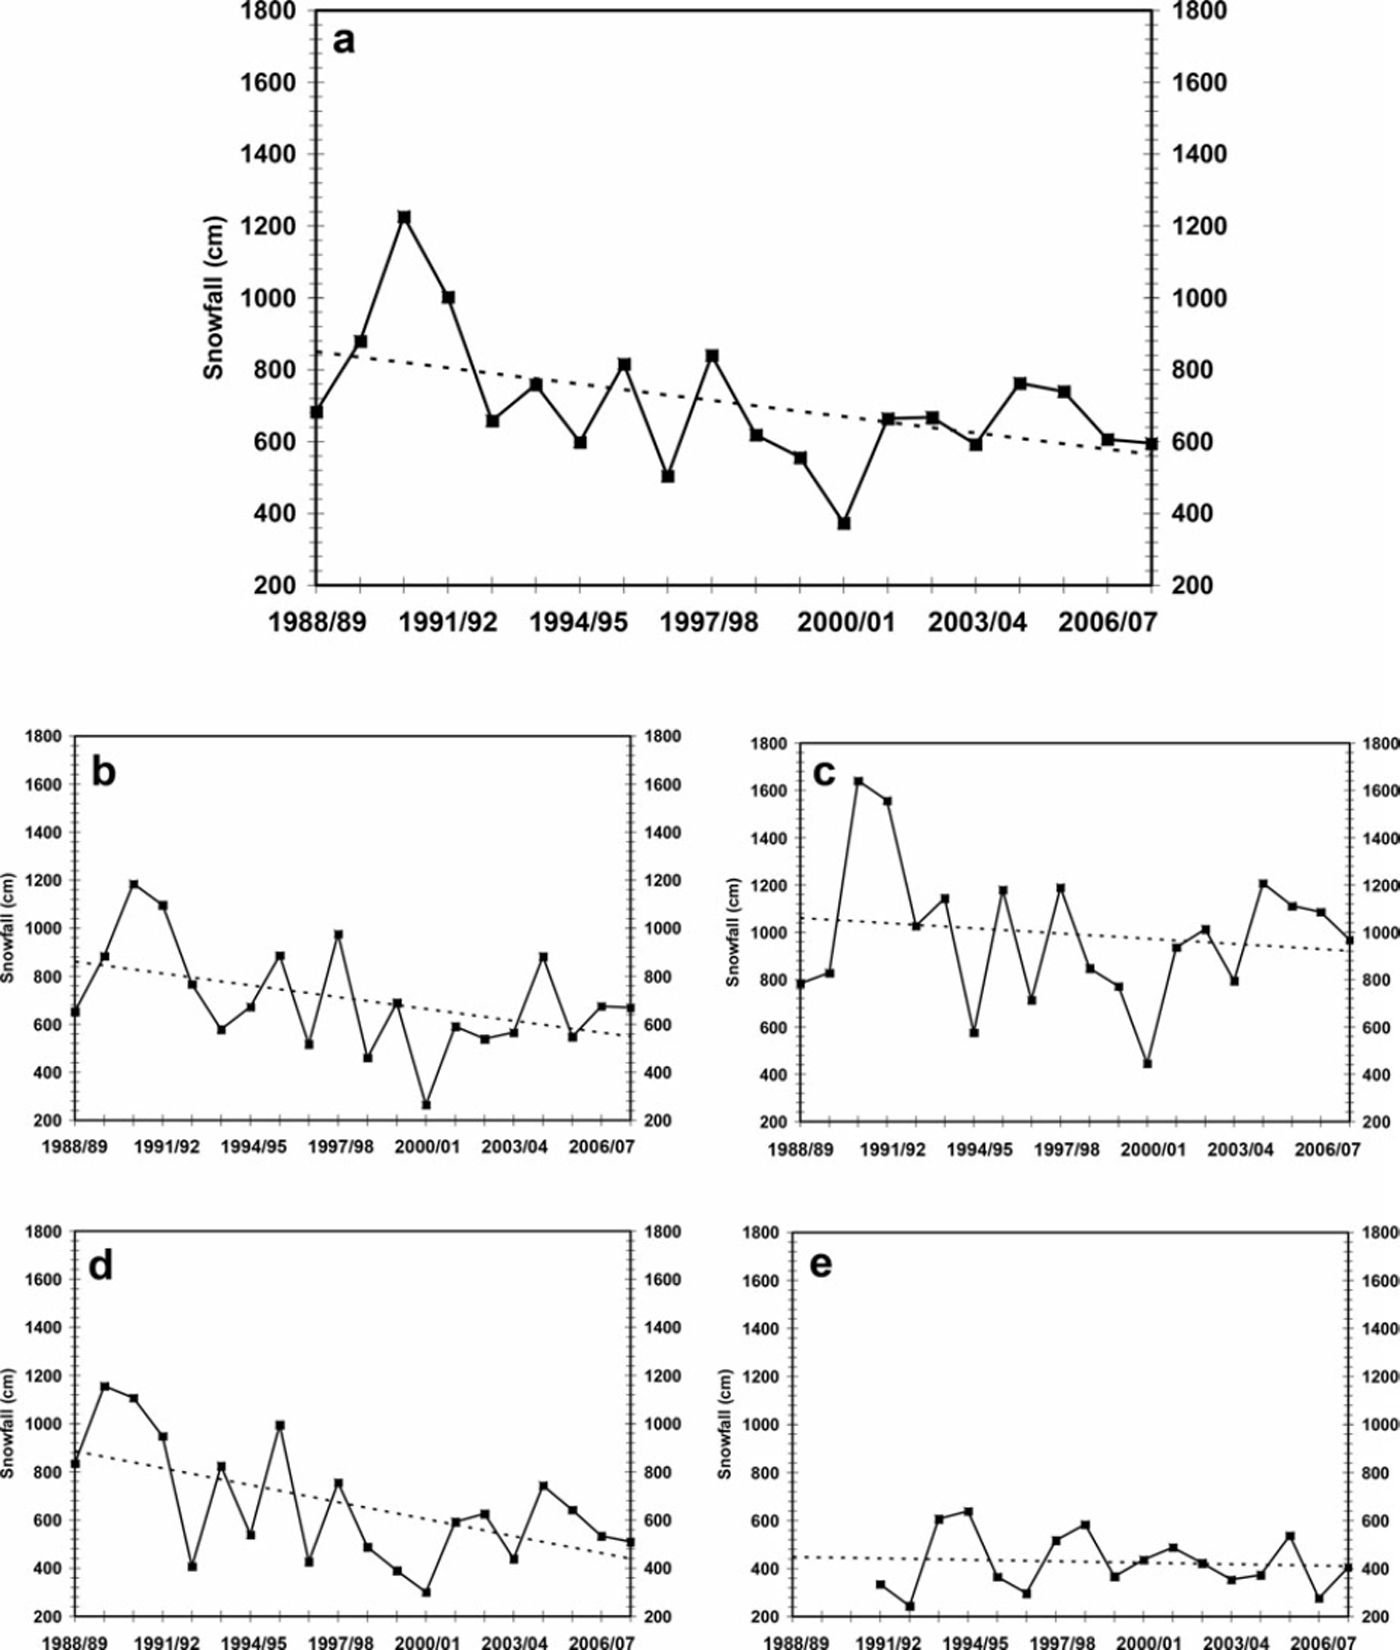
Fig. 4. Time series of seasonal (November–April) snowfall over (a) the western Himalaya as a whole and (b) Pir Panjal, (c) Shamshawari, (d) Greater Himalaya and (e) Karakoram ranges.
Cloud cover
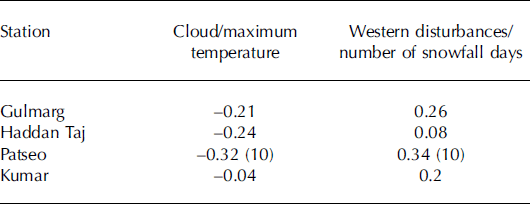
Cloud cover is an important parameter which controls the temperature and amount of precipitation across a region. The cloud cover for 1988/89 to 2007/08 was examined at four stations in the western Himalaya: Gulmarg, Haddan Taj, Patseo and Kumar, representing the Pir Panjal, Shamshawari, Greater Himalaya and Karakoram ranges, respectively. Figure 5a–d indicate a decrease in cloud cover at all stations, except Haddan-Taj where there is no change in the cloud amount. This trend of decreasing cloud cover is responsible for stronger solar heating during daytime and is consistent with the increasing trend of the maximum temperature. Table 2 gives correlation coefficients between the cloud amount and the maximum temperature at the four stations. The correlation coefficient between cloud amount and maximum temperature at Patseo is negative and significant, which means the amount of cloud decreases with the increase in maximum temperature. The correlation coefficients for the other three stations are negative but not significant. The increase/decrease in cloud amount in the western Himalaya needs to be more carefully examined during various months of the winter season utilizing a greater number of stations.
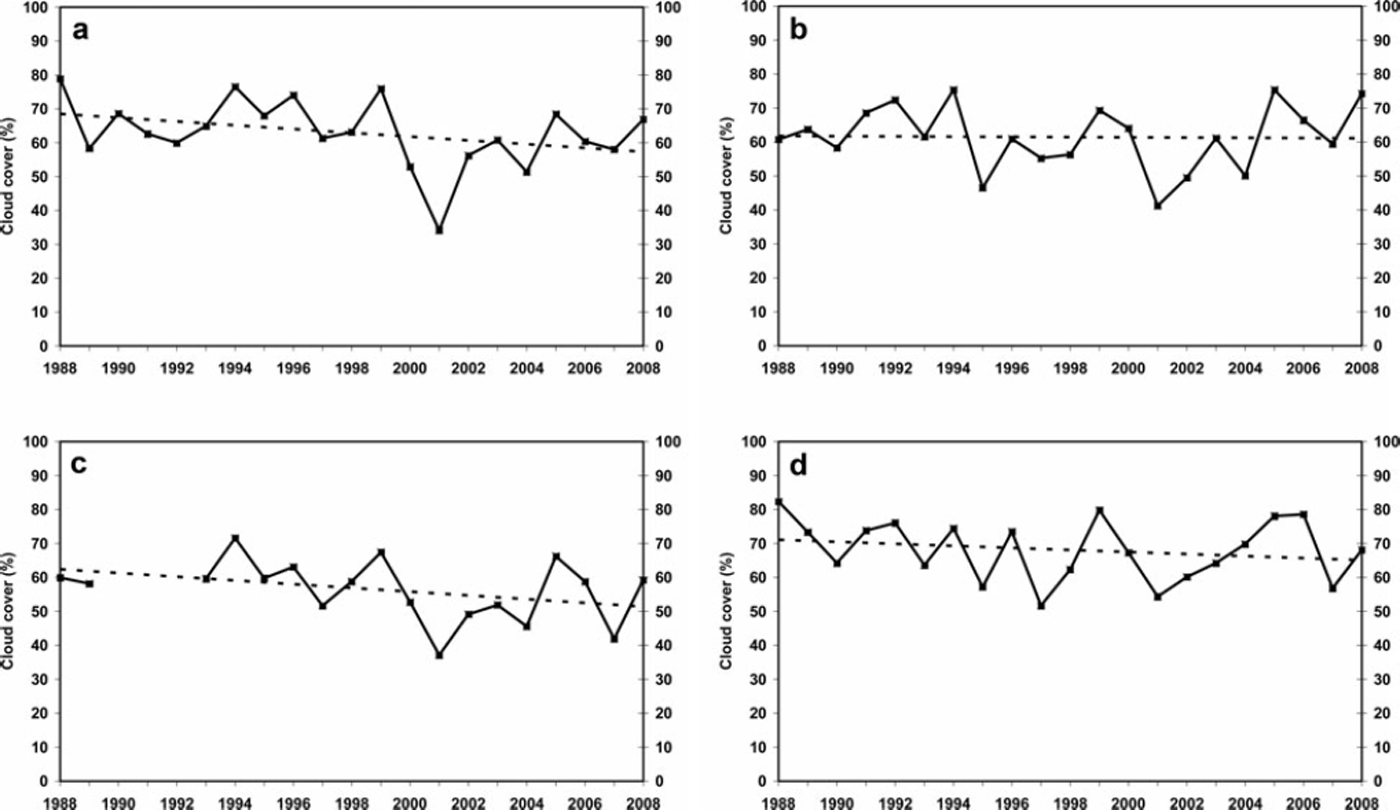
Fig. 5. Cloud cover (%) over (a) Gulmarg, (b) Hadden Taj, (c) Patseo and (d) Kumar.
Table 2. Correlation coefficients between cloud percentage and maximum temperature and between western disturbance frequency and number of snowfall days. Values in parentheses denote percentage of significance level
Western disturbances and number of snowfall days
The western Himalaya are particularly prone to severe weather, due to the movement of western disturbances during the winter months. The synoptic aspects of western disturbances have been discussed by many authors (e.g. Reference Pisharoty and DesaiPisharoty and Desai, 1956; Reference Rao and SrinivasanRao and Srinivasan, 1969; Reference KalsiKalsi, 1980; Reference Azadi, Mohanty, Madan and PadmanabhamurtyAzadi and others, 2002; Reference Hatwar, Lal, Rama Rao, Sud and KalsiHatwar and others, 2001; Reference Das, Mukhopadhyay, Dandekar and KshirsagarDas and others, 2002; Reference DimriDimri, 2008) and are the primary sources of precipitation over the western Himalaya during winter, where the number of snowfall days and the amount of snowfall depend on the number of occurrences and the intensity of the western disturbances. Therefore, it is important to examine the effect of regional climate change on the number of occurrences of western disturbances and the number of snowfall days over these regions. In an observational study, Reference Das, Mukhopadhyay, Dandekar and KshirsagarDas and others (2002) found that western disturbances in the Himalaya activate monsoons in certain areas of northwestern India. They also studied trends in the annual pre-monsoon (March-May) frequency of western disturbances and the onset date of monsoon over north India for the period 1971–2000 and found that frequency of May western disturbances has significantly decreased over recent years.
Figure 6 shows seasonal (November-April) and monthly (January-March) western disturbance frequency anomalies over the western Himalaya, along with the number of snowfall days for 1984/85 to 2007/08. There is no trend (Fig. 6a) in the seasonal frequency of western disturbances, whereas the total seasonal snowfall shows a decrease (Fig. 4). Thus, seasonal (November-April) occurrences of western disturbances do not seem to have a significant effect on the snowfall pattern over the western Himalaya. Figure 6b shows western disturbance frequency during the peak snowfall months, i.e. January-March. Here, also, there is no trend in the frequency of western disturbances, yet a decreasing trend in the number of snowfall days during the same period for the four stations considered. The total number of snowfall days decreased by 5, 7 and 10 days over Haddan-Taj, Patseo and Kumar, respectively, between January and March; Gulmarg, however, does not show any trend in the number of snowfall days. Table 2 shows correlation coefficients between the frequency of western disturbances and the number of snowfall days at the four stations. The correlation coefficient between western disturbance frequency and the number of snowfall days over Patseo is positive and significant: more snowfall days are related to more western disturbances. For the other stations, the correlation coefficients are not significant.
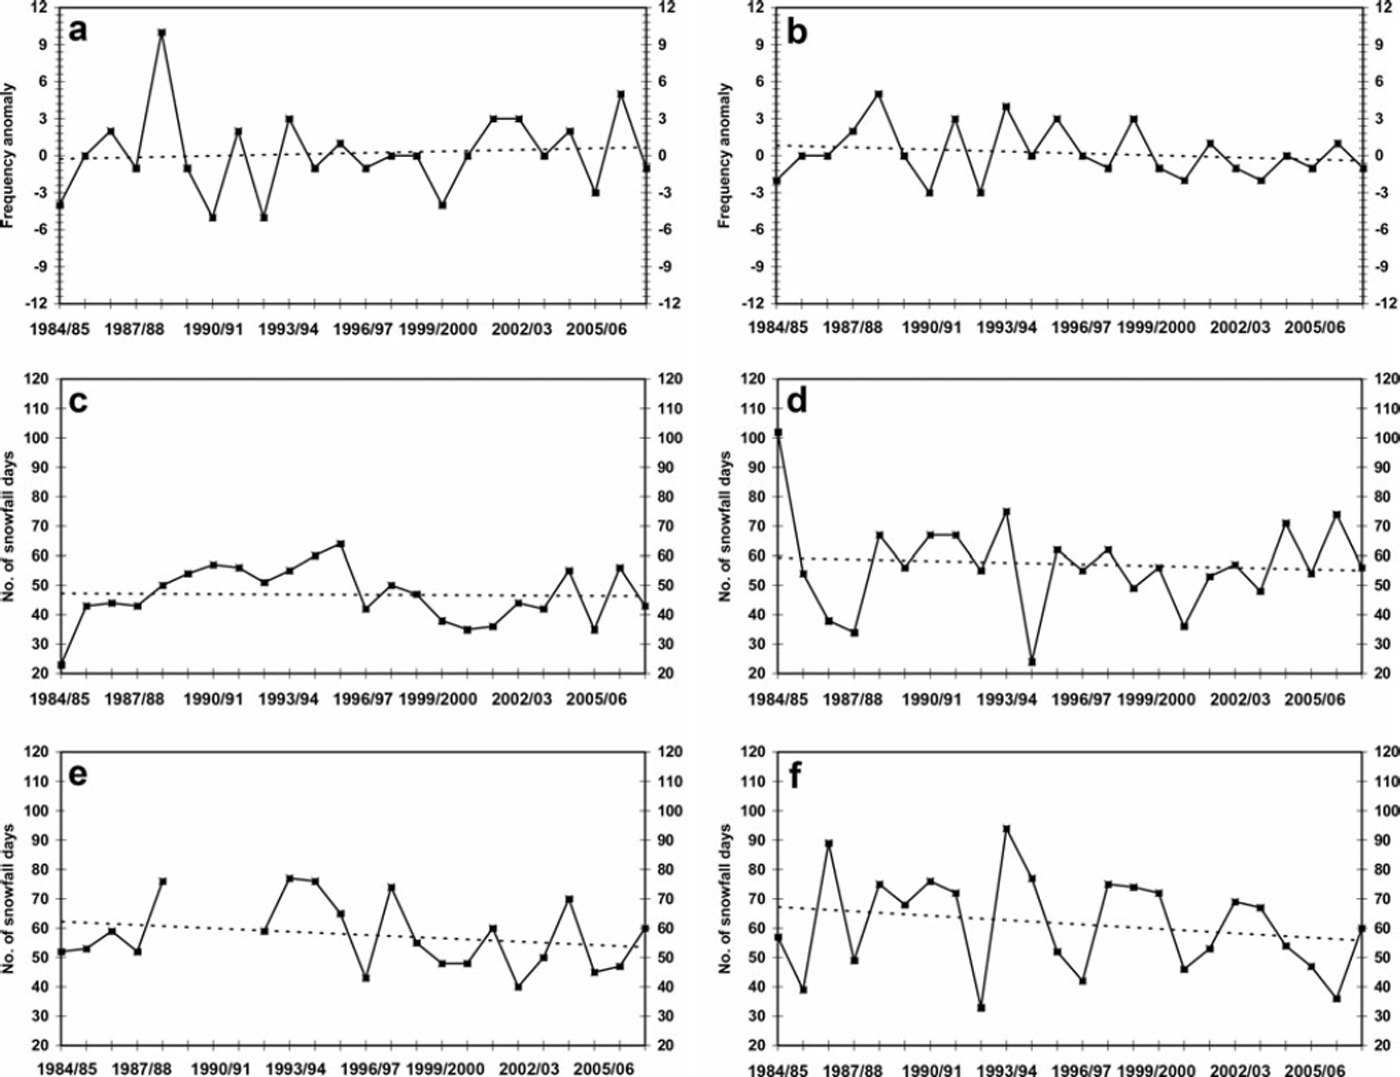
Fig. 6. Frequency of occurrence of western disturbances in the northwestern Himalaya for the period 1984/85 to 2007/08 during (a) winter (November–April) and (b) January–March. (c–f) The number of snowfall days between January and March at Gulmarg (c), Haddan Taj (d), Patseo (e) and Kumar (f).
Conclusions
Global climate change affects the regional climate which, in turn, has a large impact on water resources, agriculture and the economy of the region. For this reason, understanding the factors responsible for climate change over a region has been at the forefront of research in recent years. Data from the western Himalaya show that seasonal mean, maximum and minimum temperatures have increased by ∼2, 2.8 and 1°C, respectively. Seasonal maximum and minimum temperatures show an increasing trend over three mountain ranges of the western Himalaya and a decreasing trend over one range (Karakoram). Seasonal precipitation shows a decreasing trend over all four ranges. Cloud cover also shows a decreasing trend over four stations situated in the four ranges. There is no trend in the annual frequency of western disturbances, yet a decreasing trend in the number of snowfall days during the peak snowfall months (January-March). Correlation coefficients indicate that climate change was clearer at Patseo than at the other three stations. More long-term observations and regional climate modelling studies are required over the western Himalaya in order to establish a robust relationship between global warming and its regional impacts.
Acknowledgement
We thank P.K. Satyawali of SASE for making valuable suggestions for the study.


