1 Introduction
Open Source Hardware (OSH) products are those products whose construction principles are published with a licence allowing anyone to study, modify, make, and sell them (as defined by the Open Source Hardware Association 2016). The emergence of OSH results from the extension of the intellectual property management paradigm at work in Open Source Software (OSS) to physical products. Numerous examples of open source and complex mechatronic products have been reported to cover diverse product categories such as machine tools, vehicles and laboratory equipment (Bonvoisin et al. Reference Bonvoisin, Mies, Stark and Boujut2017a ), indicating a phenomenon of growing momentum.
In the public narrative, transparency and free disclosure of product-related information goes along with participative, democratic, community-based forms of development where any interested person can involve, regardless of their geographical or organizational background. As noted by Raasch & Herstatt (Reference Raasch and Herstatt2011), while ‘the term open source primarily relates to the type of licence under which [products are] made available, it has also been used to describe specific patterns of product development processes’. Such processes are common in software development where they are termed Open Source Software Development (OSSD) (Carillo & Okoli Reference Carillo and Okoli2008). Their main characteristics are an organization of work based on self-selection of tasks and a geographical dispersion of voluntary contributors collaborating online (Xu, Christley & Madey Reference Xu, Christley, Madey, Bitzer and Schröder2006). Early signs of transfer of such product development patterns from software to hardware have been a source of enthusiasm for both scientific and practitioner communities (Grames, Redlich & Wulfsberg Reference Grames, Redlich and Wulfsberg2011).
However, beyond the rather qualitative description of some iconic examples available in popular and scientific literature (e.g., Malinen et al. Reference Malinen, Mikkonen, Tienvieri and Vadén2010; Mellis & Buechley Reference Mellis and Buechley2012), little is known regarding how actually transparent and participative the development of OSH products is. Previous research of the authors highlighted the difficult settlement of participative development practices in OSH – few development projects being successful in creating the necessary momentum for maintaining stable community-based product development processes (Bonvoisin et al. Reference Bonvoisin, Thomas, Mies, Gros, Stark, Samuel, Jochem and Boujut2017b ). It remains unclear to what extent participative product development patterns observed in OSS are actually reproduced in the context of physical products. Some authors highlighted higher barriers to open source development in hardware than in software, especially due to prototyping costs (e.g., Müller-Seitz & Reger Reference Müller-Seitz and Reger2010; Raasch & Herstatt Reference Raasch and Herstatt2011). While we can witness large numbers of OSH products, it is still difficult to say whether the community-based development of these products is a romantic projection or an observable phenomenon.
To address this question, this paper takes advantage of Decentral Version Control Systems (DVCS) repositories typically used in publish OSH product-related data. These repositories can be compared to publicly available versions of Product Data Management (PDM) systems. Like PDM systems, they record the entire version history of all submitted design files. The unrestricted availability of this data enables using data mining techniques to uncover trends and patterns in the evolution of product information. This approach has been widely adopted in OSS and has led to a new field of scholarly research often referred to as repository mining (see, for example, Kim, Robbes & Bird Reference Kim, Robbes and Bird2016). This paper applies repository mining techniques to analyse the technical documentation of OSH products and identify how transparent and participative their development is.
To achieve this, Section 2 provides an overview of current knowledge on community-based product development in OSH and introduces the research questions addressed in this article. Section 3 introduces repository mining as a way to address these questions, leading to Section 4 presenting the methodological approach adopted to track community-based development activities in OSH. Section 5.1 presents the corresponding results, which Section 6.1 ultimately discusses.
2 Community-based product development in OSH
A rich landscape of new product development forms emerged in recent times gathering under the umbrella of ‘open innovation.’ Far away from depicting a clearly identified and precise phenomenon, this term covers a wide and complex landscape of heterogeneous realities. Scientific and popular literature has referred to subfields of this moving landscape with competing terms, occasionally leading to confusions (Ehls Reference Ehls, Herstatt and Ehls2015; Murillo Reference Murillo2017). As part of an effort to avoid this pitfall, the following paragraph strives to provide a clear delineation of community-based product development practices associated with OSH within the field of open innovation. First, it distinguishes sequential and collective forms of community-based product development and introduces the term of Open Source Product Development (OSPD) as the precise focus of this article. Second, it describes the specific characteristics of OSPD distinguishing it from other forms of open innovation. Third, it reviews the empirical evidences of OSPD provided through scientific literature and introduces the research question addressed in this article.
2.1 Sequential versus collective community-based product development
Two kinds of community-based product development processes in OSH can be distinguished.Footnote
1
The first is peer-to-peer development where products are designed and produced by individuals working sequentially. This type of development has been empirically observed by Özkil (Reference Özkil2017) and Kyriakou, Nickerson & Sabnis (Reference Kyriakou, Nickerson and Sabnis2017) on the CAD model sharing platform Thingiverse.Footnote
2
These processes occur in the form of sequential series of remakes: one maker develops a version, which is taken over and developed further by someone else, and so on. While these processes are collaborative in the sense that designs are generated by the action of more than one person, these are not collaborative in the sense of coordinated action of people with common objectives. ‘Designers get inspired by each other’ (Özkil Reference Özkil2017) and ‘build on top of each other’s work’ in an evolutionary process where each representative of the species is a design created by one designer. This form of community-based design is often associated with low complexity designs, such as DIY and 3D-printed products – ‘personal accessories
![]() $[\ldots ]$
which are [for a large part] ornamental and have limited functionality or complexity’ (ibid.). Nonetheless, similar processes may also be involved in the development of variants of more complex products, as observed in the case of the electronic board Arduino Duemilanove (Mellis & Buechley Reference Mellis and Buechley2012).
$[\ldots ]$
which are [for a large part] ornamental and have limited functionality or complexity’ (ibid.). Nonetheless, similar processes may also be involved in the development of variants of more complex products, as observed in the case of the electronic board Arduino Duemilanove (Mellis & Buechley Reference Mellis and Buechley2012).
The second is referred to as collective design and is where product development is performed by coordinated action of individuals working in parallel (Paulini, Murty & Maher Reference Paulini, Murty and Maher2013). This product development form applies to complexFootnote 3 products, where there is a combination of technologies, greater number of parts and requirements. Collective design can be considered similar to conventional team-based product development processes, but where ‘all, no matter their background’, are invited to join the team (ibid.). While conventional industrial product development happens in clearly identified projects with predefined inputs, outputs and timeline, these features hardly apply to collective design. Instead, product development is expected to resemble an ongoing process of continuous product improvement supported by a community of interested people (Geyer et al. Reference Geyer, Reise, Manav, Schwenke, Böhm and Seliger2012). In line with Balka (Reference Balka2011), we term this form of community-based product development Open Source Product Development (OSPD) and define it as
the development of complex open source hardware products performed in a collective process allowing the participation of any interested person.
As a contribution to engineering design, this article focuses on the development of complex OSH products within collective processes, hence on OSPD. In the rest of this article, as a mean of language simplification, the term open source hardware refers to complex open source hardware.
2.2 OSPD in the field of open innovation
The field of open innovation is characterized by two factors of openness depicted in Figure 1: process openness (whether the innovation process is open or closed) and product openness (whether the innovation outcome is open or closed). Both factors are implemented in the concept of Open Source Innovation, which is defined by Raasch, Herstatt & Balka (Reference Raasch, Herstatt and Balka2009) as the ‘free revealing of information on a new design with the intention of collaborative development of a single design or a limited number of related designs for market or nonmarket exploitation’. This concept overlaps with those of Open Collaboration defined by Forte & Lampe (Reference Forte and Lampe2013) as ‘an online environment that (a) supports the collective production of an artefact (b) through a technologically mediated collaboration platform (c) that presents a low barrier to entry and exit and (d) supports the emergence of persistent but malleable social structures.’ OSPD is a specific implementation of this concept in the context of physical products. It implements both product openness (the fact that the product is open source in the sense of the OSH definition cited in the first sentence of this article) and process openness (the possibility for any interested person to take part in the collaborative development process). Process openness in turn requires maintaining a transparent product development process in order to allow newcomers to jump in. The transparency of a product development project is therefore an indicator of the intention to gather voluntary participants, where the number of involved people may be an indicator of success in pursuing this intention.

Figure 1. The place of OSPD in the field of open innovation (adapted from Huizingh Reference Huizingh2011 and Aitamurto, Holland & Hussain Reference Aitamurto, Holland and Hussain2015).
OSPD has been coined by other authors under the term ‘open design’ (Raasch et al. Reference Raasch, Herstatt and Balka2009; Howard et al. Reference Howard, Achiche, Özkil and McAloone2012; Aitamurto et al. Reference Aitamurto, Holland and Hussain2015; Brulé & Valentin Reference Brulé and Valentin2016; Ostuzzi et al. Reference Ostuzzi, Conradie and De Couvreur2016), whose definitions in the literature are however not fully consistent with each other and partly refer to other forms of open innovation. Other authors used the terms ‘open source development’ or ‘open source design’ in a meaning which is close to the definition given to OSPD in this paper (Buitenhuis & Pearce Reference Buitenhuis and Pearce2012; Fjeldsted et al. Reference Fjeldsted, Adalsteinsdottir, Howard and McAloone2012; Zhang & Li Reference Zhang and Li2017). OSPD differs clearly from crowdsourcing (also referred to as ‘social product development’ in Peterson & Schaefer Reference Peterson and Schaefer2014 and in Wu et al. Reference Wu, Rosen, Panchal and Schaefer2015), in the context of which the outcome of the collaborative product development process is protected and the process is per definition centralized around a formal organization (company or institution) Crowdsourcing implements a certain form of limited process openness but not product openness. OSPD also differs from what Huizingh (Reference Huizingh2011) calls public innovation and Boisseau et al. (Reference Boisseau, Omhover and et Bouchard2018) call downloadable design and which is characterized by the free revealing of product-related information at the end of a closed product development process. Public innovation produces OSH and therefore implements product openness but not process openness.
2.3 Reported empirical evidence of OSPD
The very concept of open source is generally understood as a product development model (Gacek & Arief Reference Gacek and Arief2004; Raasch & Herstatt Reference Raasch and Herstatt2011; Moritz, Redlich & Wulfsberg Reference Moritz, Redlich and Wulfsberg2018). Nonetheless, only few OSH development projects have been reported to be successful in gathering an active community of contributors. In contrast with the large number of academic articles referring to community-based product development practices, few empirical evidences of such practices have been delivered throughout the scientific literature. Müller-Seitz & Reger (Reference Müller-Seitz and Reger2010) reported the case of the Oscar (open source car) project dedicated to the development of a car ‘via the Open Source concept – free and community oriented’ (Figure 2, center). This project showed similarities with OSSD, since tasks were performed by an informal community of voluntary contributors operating a self-selection of tasks. Macul & Rozenfeld (Reference Macul and Rozenfeld2015) as well as Moritz et al. (Reference Moritz, Redlich, Grames and Wulfsberg2016) reported the case of Open Source Ecology, a grassroots project aiming at developing and building a ‘Global Village Construction Set’, i.e., a set of 50 open source industrial machines allowing to ‘build a small civilization with modern comforts’ (Figure 2, left).Footnote 4 More recently, Boisseau (Reference Boisseau2017) reported the case of the POC21 innovation camp, a gathering which took place in Paris in 2015 and produced 12 OSH development projects (Figure 2, right). While these authors reported cases of community-based product development, critical aspects such as the number of participants and the intensity their interactions has been left imprecise by the qualitative nature of their studies. Balka, Raasch & Herstatt (Reference Balka, Raasch and et Herstatt2009) performed a statistical analysis of 85 OSH projects including indicators such as the number of developers. However this study based on public and therefore probably biased ‘declarations of the project administrators rather than on objective measures.’ Moreover, it neither defined the role of a ‘developer’ nor addressed the question of their interactions along the development process.
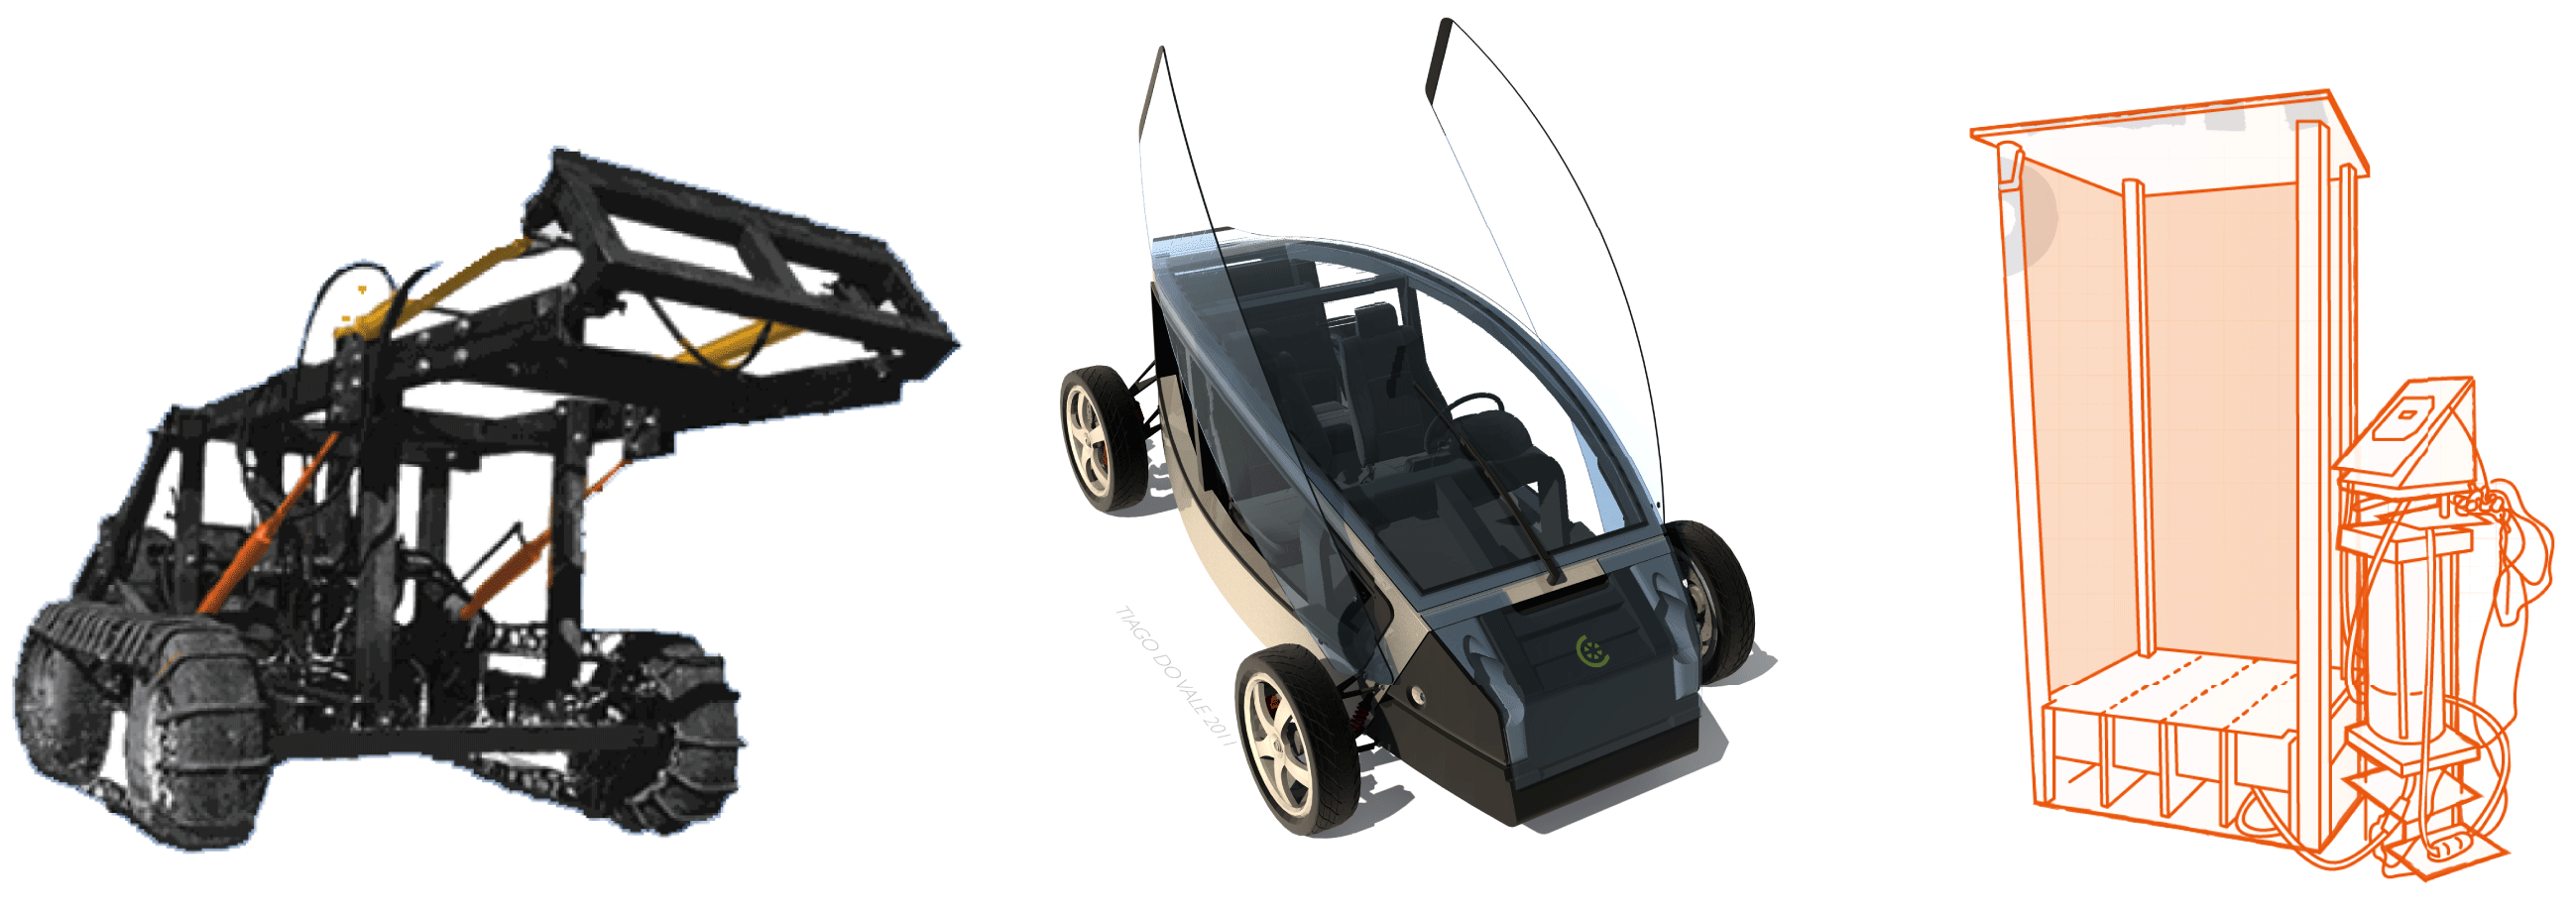
Figure 2. Three examples of OSH products already reported in scientific literature. From left to right: Prototype of the Open Source Ecology Life Trac (authors: Matthew Maier et al., 2013, CC-BY-SA 3.0 unported), concept drawing from The Oscar Project (author: Tiago de Vale, 2006, public domain), concept drawing from POC21’s Showerloop (public domain).
In contrast to this, quantitative data published by the authors tends to contradict the idealistic perception of open source as automatically community-based – the large majority of OSH products seeming to remain the result of public innovation processes. From the analysis of more than a hundred OSH products, Bonvoisin et al. (Reference Bonvoisin, Mies, Stark and Boujut2017a ) revealed that only a third of products provided enough publicly accessible supporting documentation to enable community-based product development. Based on this analysis, they formalized the OSH lifecycle as displayed in Figure 3, where OSPD and public innovation constitute two archetypal approaches to OSH development. Public innovation reveals OSH at the end of a development process performed in a private setting. OSPD is on the contrary a community-based setting aiming at releasing already public documents in a stable version. In both cases, the resulting OSH product can be the start of a new iteration of the lifecycle, that is, be redesigned either in a private or in a community-based setting.
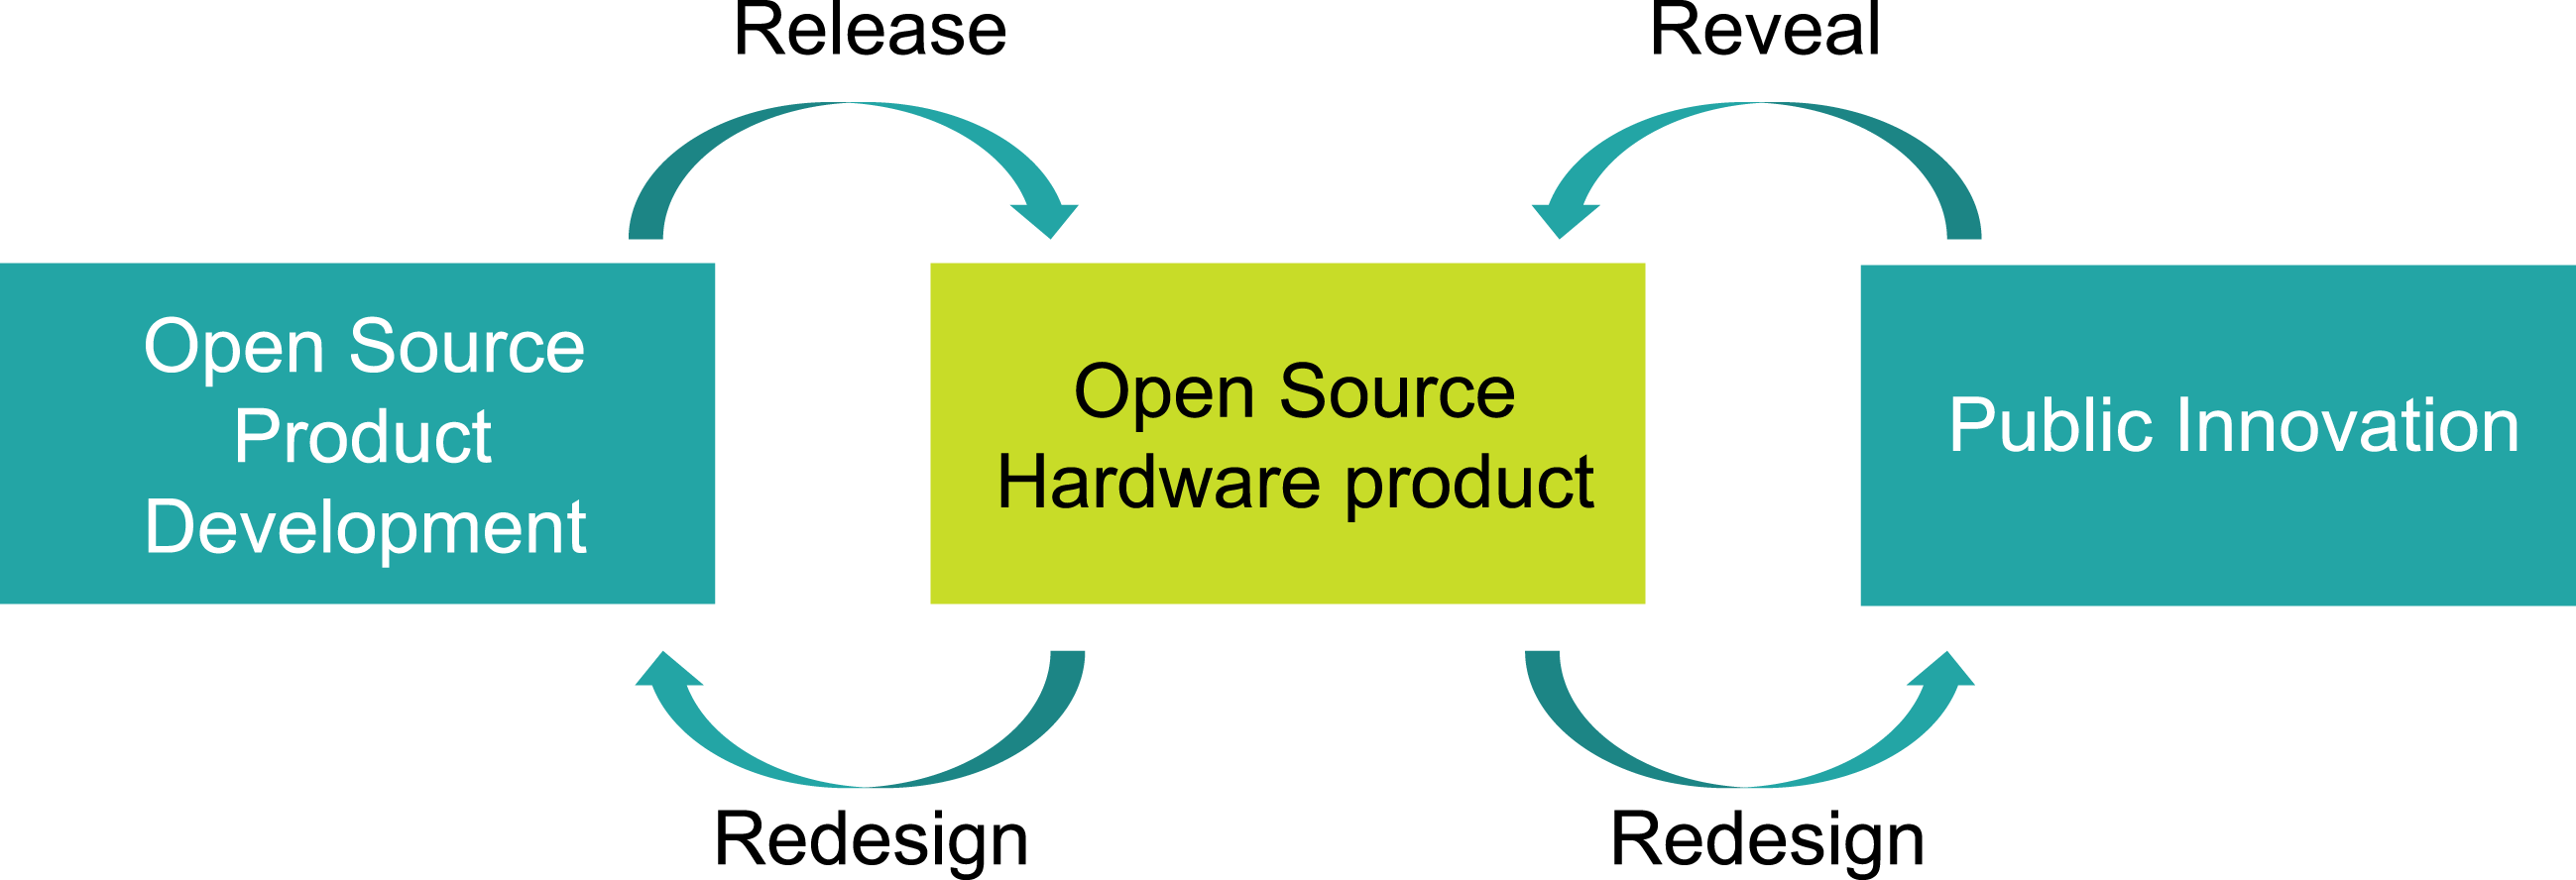
Figure 3. The OSH lifecycle (reproduced from Mies, Bonvoisin & Jochem Reference Mies, Bonvoisin, Jochem, Redlich, Moritz and Wulfsberg2019).
2.4 Research questions
Against this background, the research reported in this paper questions the possibility to bring quantitative evidence of community-based development of complex OSH products. It investigates with quantitative means the relative prevalence of OSPD and public innovation in the development of complex OSH products. In other words, it raises the following question:
Which share of OSH products is the object of an OSPD process?
A first prerequisite for a project to qualify as OSPD is to maintain transparency along the product development process. Consequently, the question raised above can be rephrased as follows:
RQ1 – To what extent is the product development history of OSH products transparent? That is, is there a significant volume of observable development activity around an OSH product?
A second prerequisite for a project to qualify as OSPD is to distribute the development workload among different interacting contributors. This leads to the second complementary research question:
RQ2 – How does the observable development activity distributes among different contributors? That is, how many people are involved in the development of an OSH product and how is their relative activity related?
3 Quantify features of product development with repository mining
A key feature of OSH is the publicly accessible data repositories used to store and share product documentation. While each OSH development project is obviously free to use a publication technique of their own, a large share of projects tend to use a limited number of repository hosting services such as GitHub, Phabricator, GitLab, and BitBucket.Footnote 5 These services build upon the distributed code versioning system Git,Footnote 6 originally developed to support the development of the Linux Kernel.
Each repository is a publicly accessible virtual disk space with conventional folder and files architecture. A repository belongs to a user or a group of users who can clone it, that is, get a copy of all files on their local disk. Locally made edits can be committed, meaning they are recorded by the version control system. Committed edits can be pushed by their issuer to the publicly available repository. Alternatively, users have the possibility to pull committed edits from another user in their copy of the repository. A repository can further be forked by other users who are not granted with owning rights on the original repository. These users get then a copy of the repository they are the owners of and can fully edit. Fork owners can ask the owners of the forked repository to integrate committed edits through a so-called pull request. The owners of the forked repository have full liberty either to accept the request, decline it, or ask for improvements. Through this mechanism, project initiators can integrate contributions from external people without jeopardizing full control on their data. External contributors have the possibility to participate to a project they are not the owners of, align with the organization of work chosen by the originators, and eventually be granted with owning rights at a certain point of time. Alternatively, they can branch out and develop a project in a different direction than wanted from the originators.
Repository hosting services not only allow flexible collaboration patterns but also retracing the whole file edition history of a given project. The version control system Git records who made what, when, and based on which status of the current data. This metadata is publicly available and can be queried through an Application Programming Interfaces (API). Repository hosting services are therefore a valuable source of information to investigate specific features of product development projects, including transparency and distribution. They enable the application of Social Network Analysis (SNA) techniques in order to identify specific collaboration patterns in interaction networks.
3.1 Repository mining in software
The availability of versioned data has been turned into profit since a long time in the software branch, where the open source development model has settled since some decades (Cosentino, Luis & Cabot Reference Cosentino, Luis and Cabot2016; Kalliamvakou et al. Reference Kalliamvakou, Gousios, Blincoe, Singer, German and Damian2016; Kim et al. Reference Kim, Robbes and Bird2016; Cosentino, Izquierdo & Cabot Reference Cosentino, Izquierdo and Cabot2017). Repository mining techniques and SNA have been combined to study various aspects such as the respective influence between community structure and product structure (Le & Panchal Reference Le and Panchal2012), the role of prior social links on online collaborative development (Casalnuovo et al. Reference Casalnuovo, Vasilescu, Devanbu and Filkov2015), the evolution path of contributors from periphery to core (Asri et al. Reference Asri, Kerzazi, Benhiba and Janati2017) or the gender and nationality diversity of team members (Ortu et al. Reference Ortu, Destefanis, Counsell, Swift, Marchesi and Tonelli2016).
Some work delivered interesting insights into the structure of OSSD. Applying SNA to all projects of Sourceforge.org, Xu et al. (Reference Xu, Christley, Madey, Bitzer and Schröder2006) showed how individual contributors tie together many of the OSS projects into one large and interconnected community resembling a ‘small-world network’. Small-world networks are graphs in which most nodes are not neighbours one another but where most nodes can be reached through a small number of connections. In other words, these are networks where members maintain an average low number of connections but benefit from indirect access to all other members. They describe rather decentral, efficient and robust organizations, containing a few highly connected nodes playing the role of hubs. The similarity of OSSD contributors networks with small-world networks has been confirmed in other works (e.g., Lopez-Fernandez, Robles & Gonzalez-Barahona Reference Lopez-Fernandez, Robles and Gonzalez-Barahona2004). Beside this, Xu et al. (Reference Xu, Christley, Madey, Bitzer and Schröder2006) pointed out another interesting characteristic of OSSD projects, namely their ability to scale up. While the majority of OSSD projects fail in attracting a lively community of contributors, some of them succeed in gathering thousands of participants – a much larger base than any closed software development projects could reach.
3.2 Repository mining in engineering design
The opportunities to tap into the ‘continuously growing body of open data sources’ have also been recognized in engineering design science (Parraguez & Maier Reference Parraguez and Maier2017). Few works have implemented the idea of repository mining in the field of mechanical engineering and design science, however while mining proprietary data sources. Gopsill et al. (Reference Gopsill, Snider, McMahon and Hicks2016) used the versioning history of two student formula 1 development projects in order to identify design dependencies between subsystems. Using the temporal evolution of product CAD model editions, they were able to automatically deduct the design structure matrices (DSM) of these products, a critical information when it comes to managing product development processes. Piccolo, Lehmann & Maier (Reference Piccolo, Lehmann and Maier2017) analysed the document version history of a power plant development project in order to reconstruct the underlying design process. By analysing the network of interactions between departments through their sequential edition of the same documents, they were able to identify phase transitions as well as bottlenecks in the development process. Menichinelli (Reference Menichinelli2017) proposed a similar approach to measure interactions in development projects using repository hosting services, without however applying it to hardware projects. Ball & Lewis (Reference Ball and Lewis2018) investigated the role of individual contributions in the success of design processes based on the computation of six topological metrics (closeness, betweenness, eigenvector, degree, diameter and density) on a fictive and randomly generated network of collaborators. Parraguez, Eppinger & Maier (Reference Parraguez, Eppinger and Maier2015) investigated the evolution of a plant development project over time by applying centrality and clustering metrics to the network of interactions gained from email communication and activity logs. Finally, Wu et al. (Reference Wu, Rosen, Panchal and Schaefer2015) proposed to apply topological metrics to weighed networks, where the weight of each edge reflects the tie strength between participants calculated on the basis of different types of interactions such as sharing a file or attending to a common meeting. These works provide interesting metrics to investigate the interactions of product development teams gained from records of their communication. These metrics have not been applied so far to interaction networks gained from records of commonly produced artefacts such as product documentation and CAD models.
In summary, combinations of repository mining and SNA techniques have been applied to investigate OSSD projects on the one side and closed source hardware development projects on the other side. Their ability to investigate publicly available data provided by OSH originators remains unexploited so far. Yet, these techniques pave a comfortable avenue to an original method to track community-based development activities in OSH and therewith to distinguish between OSPD and public innovation projects.
4 Method
Against the background portrayed in the previous sections, the research reported here seeks to characterize the transparency and distribution of work in the development of OSH through repository mining techniques. It particularly focusses on the repository hosting service GitHub, which has been used in numerous software research works (see, for example, Kalliamvakou et al. Reference Kalliamvakou, Gousios, Blincoe, Singer, German and Damian2016 for an overview) and is to the best knowledge of the authors today’s most used solution in OSH.
Development activity in OSH is investigated in a methodological setting implying four steps detailed in the following subsections:
(1) Collection of a large number of OSH products;Footnote 7
(2) Selection of those products whose documentation is hosted in GitHub repositories;
(3) Extraction of the versioning history of the identified repositories;
(4) Establishment of metrics for the volume and distribution of development activity.
4.1 Selecting OSH projects
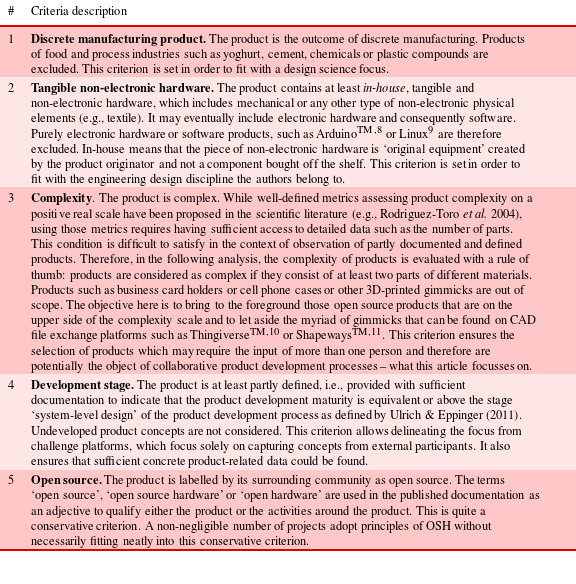
The first step is dedicated to the identification and collection of OSH projects. This has been done using conventional internet search engines and forward citation search. Results have been filtered using the criteria outlined in Table 1. The filtering ensures a conservative evaluation of the studied phenomenon. It keeps a clear focus on OSH products fitting with the competence domain of engineering design, observed with a design science perspective on collaborative product development.
Table 1. OSH project selection criteria
4.2 Repository retrieval
With the OSH projects of interest defined, the associated GitHub repositories can be retrieved. In order to keep the conservative focus of this paper on hardware development, a further criterion is placed on the repository containing 2D/3D CAD or schematics. Repositories containing exclusively software files have been excluded, although they are also part of the product development effort. Those of the products not using GitHub or using it only for software development purposes have not been further considered. This screening process has been performed manually by the authors.
In most cases, more than one repository is used for each product. Additional repositories may be used to modularize the product development activity (e.g., separate electronic and mechanical hardware), manage product variance and versions (e.g., one repository per major product release), and host the development of additional modules (e.g., accessories, interfaces) or parallel R&D validation activities (e.g., development of test benches). This aspect has been acknowledged in the data collection effort, meaning that all repositories affiliated with a given project and complying with the selection criteria stated above have been considered.
As a result of the above, this step produced a list of selected products being related to at least one GitHub repository.
4.3 Data extraction
This step is dedicated to the extraction of the versioning information of each of the repositories identified in the previous step. The raw data extraction is performed using GitHub’s APIFootnote 12 queried using self-developed pythonFootnote 13 scripts. The scripts extract all metadata related to the file versioning history of all repositories and all their forks. The versioning history provides information about who made a commit, which files have been affected by this commit, when it has been recorded and which other commit it follows. As part of the supplementary material to this article, Python scripts have been made available in an online repository and released under an OSS licence (see the reference: Bonvoisin Reference Bonvoisin2018).
In the fictional example displayed in Figure 4, four commits (A, B, C and D) affecting three files (1, 2, and 3) have been performed by three users (Alice, Bob, and Eve). From this data it can be interpreted that, while the course of the development activity first ran sequentially, two diverging development branches have been opened by Alice and Eve after a commit B has been performed by Bob.
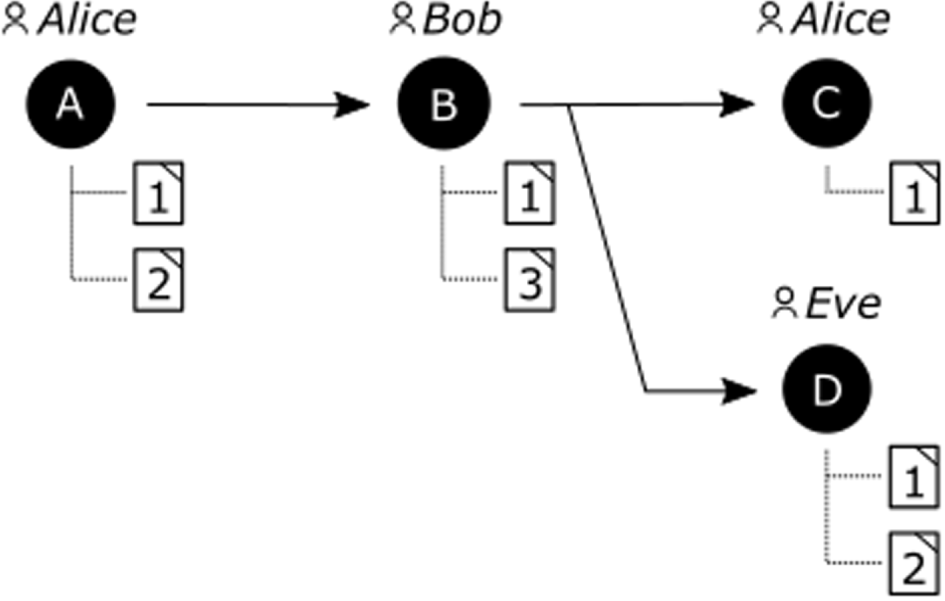
Figure 4. Illustration of the information provided by the GitHub API.
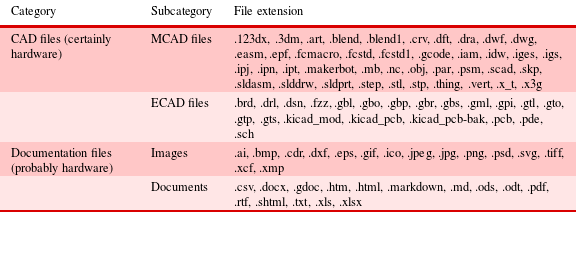
Note that the collected repositories do not only contain information about hardware components but also may contain other elements such as documentation and software code. While these are part of the development effort of mechatronic products, software and hardware development effort need to be considered separately. Indeed, considering them altogether would not allow identifying false positives of OSPD – that is: projects whose software is developed in a distributed fashion but whose hardware is not. Therefore, an additional filtration step is performed to separate the hardware-related data. This filtration is based on file extensions and their relation to hardware design. Table 2 displays the file extensions that have been considered to be respectively certainly and probably related with hardware design. Filtering the files according to these extensions provides three different data series:
(i) CAD files. Files, which are obviously related to hardware, design (MCAD and ECAD files). These files may be related to the later phases of the product development process. Indeed, chances to produce CAD files in the early product development phases such as conceptual design are lower than in later phases such as embodiment or detail design (as referred to in Pahl et al. Reference Pahl, Beitz, Feldhusen and Grote2007).
(ii) Documentation files. Files that may be related to hardware design with a low certainty. For example, images may contain schematics and documents may contain descriptions of the hardware. These files may be related to the early phases of the product development process such as conceptual design. Indeed, in early development, the product concept may not be mature enough to allow the production of CAD files but may be expressed through two-dimensional hand- or software-drawn sketches.
(iii) Other files. All files being handled in the repository and not belonging to the above defined categories.
Table 2. Categories of file extensions considered for the filtering of hardware-related files
4.4 Generating metrics of OSPD
Two series of metrics are extracted which respectively address the volume of observable design activity (RQ1) and its distribution (RQ2).
4.4.1 Volume of observable design activity
The reference unit of observable design activity generally considered in repository mining is the commit. However, this metric tends to estimate design effort only roughly, since one commit may record edits ranging from a few typesetting corrections to large pieces of work (Hattori & Lanza Reference Hattori and Lanza2008). An approximate measure of the commit volume is given by the number of files it affects. Therefore, the reference unit of observable activity considered in this research is the file change, that is, any occurrence of a change brought to a file and recorded by a commit. In order to reflect this in the extracted data, the versioning metadata delivered by the GitHub API is post-processed in order to produce a graph of file changes. This reproduces the versioning history of each file stored in one of the repositories affiliated to a given product. Figure 5 reproduces the file changes graph corresponding to Alice, Bob and Eve’s project. In this project, the file 1 has been edited four times and is available in two different versions from two different branches. The file 2 has been modified one time and the file 3 has never been modified once created.
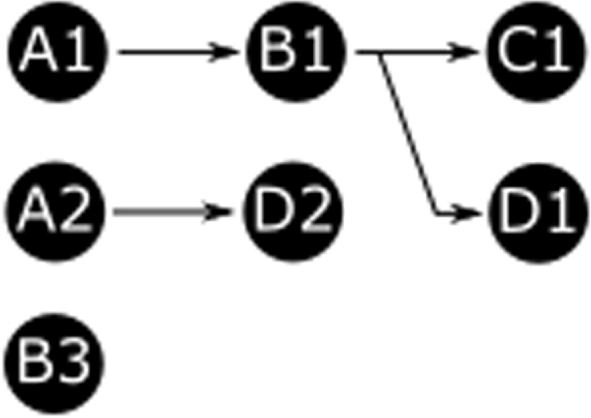
Figure 5. File changes graph extracted from to the metadata presented in Figure 4.

Figure 6. File co-edition network extracted from to the metadata presented in Figure 4.
By adding the number of file changes committed by unit of time, it is possible to get insights on the volume of activity as well as its evolution over time.
4.4.2 Distribution of design activity
The distribution of the design activity is related to those of their interactions with commonly produced artefacts. An interaction between two project contributors is defined as the edition of a common file in the course of the project. The subsequent edition of the same file by two contributors is therefore considered in this article as the reference unit of observable collaboration, as in Gopsill et al. (Reference Gopsill, Snider, McMahon and Hicks2016), Piccolo et al. (Reference Piccolo, Lehmann and Maier2017) and partially in Menichinelli (Reference Menichinelli2017). The versioning metadata delivered by the GitHub API is post-processed in order to produce file co-edition networks (as defined in Asri et al. Reference Asri, Kerzazi, Benhiba and Janati2017). Figure 6 reproduces this network in the case of Alice, Bob and Eve’s project. In the course of the project, Alice and Bob worked at least on a common file, so did Bob and Eve. Alice and Eve show no evidence of direct collaboration.
Beyond giving an overview of the number of contributors to a project, this network allows drawing conclusions about intra-project collaboration patterns. Two topological indicators are computed to highlight these patterns:
(i) The centrality index indicates the variation in the relative importance of all nodes in a graph. In our case, this corresponds to the degree to which interactions are centralized towards a few people or are distributed evenly through all contributors. We use here the degree centrality, where the importance of a node equals to its degree, that is, the number of edges it is connected to. The centrality index $D$
of a graph $G$
is computed using equation (1) (taken from Ball & Lewis Reference Ball and Lewis2018, p. 11), where:
$G$
is computed using equation (1) (taken from Ball & Lewis Reference Ball and Lewis2018, p. 11), where:(a) deg(n) is the degree of the node $n$
and corresponds to its number of incident edges;
$n$
and corresponds to its number of incident edges;(b) $n^{\ast }$
is the node with the maximum degree in the network;
$n^{\ast }$
is the node with the maximum degree in the network;(c) $N$
is the number of nodes in the network.
(ii) The clustering index indicates the degree to which nodes tend to cluster together. In our case, this corresponds to the degree to which contributors tend to cluster in subgroups of three or more people directly working on the same files. It tells us ‘how many of a member’s collaborators are collaborators with each other’ (Xu et al. Reference Xu, Christley, Madey, Bitzer and Schröder2006). The local clustering coefficient $C$
of a node $n$
is computed using equation (2) (taken from NetworkX Developers 2015; and Watts & Strogatz Reference Watts and Strogatz1998), where $T(u)$
is the number of triangles through the node $n$
. The clustering index of a graph is the average value of the local clustering coefficients of all nodes in the graph.
Figure 7 displays four different examples of graphs whose topology is assessed according to the above-mentioned indicators:
(i) Graph $i$
has no edges. Consequently, centrality and clustering indexes are zero. This means all contributors work strictly in parallel, working with their own sets of files. This does not mean there is no collaboration in the sense of coordinated parallel effort, though.
$i$
has no edges. Consequently, centrality and clustering indexes are zero. This means all contributors work strictly in parallel, working with their own sets of files. This does not mean there is no collaboration in the sense of coordinated parallel effort, though.(ii) The centrality index of graph ii is maximum, meaning that one person in the team collaborates with all other contributors, which do not collaborate together. This typical star graph topology indicates that contributors tend to work separately from each other and to be coordinated by a unique central member.
(iii) Graph iii shows low to average centrality index and a non-zero clustering index. This indicates a rather loose coupling of activities which may be modularized in more specialized and closely connected sub-teams.
(iv) Graph iv is complete, which is reflected by a maximum clustering index. This means all contributors collaborate with all other contributors.
In order to identify typical patterns of collaborative work, these indicators are fed into a
![]() $k$
-means clustering algorithm (Pedregosa et al.
Reference Pedregosa, Varoquaux, Gramfort, Michel, Thirion, Grisel, Blondel, Prettenhofer, Weiss, Dubourg, Vanderplas, Passos, Cournapeau, Brucher, Perrot and Duchesnay2011). The output of this algorithm is a partition of objects in k groups according to their relative distances. The optimal number of clusters
$k$
-means clustering algorithm (Pedregosa et al.
Reference Pedregosa, Varoquaux, Gramfort, Michel, Thirion, Grisel, Blondel, Prettenhofer, Weiss, Dubourg, Vanderplas, Passos, Cournapeau, Brucher, Perrot and Duchesnay2011). The output of this algorithm is a partition of objects in k groups according to their relative distances. The optimal number of clusters
![]() $k$
– that is, the number of cluster so that adding another cluster does not provide further information – is calculated with the help of the elbow method (Tibshirani, Walther & Hastie Reference Tibshirani, Walther and Hastie2001).
$k$
– that is, the number of cluster so that adding another cluster does not provide further information – is calculated with the help of the elbow method (Tibshirani, Walther & Hastie Reference Tibshirani, Walther and Hastie2001).
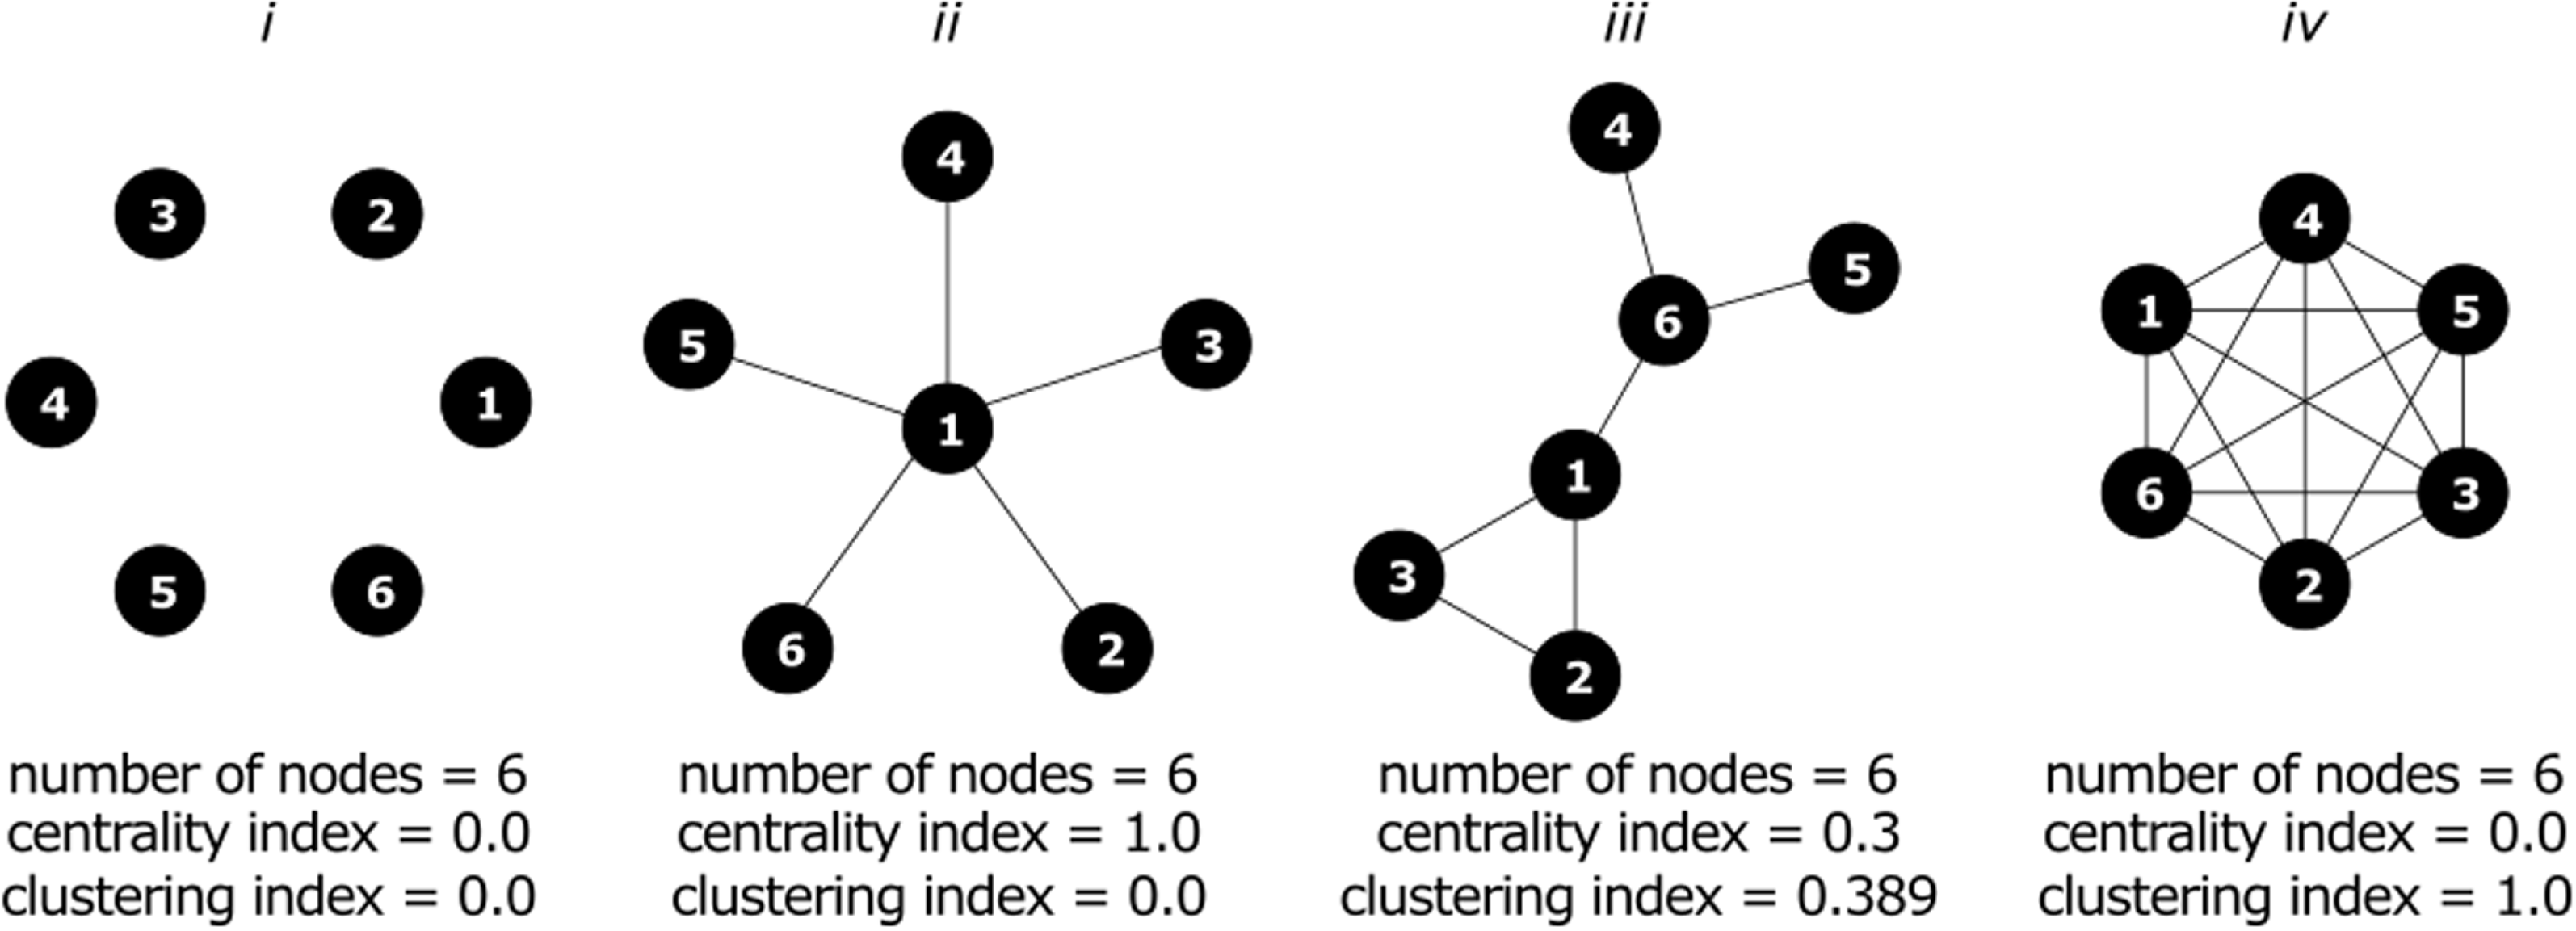
Figure 7. Four exemplary and archetypal graph topologies.
5 Results
This section sequentially presents the results achieved through the application of the four-step method introduced in Section 4.
5.1 Product selection
Data acquisition was carried out between March 2016 and March 2018 and 242 products in total satisfied the conservative selection criteria. References to the selected products are provided as supplementary material to this article. Figure 8 delivers a classification of the selected products according to the United Nations Standard Products and Services Code.Footnote 14

Figure 8. Classification of the selected product into product categories.
The largest categories represented are processing machinery (48 products), laboratory equipment (36 products), recreational equipment (33 products) and vehicles (30 products), covering more than 60% of the dataset. The category processing machinery includes mainly desktop machine tools such as the 3D printer UltimakerFootnote 15 or the laser cutter Lasersaur.Footnote 16 Laboratory equipment includes measurement equipment such as the polymerase chain reaction thermocycler OpenPCRFootnote 17 and research platforms such as the modular humanoid robot NimbRo-OP2.Footnote 18 Recreational equipment covers musical instruments such as the 3D-printable violin HovalinFootnote 19 as well as toys and games such as the educational robot Tymio.Footnote 20 The category vehicles mainly consist of bikes like XYZ Space Frame VehiclesFootnote 21 and cars like the Tabby OSVehicle.Footnote 22
5.2 Repository identification
Among the 242 selected products, 105 were found to use GitHub to store hardware-related data. 256 repositories where found to be related to the hardware development activities of these products. The references of the GitHub repositories corresponding to each product development project are provided as supplementary material to this article.
5.3 Data extraction
The metadata extraction scripts have been run on the 29th of March 2018. The file versioning history of all the identified repositories from the first commit to this date has been extracted. All further works that happened in the development of the identified products after this date are therefore not covered by this article.
5.4 Indicators computation
In this section, the extracted metadata is analysed according to the indicators described in Section 4.4. The first subsection deals with the volume of development activity (RQ1) and the second subsection with the distribution of the development activity among contributors (RQ2).
5.4.1 Volume of observable development activity
Figure 9 provides an overview of the volume of activity over all projects. It displays the distribution of all file changes recorded in all repositories of all projects until the 29th of March 2018. Figure 10 displays the same information but focuses on CAD and documentation files, while Figure 11 focuses exclusively on CAD files. Each black dot on those figures stands for a file change. Each line of successive points represents the history of file changes for a given project. The projects are sorted from the bottom to the top of the figure according to the date of their first commit. The slope of the front of first commits gives an indication of how many projects started by unit of time. The green curve represents the number of file changes per month. The orange curve represents the rolling mean of the green curve over 12 months.
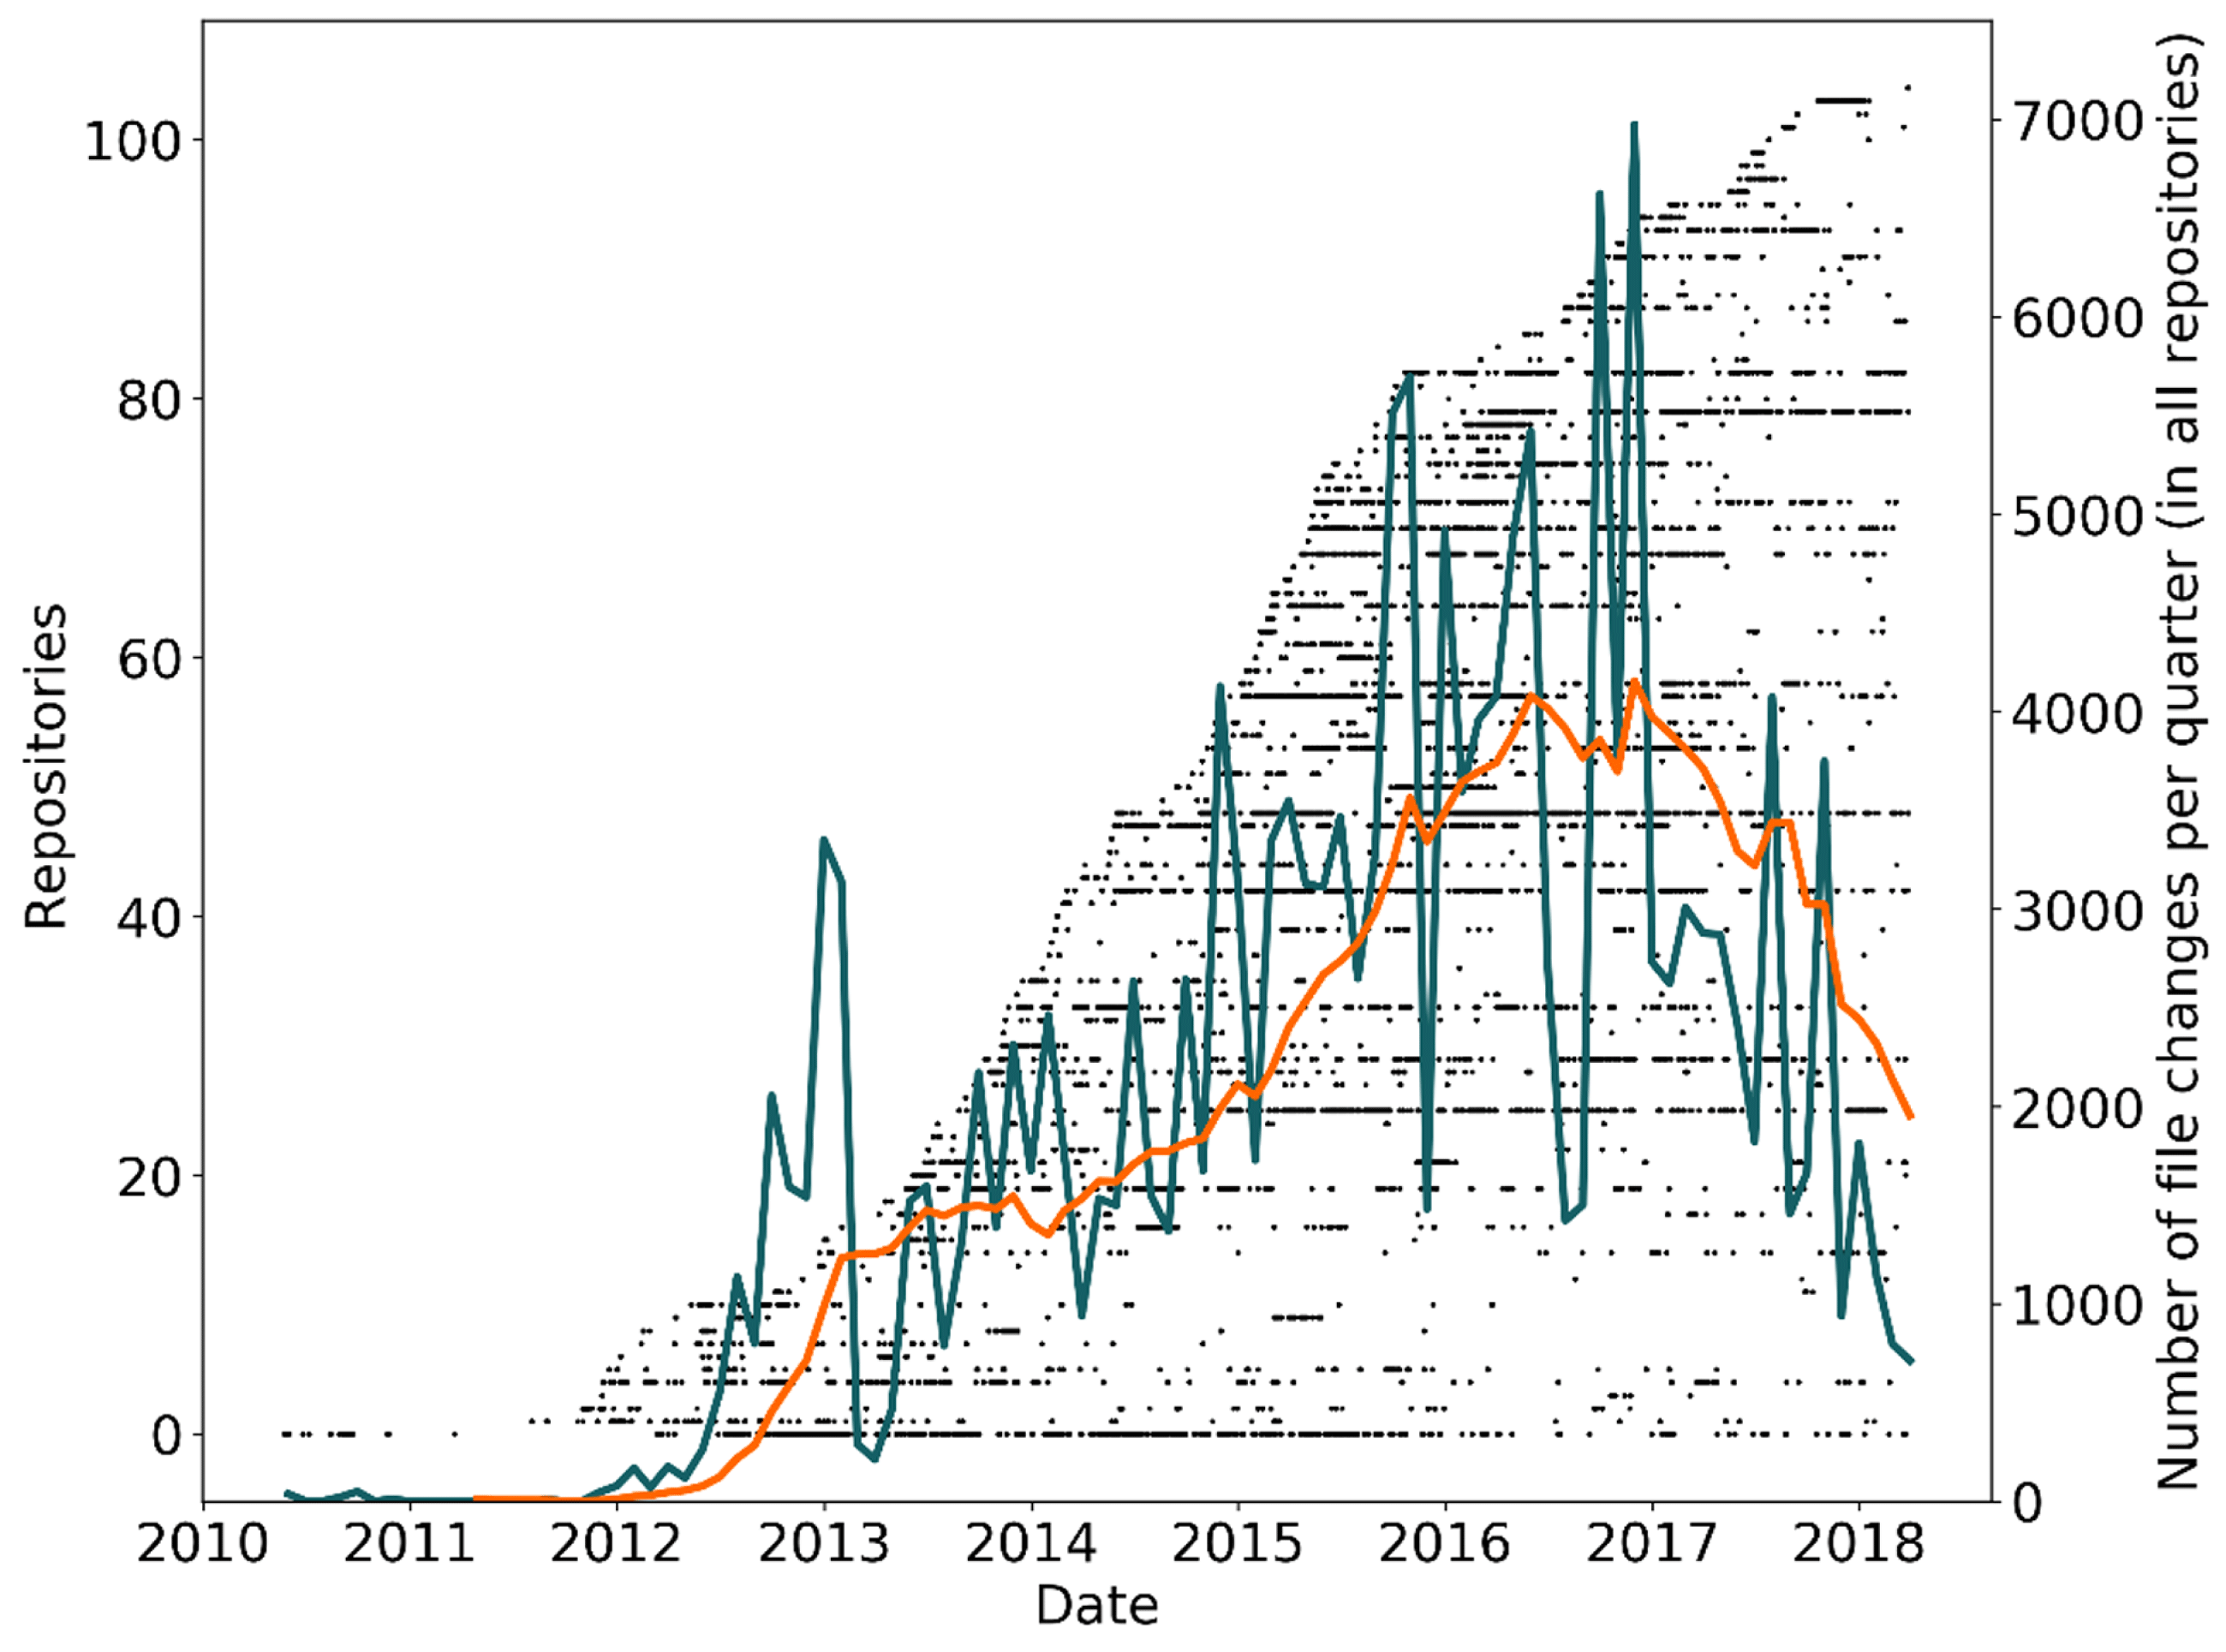
Figure 9. Distribution of file changes over time (all file types included).
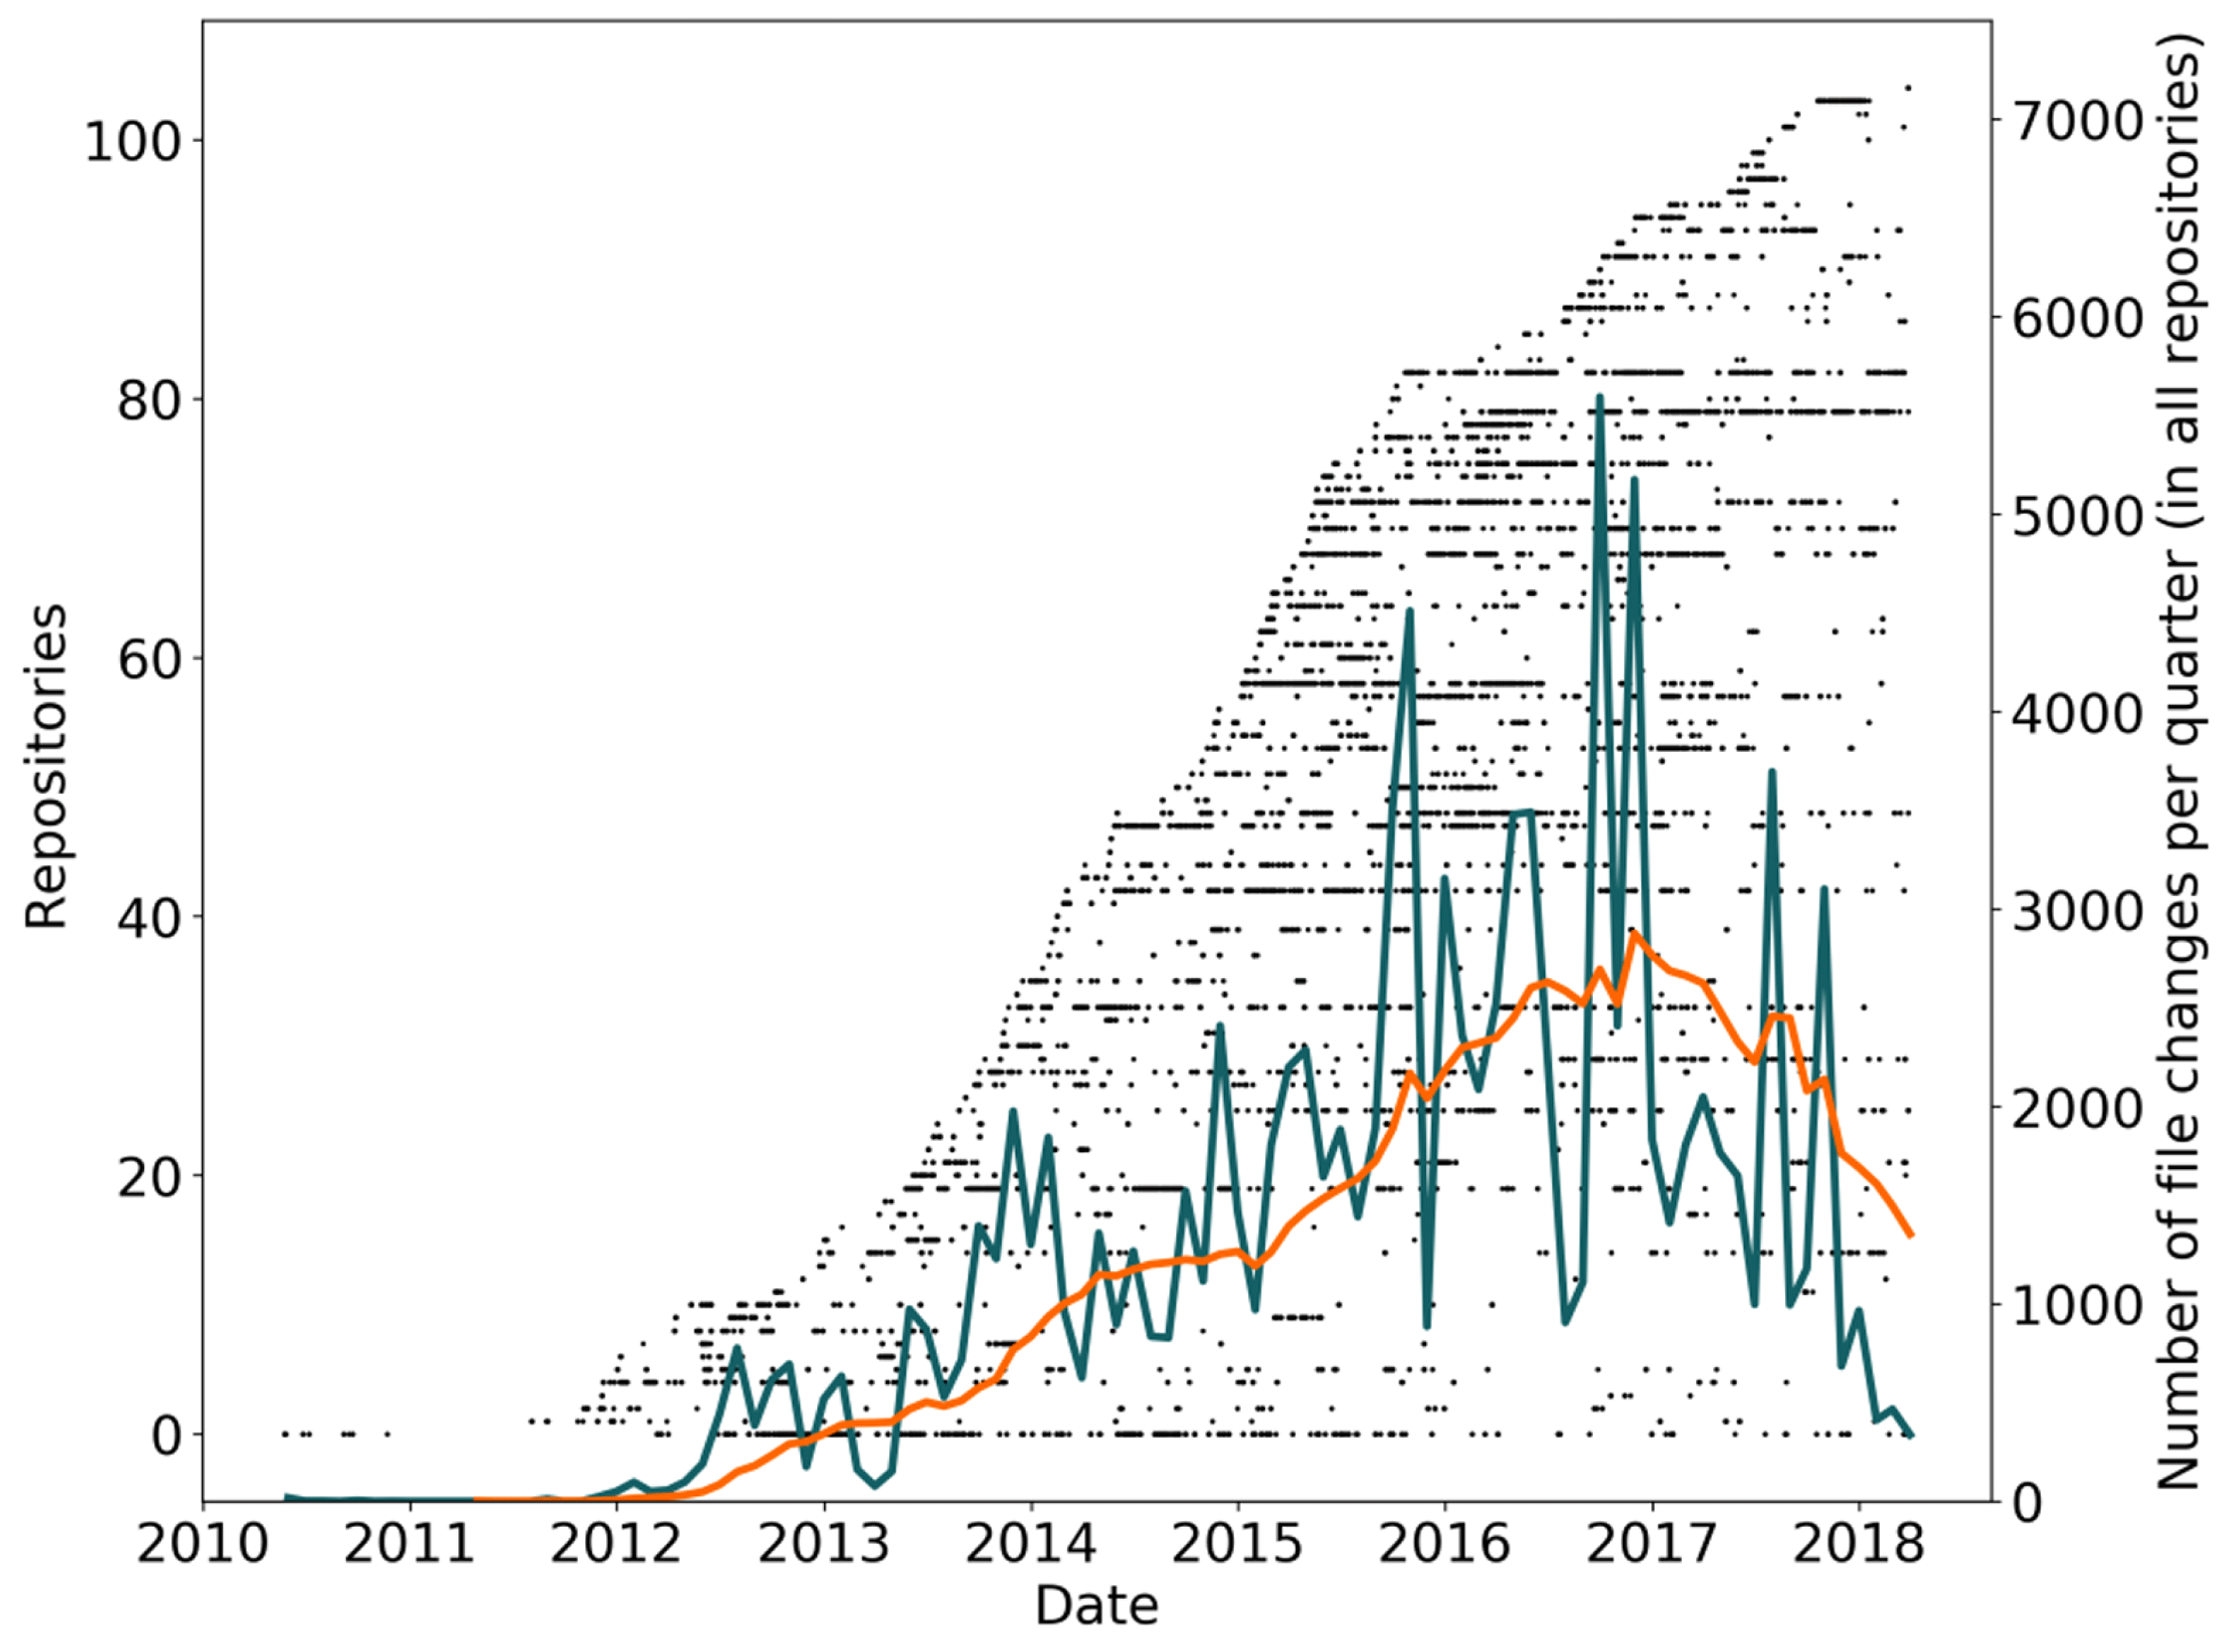
Figure 10. Distribution of file changes over time (CAD and documentation files only).

Figure 11. Distribution of file changes over time (CAD files only).
All three series show the same behaviour. The number of file changes per month is visibly unstable, indicating a high variability in the volume of work performed in these projects over time. The average value of the number of file changes per month grows until 2017 and decreases afterwards. The first phase of growth in observable activity can be interpreted as a growth of the cumulated activity of the identified projects or as an increased capture of this activity on GitHub. The decrease in activity occurring after the beginning of 2017 can be either explained by a decrease in the use of GitHub or as a decrease in the number of active projects. The decreasing slope of the front of first commits after 2016 which is visible in the three figures tends to confirm the second interpretation. The decrease in the number of active projects after 2017 can be further interpreted as a gap between existing activity and discovered activity. Indeed, projects which started a few months before the reported research may have not be known and established enough in order to be discovered in the web-based product search.
The total number of recorded file changes in these three series are, respectively, 175 k, 110 k and 53 k. This indicates that roughly one third of all editions affect CAD files, one third probably hardware-related documentation and another one third other unidentified files of software files.
Figure 12 displays the number of recorded file changes for each individual project, sorted by number of recorded editions of CAD files. While projects count up to 7500
![]() $+$
CAD file changes, 45% (47/105) of them count less than 100 file changes. The series of unfiltered file changes shows a similar hyperbolic shape. It ranges up to 21000
$+$
CAD file changes, 45% (47/105) of them count less than 100 file changes. The series of unfiltered file changes shows a similar hyperbolic shape. It ranges up to 21000
![]() $+$
while 60% (63/105) of all projects recorded less as thousand file changes. These figures indicate a general heterogeneity of the dataset. While some projects show intense observable development activity, some others host activity that is either less intensive or not captured in GitHub.
$+$
while 60% (63/105) of all projects recorded less as thousand file changes. These figures indicate a general heterogeneity of the dataset. While some projects show intense observable development activity, some others host activity that is either less intensive or not captured in GitHub.
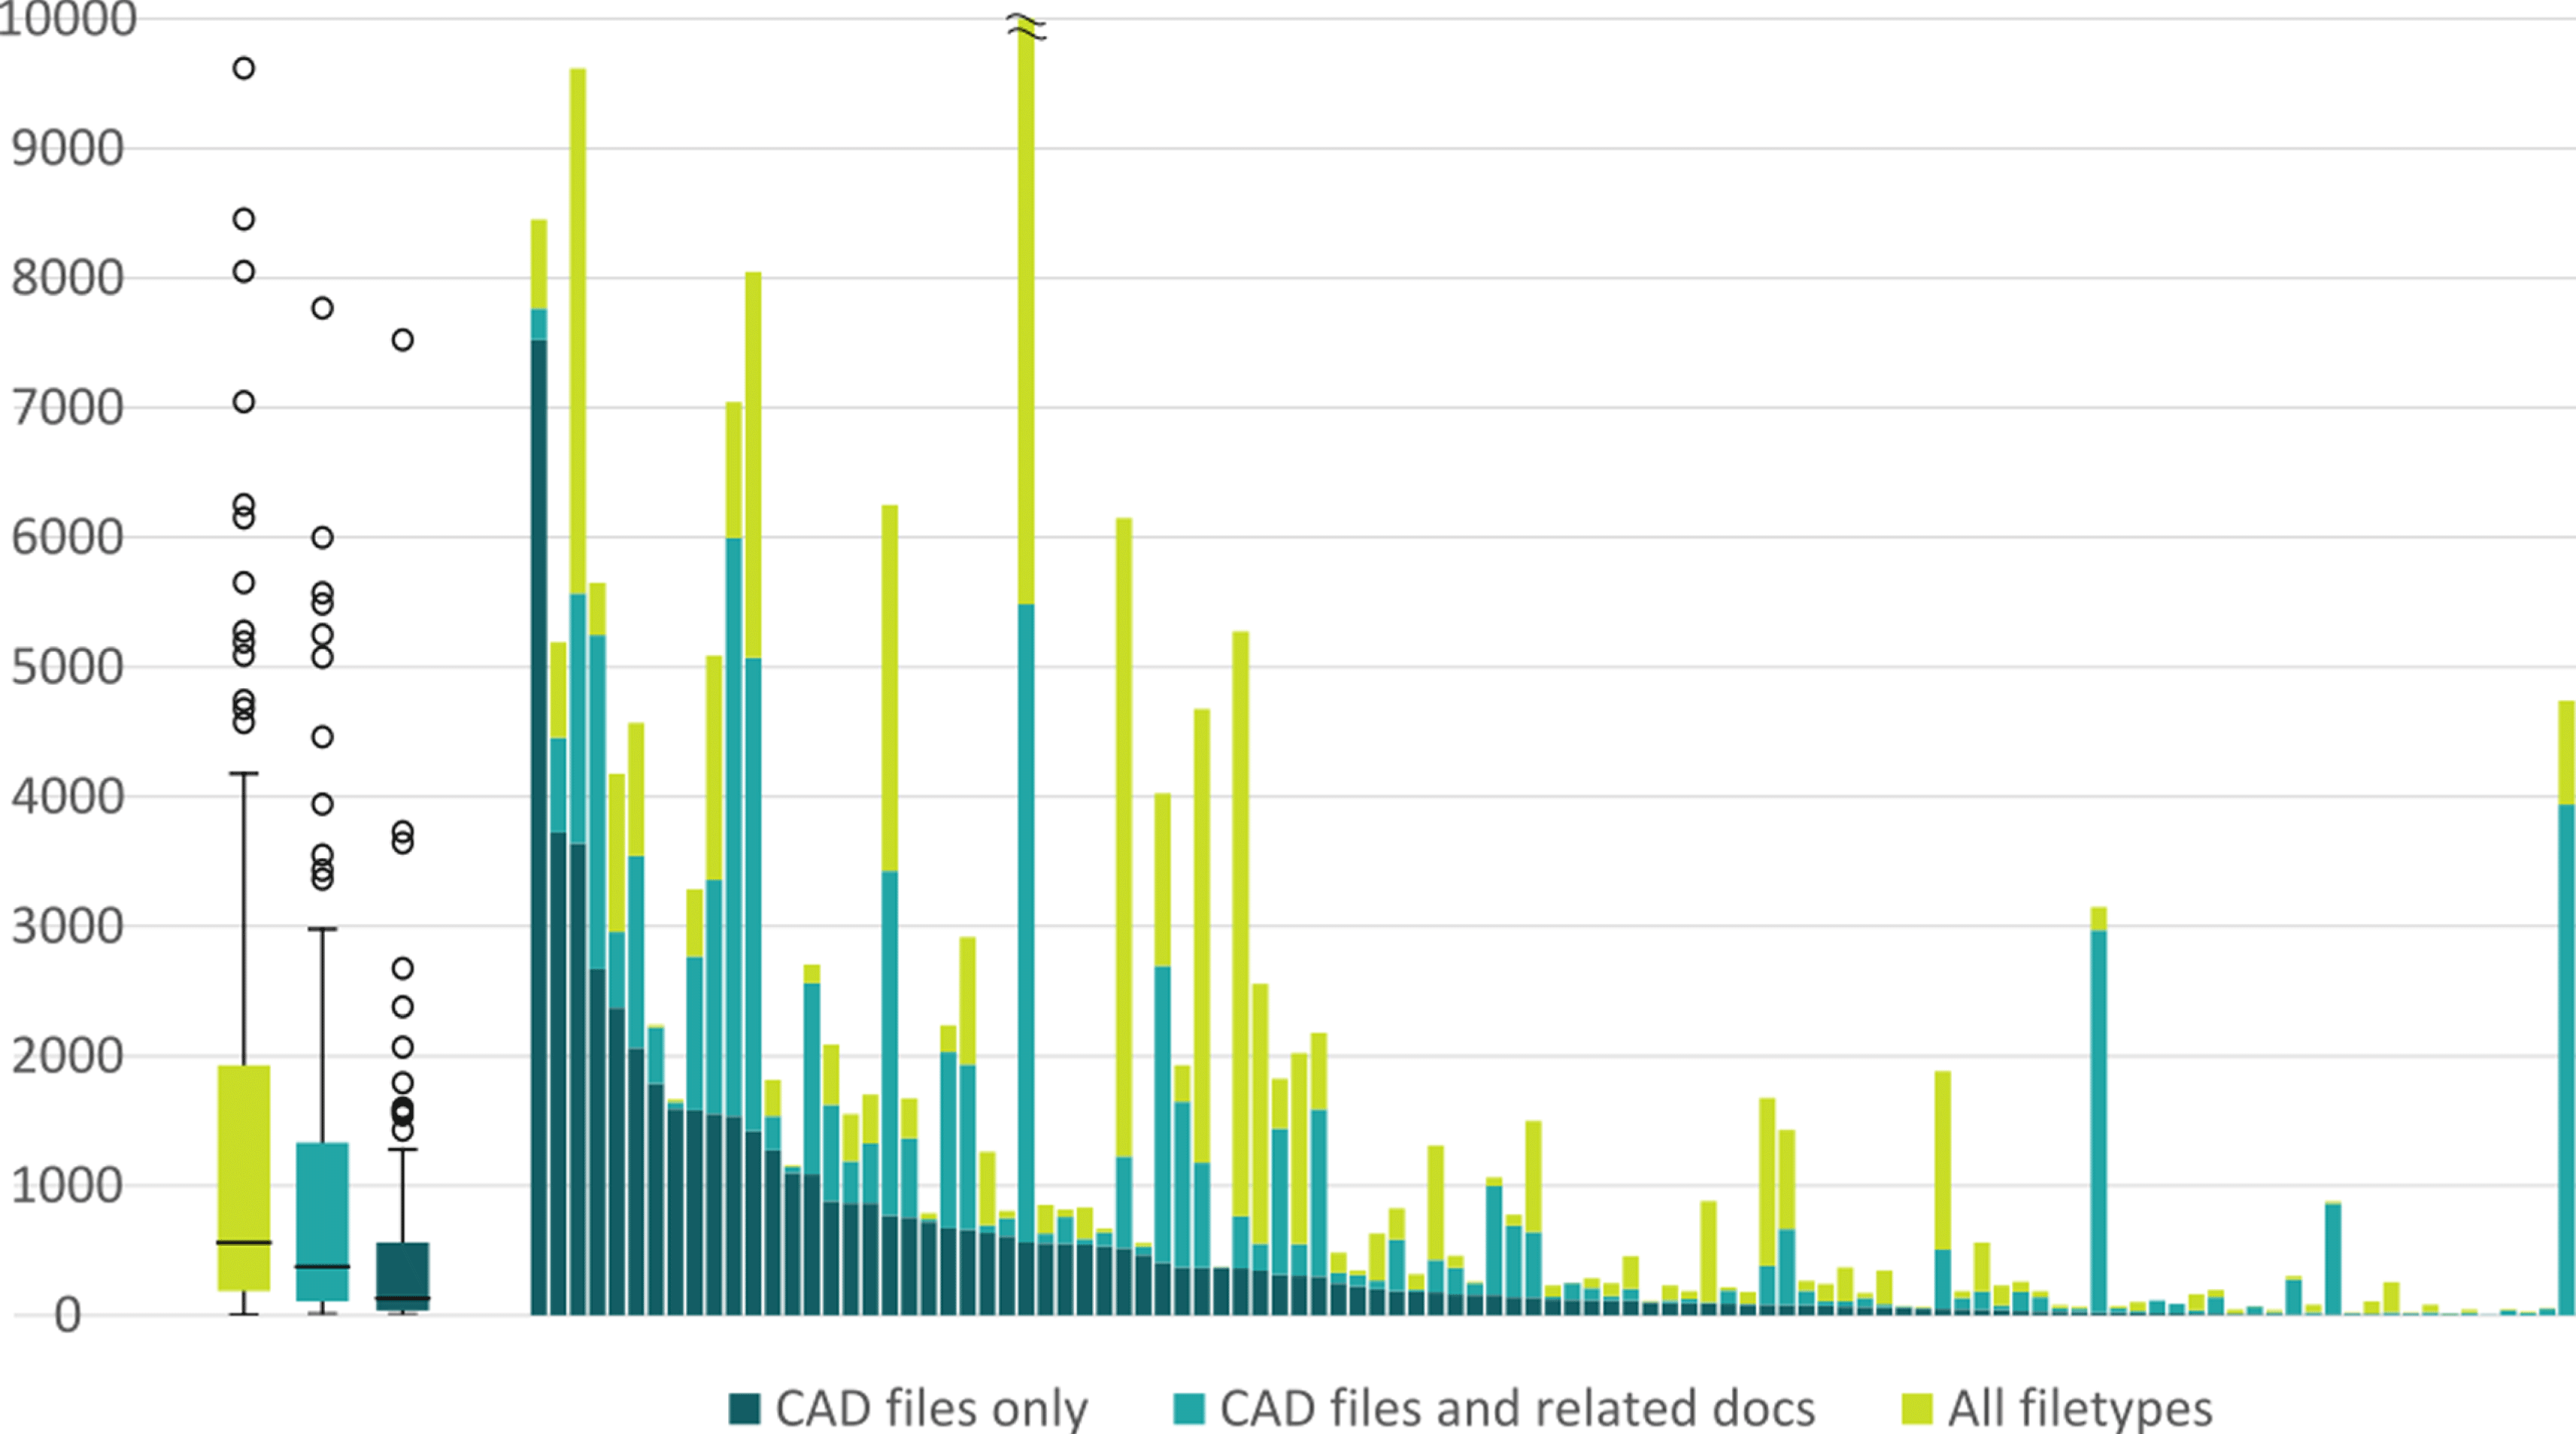
Figure 12. Number of recorded file changes per project.
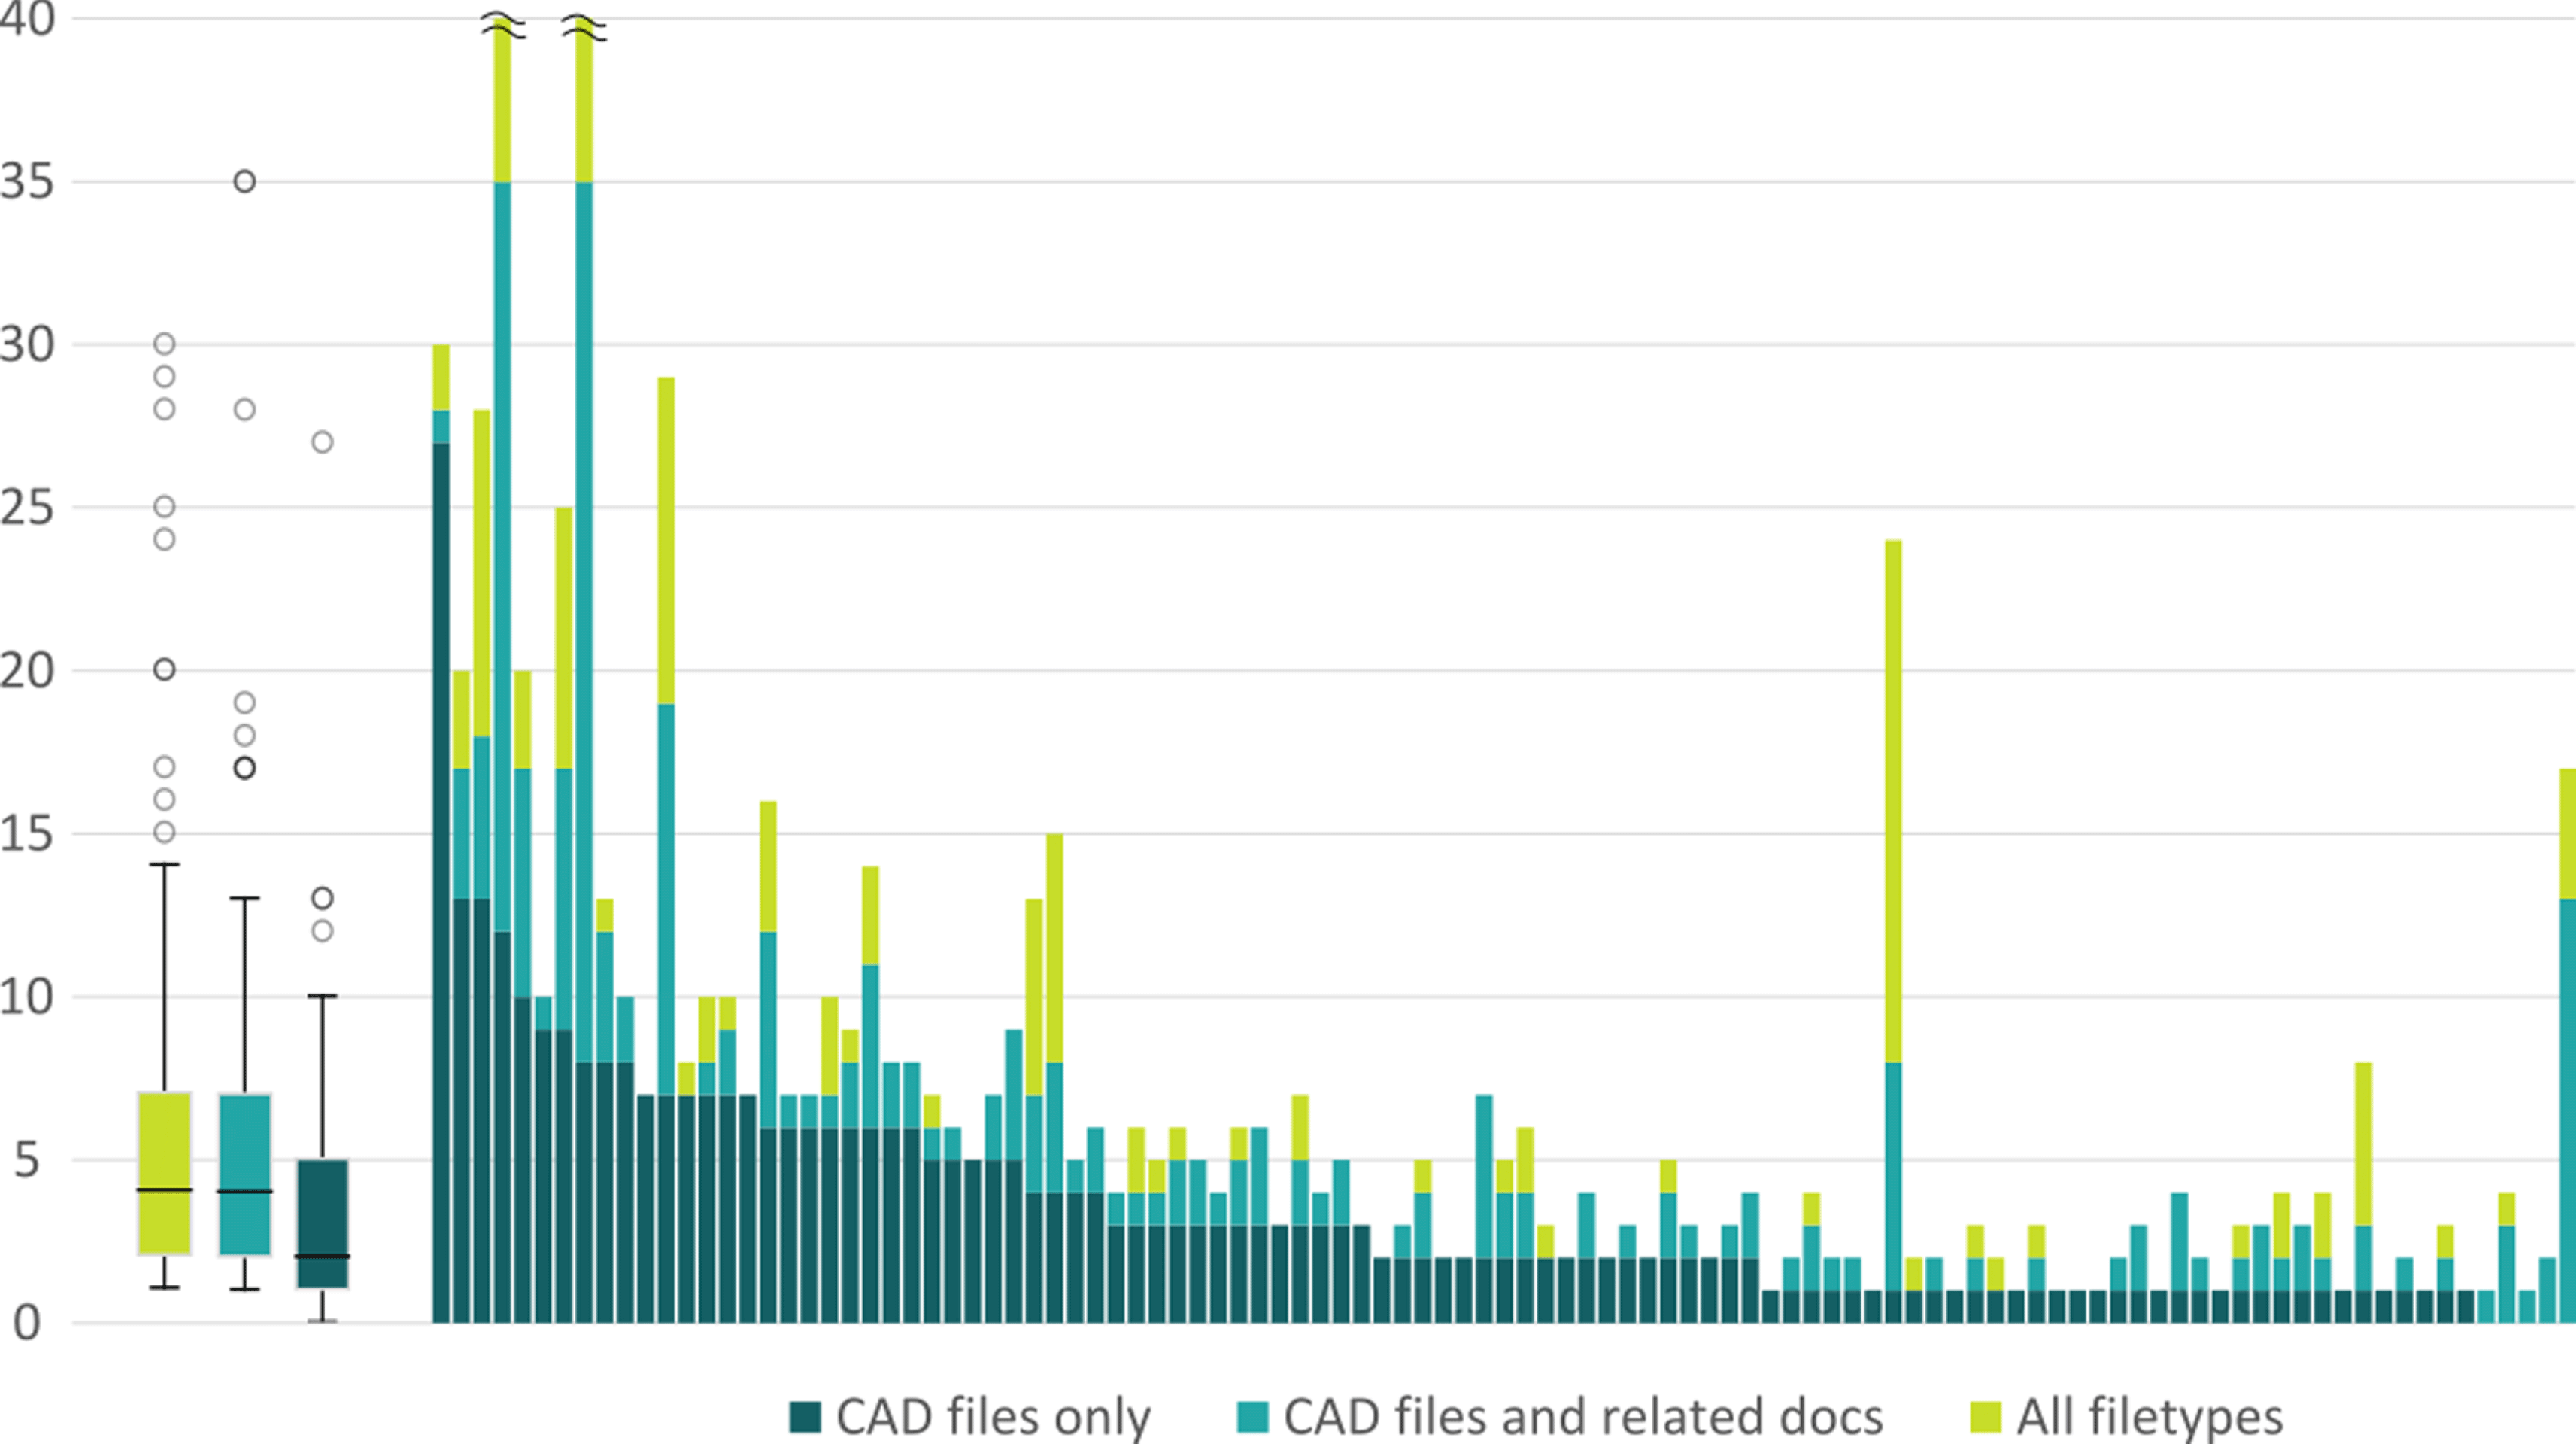
Figure 13. Number of contributors in each project.
5.4.2 Distribution of development activity
Figure 13 displays the number of contributors in each individual project, sorted by number of contributors having at least affected CAD files. The average number of contributors per project is 7.26 with a maximum value of 79. Considering only the contributors having affected CAD files, these values drop to 3.42 and 27, respectively. 14% (15/105) of all projects are individual projects, meaning there is only one person contributing to all file changes. 33% (35/105) of all projects have only one person contributing to the edition of CAD files. This indicates that a non-negligible share of all projects do not show any evidence of collaborative activity. Expressed more precisely, for a non-negligible number of projects, the eventual collaborative activity happening is not captured on GitHub. The share of projects showing no evidence of collaborative activity is higher when considering only CAD files.
Figure 14 displays the results of the
![]() $k$
-means clustering applied to the file co-edition networks (all file types included). Four clusters are identified by a specific colour and a centre, the latter representing the archetypal and fictive data point minimizing the distance to all real data points of the corresponding cluster. Data points are displayed as dots and cluster centres as crosses. The table attached to this figure provides the coordinates of the cluster centres and the number of projects belonging to each cluster. Figure 15 provides an example of file co-edition network illustrating each cluster.
$k$
-means clustering applied to the file co-edition networks (all file types included). Four clusters are identified by a specific colour and a centre, the latter representing the archetypal and fictive data point minimizing the distance to all real data points of the corresponding cluster. Data points are displayed as dots and cluster centres as crosses. The table attached to this figure provides the coordinates of the cluster centres and the number of projects belonging to each cluster. Figure 15 provides an example of file co-edition network illustrating each cluster.

Figure 14. Results of the
![]() $k$
-means clustering (all file types included). Individual projects are depicted as dots in a normalized three-dimensional space. Colours represent affiliation between data points and clusters. Crosses depict cluster centres.
$k$
-means clustering (all file types included). Individual projects are depicted as dots in a normalized three-dimensional space. Colours represent affiliation between data points and clusters. Crosses depict cluster centres.
The four identified clusters can be interpreted as four project types. These can be described as follows:
(i) Cluster 0: Closely connected decentral networks with connected sub-teams. Their average number of contributors is high with a high variance. The medium centrality and clustering indexes indicate there are numerous links between contributors and no clearly defined central node.
(ii) Cluster 1: Individual projects or projects involving a low number of people working in parallel. Almost all indicators are low, the average number of nodes is less than two, and there are hardly links between the nodes.
(iii) Cluster 2: Highly centralized projects, with a low to average number of contributors and some outliers having higher numbers of contributors. The high centrality index and the low clustering index indicates that the network tends to be star-shaped, meaning that all works are reviewed, overtaken by or taken from the same ‘gatekeeper’.
(iv) Cluster 3: Loosely connected decentral networks with disconnected sub-teams or isolated contributors. The number of contributors is medium to low with a low variance. The average centrality index and low clustering indexes indicate there are some small star shaped sub-teams.
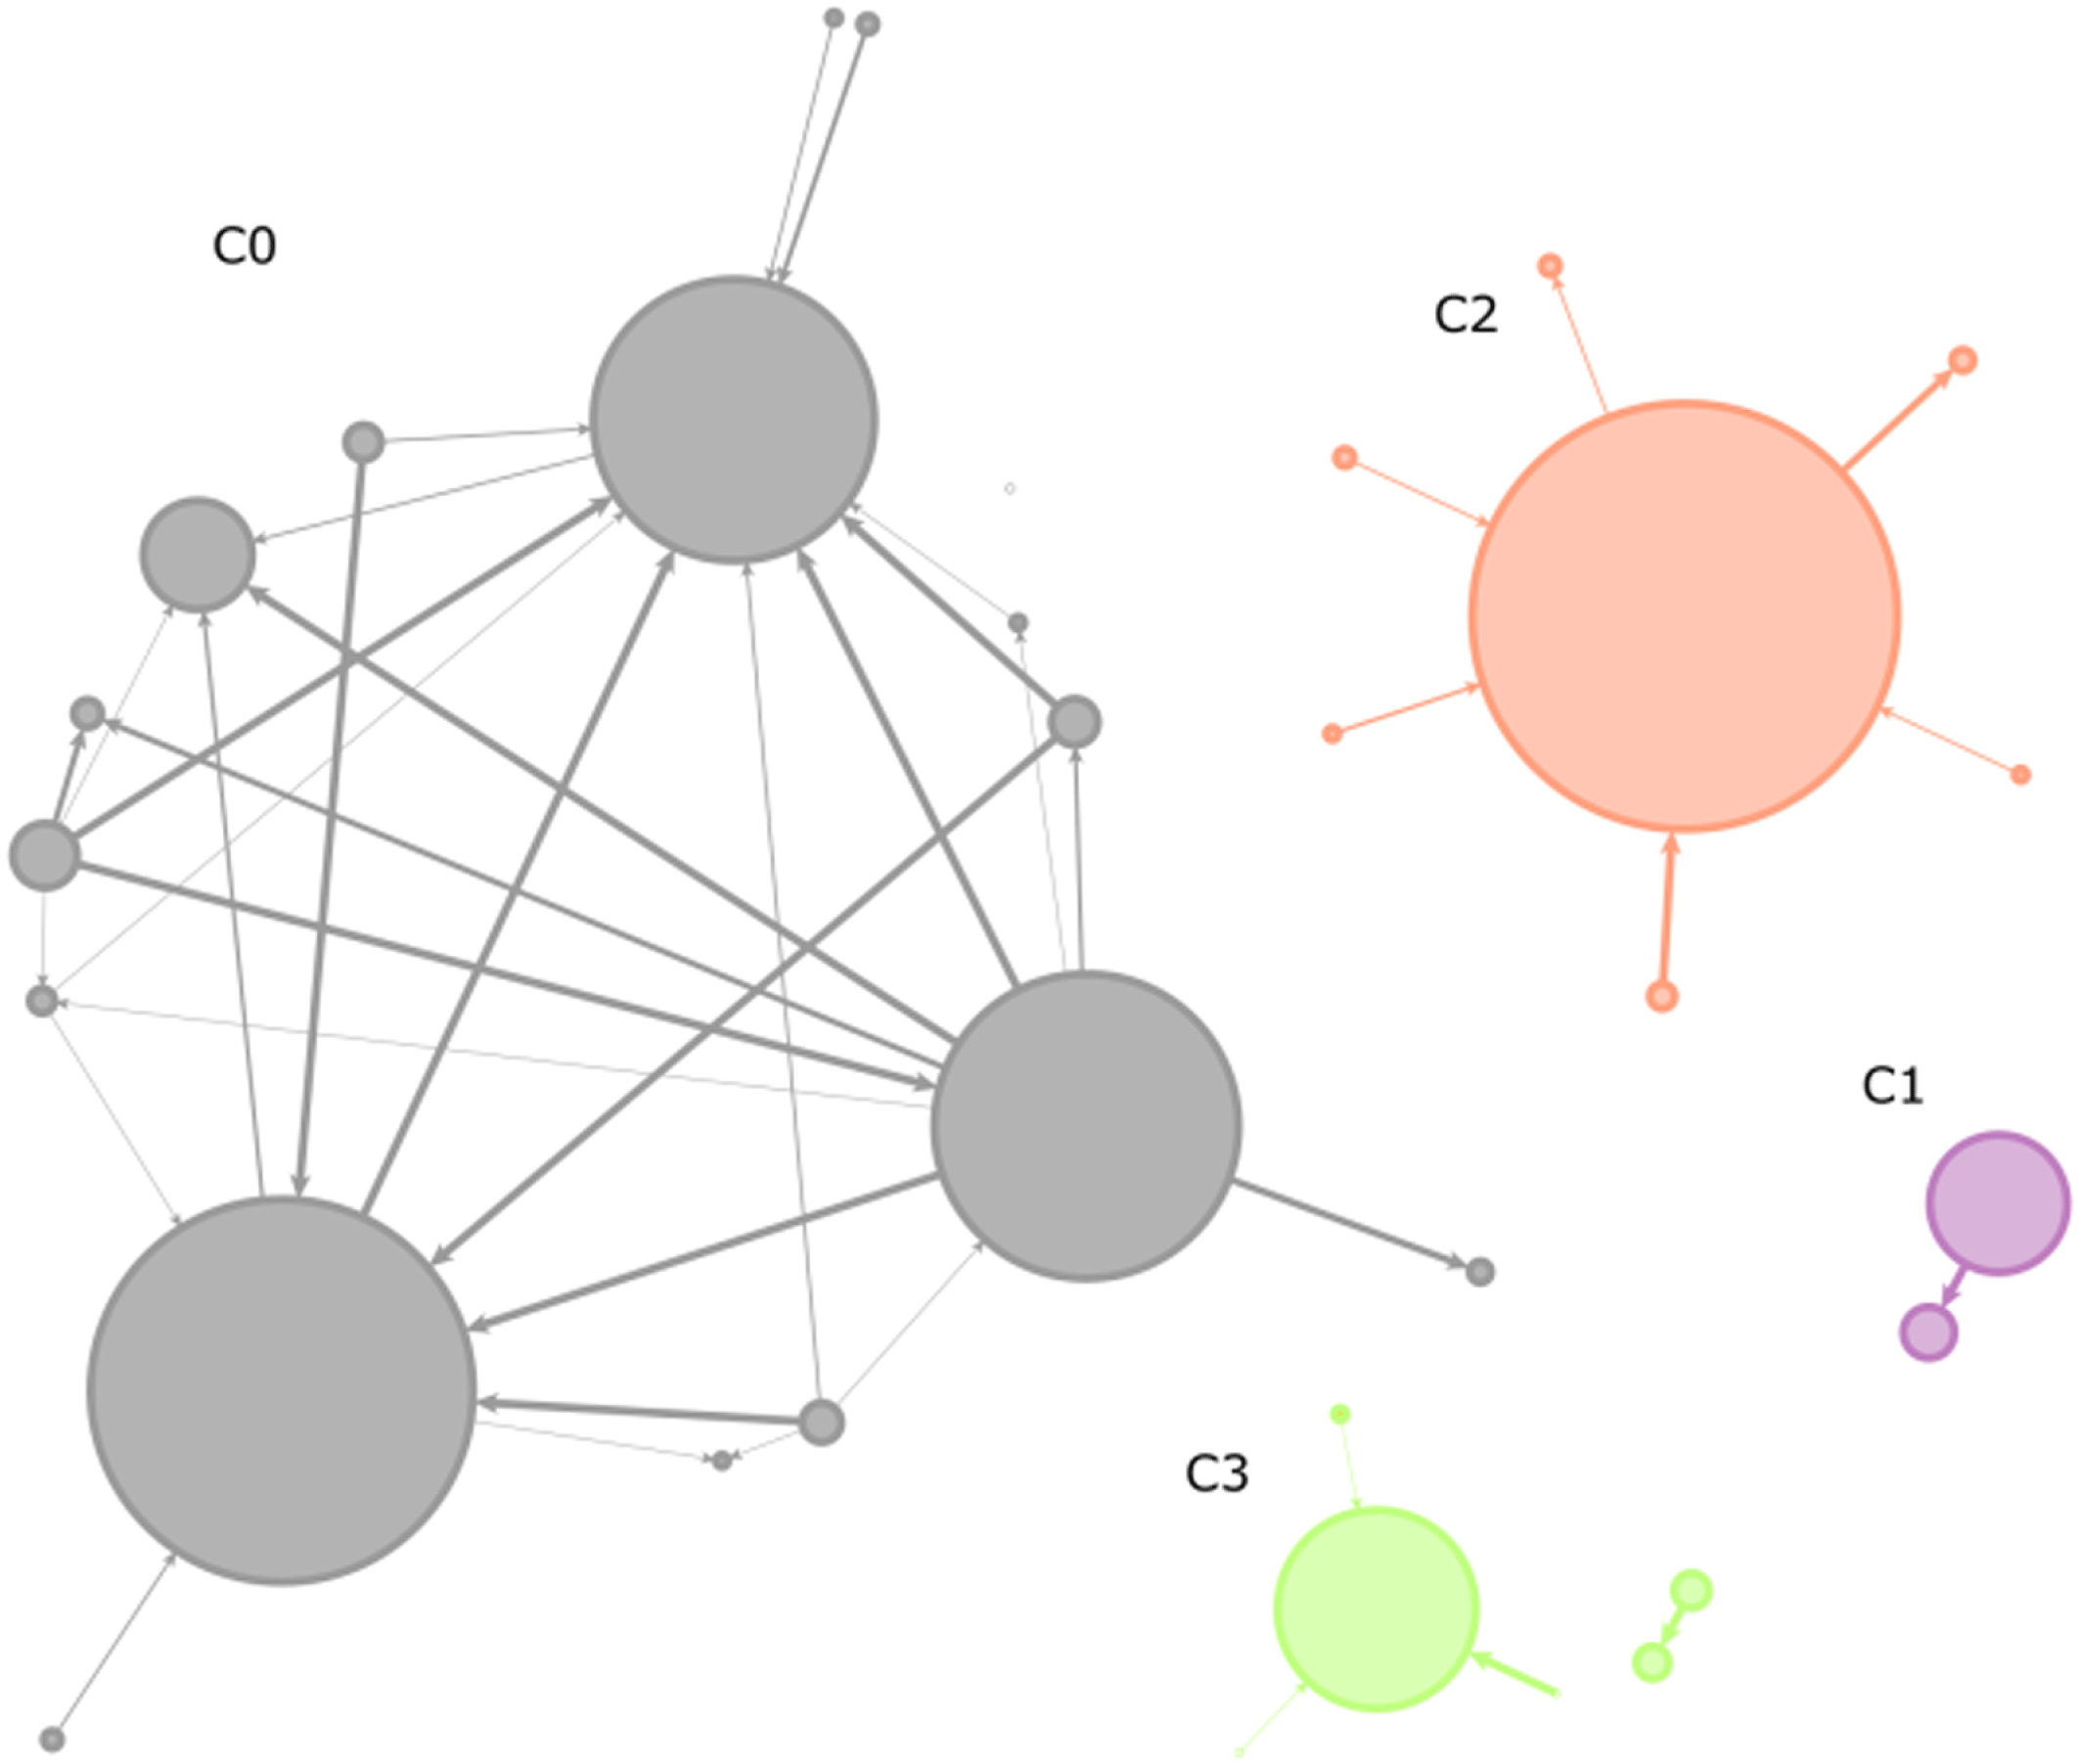
Figure 15. Examples of file co-edition networks for each of the four clusters introduced in Figure 14. The node surface depicts the number of file changes committed by each contributor. The edge thickness depicts the number of interactions between contributors.
Projects of cluster C1, which represents 33% (35/105) of all projects, hardly show evidence of collaborative work. These projects may have opted for a limited openness to participation of external people or may experience difficulties in recruiting participants. Alternatively, it is possible that the interactions between contributors are not captured by the observation method. On the contrary, projects of clusters C0, C2 and C3, which represent 66% (70/105) of all projects, show concrete evidence of distributed collaborative work and can be therefore qualified as OSPD projects. In these projects, collaboration happens either following a fully centralized pattern, a closely coupled decentralized pattern or a more loosely coupled decentralized pattern. C0 particularly shows the characteristics of a small-world network (midrange centrality and clustering indexes) observed in OSSD.
Figure 16 displays the results of the same clustering method applied to the contributor interactions on CAD files only, which can be interpreted as follows. Figure 17 provides an example of file co-edition network illustrating each of the resulting clusters.
(i) Cluster 0: less projects tend to fall into the category of closely related decentral networks, since the number of data points in this cluster is reduced by a half. The average number of contributors is also sensibly lower.
(ii) Cluster 1: On the contrary, the category of individual projects almost doubles as the number of projects in this cluster reaches 68. The other characteristics of this cluster remains unchanged.
(iii) Cluster 2: The average number of contributors to the highly centralized projects drops to almost three. Consequently, this category summarizes in this case as projects led by one person and involving two satellites.
(iv) Cluster 3: Like cluster 0, this category shrinks by more than 50% and his average number of contributors drops sensibly. Its structure as loosely coupled decentral network remains unchanged, though.
In this new case, the share of projects showing clear evidence of collaborative work and qualifying as OSPD has decreased. Clusters C0 and C3 gather projects with a decentral structure and represent 25% (26/105) of the dataset. These categories do not only shrink in number of projects but also in average number of contributors per project. On the contrary, the share of projects showing little evidence of collaborative activity increase in this case. The category of individual projects C1 now represents 64% (68/105) of all projects and is caught up by C2 whose average number of participants dropped to three (11 projects, 10% of the dataset).
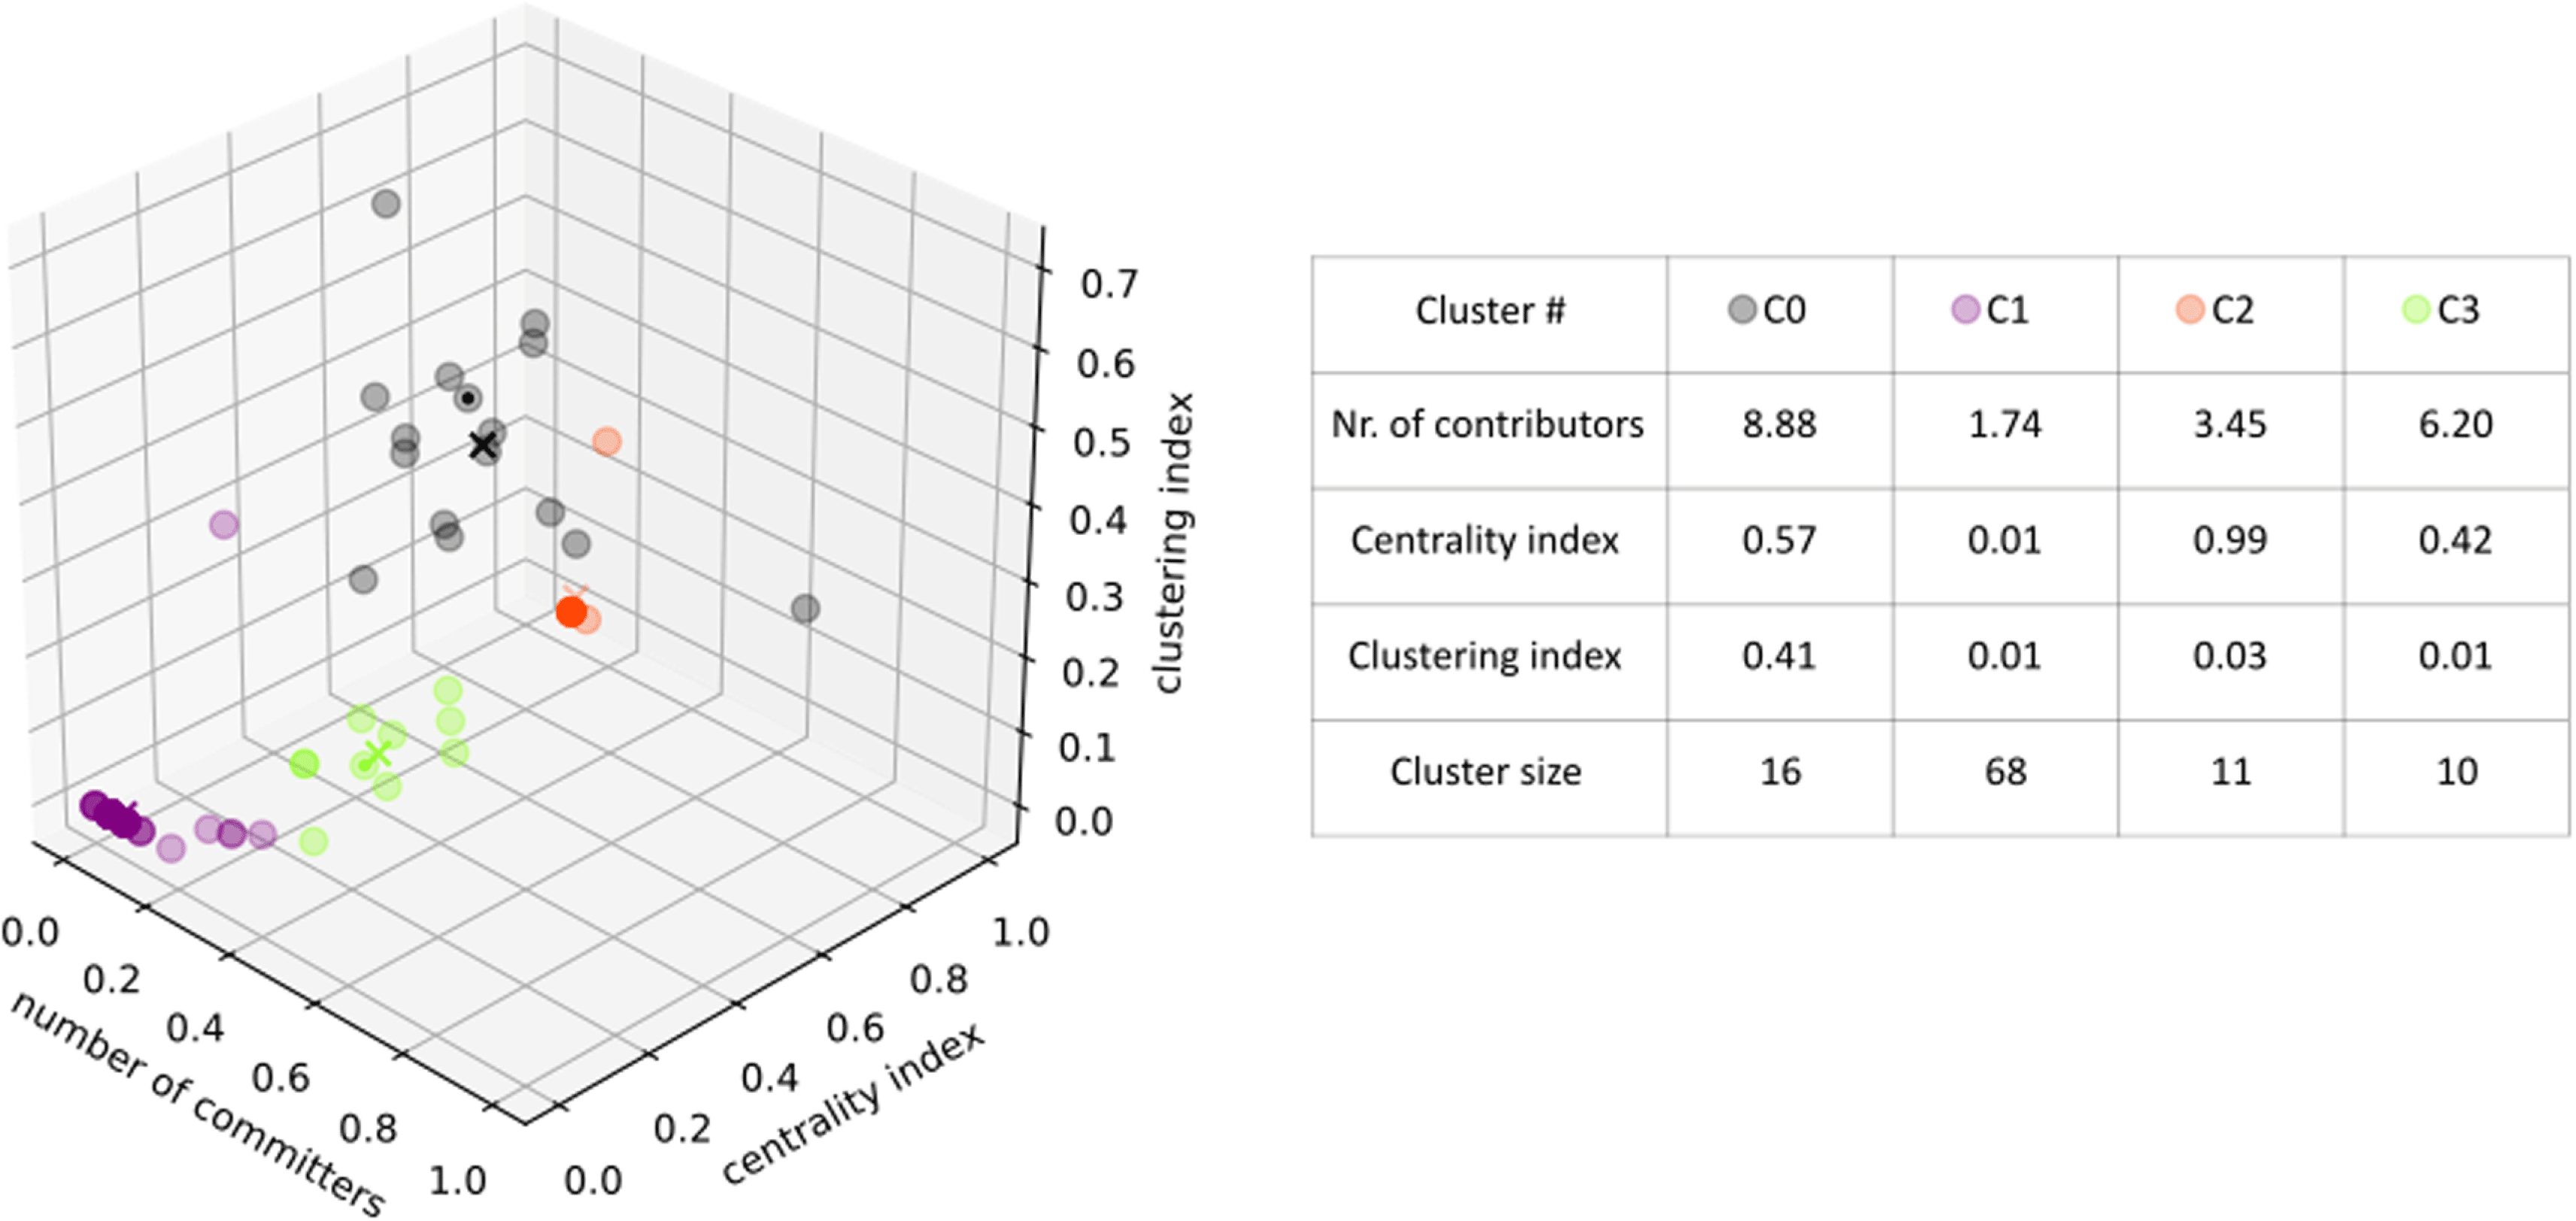
Figure 16. Results of the
![]() $k$
-means clustering (CAD files only). Individual projects are depicted as dots in a normalized three-dimensional space. Colours represent affiliation between data points and clusters. Crosses depict cluster centres.
$k$
-means clustering (CAD files only). Individual projects are depicted as dots in a normalized three-dimensional space. Colours represent affiliation between data points and clusters. Crosses depict cluster centres.

Figure 17. Examples of file co-edition networks for each of the four clusters introduced in Figure 16. The node surface depicts the number of file changes committed by each contributor. The edge thickness depicts the number of interactions between contributors.
Since only a part of the development activity happening in projects is considered here, it is not surprising to observe less intense activity and collaboration. Interesting to notice is that there is still some forms of collaborative activity observable while focusing on CAD files, which clearly means that hardware development effort is not excluded from the collaborative development patterns adopted in these projects.
6 Discussion
The results presented in the previous section deliver a heterogeneous picture of hardware development practices in OSH. Concerning RQ1, a significant share of the 105 considered OSH products show histories of numerous visible file editions. This indicates the presence of product development activity happening in transparent processes along which product-related data is publicly accessible. This fits with a product development strategy not only aiming at product openness by labelling products as ‘open source’ but also aiming at transparency along the product development process. This is however not the case for all considered products, a not less significant share of which offers a low volume of observable activity. As for RQ2, the results showed clear evidence of distributed development activity happening in two thirds of the considered OSH projects. A significant share of projects show a decentralized structure. Different forms of internal organization could be observed, from star-shaped central organization to decentral networks of closely or loosely integrated sub-teams. 30% of all projects reproduced the small-world network topology previously observed in OSSD.
6.1 Interpretation of the results and open questions
These results confirm the heterogeneity of practices in open source hardware previously observed by the authors (Bonvoisin et al. Reference Bonvoisin, Mies, Stark and Jochem2016), who hypothesized that the development of OSH tends to fill a continuum between OSPD defined here and public innovation (Bonvoisin et al. Reference Bonvoisin, Mies, Stark and Boujut2017a ). Alternatively, this heterogeneity may corroborate the observations made by Özkil (Reference Özkil2017) in the context of simpler products. They identified in a large population of designs a low number of really successful and collaborative projects and a large number of ‘infertile’ and ‘dormant’ designs. It also fits with observations made by Xu et al. (Reference Xu, Christley, Madey, Bitzer and Schröder2006) who mentioned that a majority of OSSD projects on Sourceforge.org have only one contributor.
Deciding upon these two interpretations would require investigating whether the low number of contributors and volume of visible activity in some projects is intentional or accidental. Whether the project originators intend to keep the product development process closed or fail in acquiring contributors and contributions remains an open question. Also, it is not clear how far the transparency achieved in product development projects and visible in the history of file changes is reflected in a certain process accessibility as defined by Balka, Raasch & Herstatt (Reference Balka, Raasch and Herstatt2010), that is, the ability for any interested person to join the product development process. While the data shows how distributed the product development effort is, it reveals neither the geographical dispersion of contributors nor their respective social relations. It therefore does not allow drawing conclusions on how their contributions have been acquired. Further research based on content analysis or qualitative data acquisition is required to understand the factors of success in building an effective community of contributors. In any way, these results contradict the idealistic perception of open source as being intrinsically community-based and calls for a differentiated perception of the phenomenon of OSH.
Interesting is that the observations made while considering all files independently from their nature have been successfully repeated while focusing solely on hardware-related data (CAD files). This confirms that distributed collaboration is not confined to the non-hardware components but also applies to the hardware components. Nonetheless, distributed collaboration on CAD files showed to be sensibly lower than those observable while considering the whole design activity. While 61% of all projects could be classified as OSPD while considering all file changes, only 19% could be considered as such while considering only CAD files. This tends to indicate either that the contributors working with CAD tend to work in smaller teams or alone or that GitHub does not capture this activity. This last hypothesis is probable as GitHub has not been originally developed for hardware development and may not provide the necessary PDM features to support collaboration on CAD files. Further research may investigate whether this situation is contextual and due to the slow settlement of an upcoming trend or whether there are intrinsic reasons for a higher difficulty to distribute the development of hardware. Nevertheless, these results clearly indicate the expansion of the open source development model from the software branch to the realms of physical products and provide the first large-scale empirical evidence of this recent evolution.
However, while a significant OSPD activity volume could be observed, it remains far beyond those observable in OSSD where successful projects may gather thousands and even tens of thousands of contributors (see, for example, Xu et al. Reference Xu, Christley, Madey, Bitzer and Schröder2006; Asri et al. Reference Asri, Kerzazi, Benhiba and Janati2017). It seems OSH still faces the challenge to mature and switch from a ‘hobbyist’ participation model and to a ‘professional’ one, to use categories given by Malinen et al. (Reference Malinen, Mikkonen, Tienvieri and Vadén2010). The projects assessed here remain of small volume and complexity compared to industrial practice. At the other end of the complexity range, product development projects in the automotive industry may record over 20.000 CAD file changes per month (Audi, personal communication), which is more than two times the number of file changes recorded along the entire course of the most active project considered here. The ability of OSSD projects to scale up above the number of contributors reachable by closed development settings is not reproduced in OSPD. However, it should be noted that OSH is a young phenomenon. The results presented in this paper tend to show an increase in the activity volume between 2012 and 2018, which allow prognosticating an increased relevance of this new form of product development in the future years.
6.2 For deeper investigations
The results presented above are bound to some limitations related to the adopted investigation methods. The largest of these is that GitHub does not capture all product development activity happening in a project. Just because no activity is observable does not mean it does not exist. The metadata extracted from GitHub delivers only a very partial view on existing processes. Nonetheless, it shades light on some part of the development activity and already allows drawing some insights.
To consider a committed file change as the minimal unit of design activity is a strong assumption, as GitHub users may deal with commits in different ways. Some users may prefer to commit every single change whereas others would commit only at important milestones. Consequently, one commit may mark the completion of either a small or a large design effort and capture only one file change where the user locally performed a series of unrecorded edition steps. Therefore, using the number of file changes as a proxy value to the volume of activity is definitely not free from bias. Nonetheless, a committed file change is an event of smaller scale than a commit, which can bundle one to many file changes. The file change is therefore a more precise unit than the commit – a commonly considered unit in the literature. Options to refine this unit can be considered in further research. One is to weigh a file change by the volume of data (in Bytes) it affects. GitHub tracks records of this information, which can be easily accessed. Doing so would however imply that design effort is proportional to the volume of affected data, or that the volume of information is in relation with the volume of data coding it. But this relation may vary greatly between file types. For example, information is coded in software source files quite efficiently while some CAD format, especially mesh formats, may be more bulky. Another option is to go beyond the mere consideration of metadata and to investigate the data affected by a file change, for example, to trace the features of a CAD file affected by a series of file changes. Generally, this raises the question of quantifying design effort and progress – a fundamental question which largely exceeds the scope of this paper.
Considering the subsequent edition of a file by two contributors as the minimal unit of observable collaboration may also introduce a negative bias. Indeed, GitHub users may collaborate online and offline in many other ways than editing the same file. While some of these interactions may be captured by GitHub (e.g., the discussion of issues in the integrated issue tracking system, as in Meneely, Corcoran & Williams Reference Meneely, Corcoran and Williams2010) some others are not (personal contacts outside of GitHub). Considering the edition of a common file as a mark of collaboration implies therefore a very conservative assessment of collaboration patterns. Further works may seek to consider data reflecting the different ways to engage in an OSPD project.
The topological indicators computed on the file co-edition networks neither take into account the weight of the nodes nor those of the edges. These weights respectively reflect the number of file changes committed by a contributor and the number of interactions happening between two contributors. The topological indicators are only based on the existence of links between contributors, but not their relative importance, which may deliver a distorted view of the interactions happening in these projects. Further works may focus on the application of topological indicators which are able to take these aspects into account. The work provided by Wu et al. (Reference Wu, Rosen, Panchal and Schaefer2015) to calculate tie strength between project contributors is an interesting way to go.
Finally, the representativeness of the results may be limited due to two aspects. First, no claim of exhaustiveness can be claimed regarding the results of the snowball research performed to discover OSH projects. Nonetheless, this research has been performed over a long period and systematically exhausted all information sources known by the authors. The latter are therefore confident that a significant share of the field of OSH has been covered. Second, more than the half of the discovered projects have been filtered according to whether they use GitHub. Because of this necessary but arbitrary filter, those of the results presented here which are related to population segmentation cannot strictly be considered as representative for the whole field of OSH. This is the case for the relative volume of activity related to the development of software and hardware components as well as the relative importance of OSPD and public innovation in OSH. Other results are not affected by representativeness issues, since they are solely related to population volumes and not to their segmentation.
7 Conclusions
The present article was dedicated to the investigation of participative development practices in the field of OSH – practices we termed OSPD. It reported the application of repository mining techniques to investigate the volume of observable hardware development activity and the distribution of workload in 105 OSH development projects. The results pictured OSH development as a heterogeneous field filling a continuum between OSPD and public innovation practices, between lively communities of contributors and dormant projects. OSPD practice themselves have been found to follow diverse organizational patterns with different levels of centralization and work distribution, hence revealing different internal governance policies. Beyond this mixed picture, this article brought significant and large-scale evidence of the expansion of the open source development model from software into the realms of physical products – a phenomenon that has only be reported through anecdotal examples so far. It showed that distributed collaboration is not confined to the software components or documentation of OSH products but also applies to their physical components.
From a methodological point of view, this article discussed the great opportunity provided by the unrestricted availability of versioned product development data, which delivers unpreceded possibilities of investigation. It reported the first application of repository mining techniques to the context of engineering design and publicly available hardware development data. The discussion of the achieved results signposts promising research avenues and raises theoretical questions of general interest in design science and outside the field of OSH. Together with clear categories to delineate practices in OSH, data acquisition techniques and the reference to over 200 OSH projects, this article provides the necessary background to conduct deeper studies aiming at understanding stakeholder interactions at work in new product innovation practices.
Acknowledgments
The reported research has been performed in the frame of the French–German interdisciplinary research project ‘Open! – Methods and tools for community-based product development’. It is jointly funded by the French and German national science agencies ANR (Agence Nationale de la Recherche, grant ANR-15-CE26-0012) and DFG (Deutsche Forschungsgemeinschaft, grant STA 1112/13-1). The authors would like thank the anonymous reviewers for their insightful suggestions and constructive feedback. Last but not least, they would like to acknowledge Kerstin Carola Schmidt and Jonas Massmann for their contributions to the data collection, processing and assessment processes.
All data supporting this study are provided as supplementary information accompanying this paper or can be reproduced with the help thereof. The references of all investigated repositories are provided as supplementary material. The scripts used to extract the metadata relative to those repositories have been published under an OSS licence. The datasets analysed in this paper can be reproduced by applying the scripts to the repository references.
Conflicts of interest
The authors volunteer in three of the OSPD projects analysed in this article. They draw no financial benefit from this participation, so they declare having no conflict of interest.


