Most epidemiologists trace the origins of obesity back in the 1970s(Reference Pedersen, Ekstrøm and Sørensen1); during that time, it was mostly confined to developed countries(Reference Al-Worafi, Ming and Dhabali2,Reference Boutari and Mantzoros3) . Very recently, obesity significantly spanned in developing countries(Reference Friedrich4–Reference Popkin, Adair and Ng6). In the 2000s, the WHO recognised obesity as a global epidemic(Reference Caballero7) because of its interlinkages with non-communicable diseases (NCD). Recent estimates indicated that 1·5 billion of adults aged 20 years and above were overweight; among them, over 200 million of men and 300 million of women were obese(Reference Ng, Fleming and Robinson5). Previous studies showed strong variations of obesity across regions and countries, with sub-Saharan Africa (SSA) being the less affected region(Reference Haslam and James8).
Research has established a relationship between maternal age and maternal obesity(Reference Dudenhausen, Kunze and Wittwer-Backofen9); however, this relationship is not well documented in developing countries. There are plausible reasons to suggest that maternal obesity may increase with age. First, studies consistently showed that women gain weight during pregnancies(Reference Sun, Zhang and Chen10–Reference Abu Hamad, Abed and Abu Hamad12) and weight gain persists after deliveries. Second, parity increases with maternal age, making weight gain more likely. According to 2022 Global Nutrition Report(13), even though the prevalence of obesity is lower than the regional averages (20·8 % for women and 9·2 % for men), a sizeable percentage of people aged 18 years and over in Democratic Republic of the Congo (DRC) are living with obesity (11·6 % and 4·5 % of women and men, respectively). Furthermore, evidence indicated that the prevalence of overweight among adult aged 18 years and over increased from 18·8 % to 20·6 % between 2010 and 2014, while the prevalence of obesity rose from 3·7 % to 4·4 % during the same period. These figures, however, mask regional and local disparities of obesity(Reference Mapatano, Muyer and Buntinx14–Reference Mbala, Mbangi and Nkodila16). For instance, a localised study among a mine-based workforce showed that the prevalence of obesity increased from 4·5 % to 11·1 %(Reference Mawaw, Yav and Mukuku15). Therefore, the first objective of this paper is to estimate the probabilities of maternal nutritional status using BMI and adopting a sub-national perspective and emphasising urban–rural differences and poverty effects.
Although evidence showed that under-five mortality (U5M) rates in DRC has declined from 186 p. 1000 in early 1990s to 81 p. 1000 in 2020(Reference You, Jones and Hill17,Reference Schedwin, Furaha and Kapend18) , there still are provincial disparities in the country(Reference Kandala, Emina and Nzita19). In spite of the decline of U5M, DRC accounts for 11 % of annual deaths of children under 5 years in SSA(Reference Schedwin, Furaha and Kapend18). Previous research has identified several factors at different layers (child, maternal and community levels) associated with U5M(Reference Bhusal and Khanal20), including maternal obesity(Reference Aviram, Hod and Yogev11,Reference Abu Hamad, Abed and Abu Hamad12,Reference Aune, Saugstad and Henriksen21–Reference Chen, Feresu and Fernandez25) . Consequences of maternal obesity of child health outcomes include preterm births(Reference Cnattingius, Villamor and Johansson26): fetal deaths, stillbirths and infant deaths(Reference Abu Hamad, Abed and Abu Hamad12,Reference Aune, Saugstad and Henriksen21,Reference Chen, Feresu and Fernandez25,Reference Baer, Yang and Berghella27,Reference Gaillard, Durmuş and Hofman28) . Yet, this relationship is poorly documented in developing countries, including DRC. Since maternal obesity is alarmingly increasing in developing countries, and child health is still poor in these settings, it is crucial to scrutinise the relationship between maternal obesity and pregnancy and child health outcomes. Therefore, the second objective of the paper is to unpack the relationship between maternal obesity and child mortality at national and sub-national levels.
Methods
Data source
The paper utilises data from the 2013–2014 Demographic and Health Surveys (DHS) conducted in the Democratic Republic of Congo. DHS are nationally representative surveys, using a two-stage sampling design, which collected information on households, women and men of reproductive ages, anthropometric measures, contraception and family planning, among others. All men and women aged 15–59 and 15–49 years, respectively, in the selected households were eligible to participate in the survey if they were either usual residents of the household or visitors present in the household on the night before the survey. This paper reports on findings from women of reproductive ages in the individual record files.
Analyses are restricted to women for whom BMI was collected (see Fig. 1). Likewise, analyses for child health outcomes are restricted to children from women with valid information on BMI.
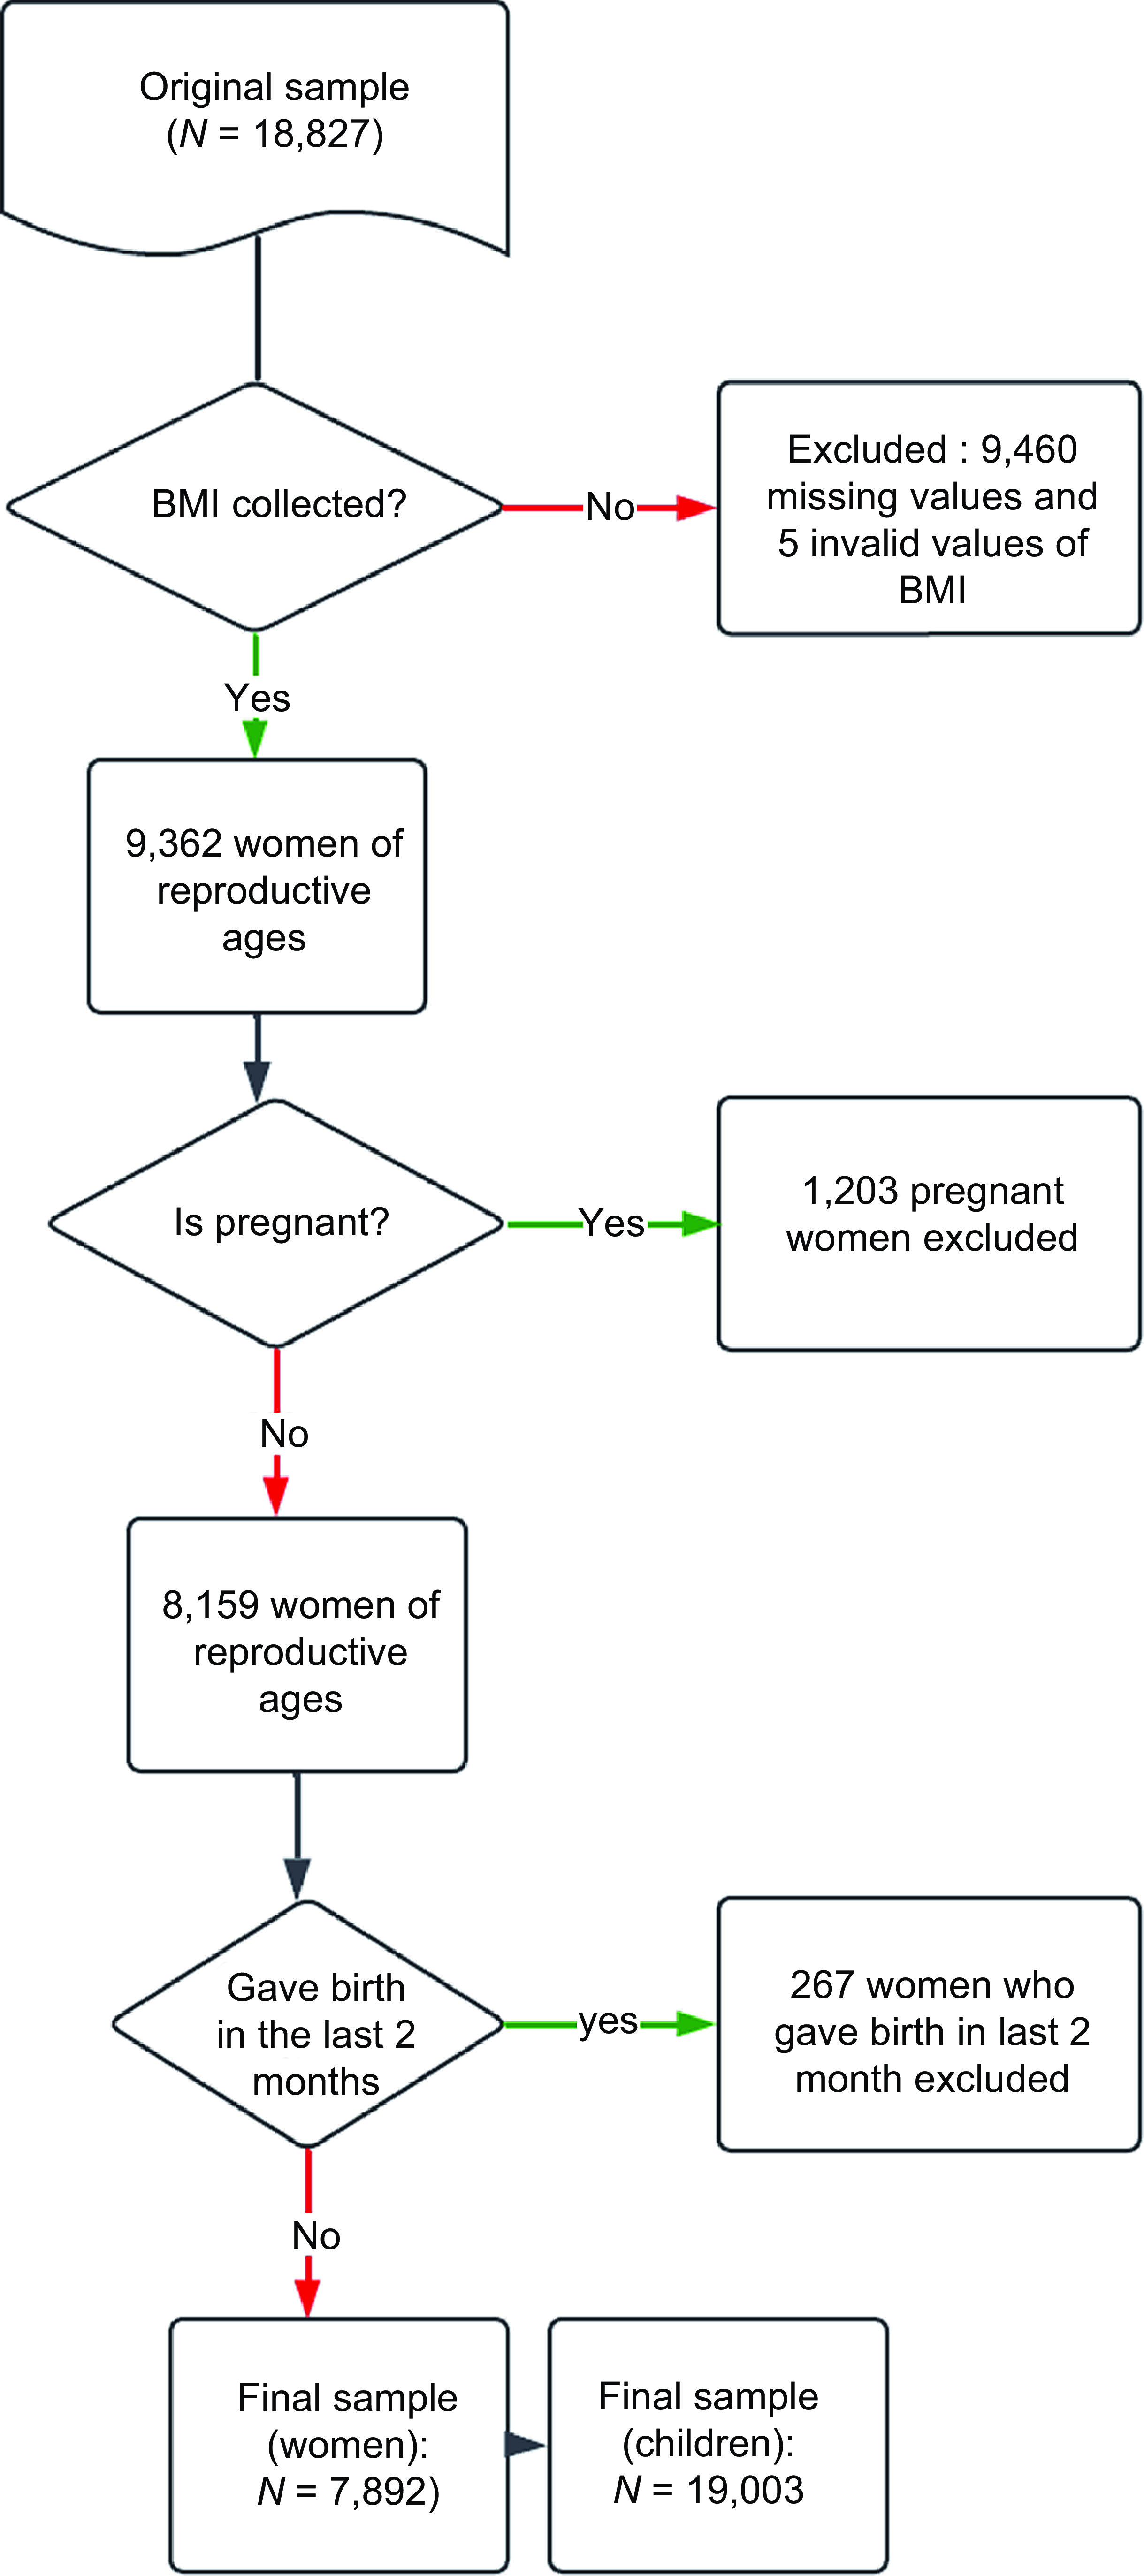
Figure 1. Selection of the final sample.
Ethics statement
Ethical approvals were obtained from the national ethics committees of DRC before the surveys were conducted. Written informed consent was obtained from every participant before she/he was allowed to take part in the survey. Consent was obtained from parents before their children’s measurements were taken. The DHS Program in the USA granted the authors permission to use the data. The data were completely anonymous; therefore, the authors did not seek further ethical clearance at the university since the data are publicly available at https://dhsprogram.com/data/available-datasets.cfm.
Variables measurement
Outcomes
Maternal nutritional status
To estimate the prevalence of overweight and obesity among women of reproductive ages, original information was obtained from the BMI derived from results of height and weight measurements. Trained field technicians collected the height and weight using standard techniques(Reference Pullum29). Using electronic Seca scales with a digital screen, women’s weight were measured, while height measurements were taken using a stadiometer produced by Shorr Productions. BMI, referred to as Quetelet’s Index(Reference Eknoyan30), was derived by dividing weight in kilograms by the squared height in metres. Based on the BMI (
![]() ${\rm{Kg}}/{{\rm{m}}^2}$
) estimates, and according to WHO guidelines for SSA, the participants were classified as underweight (BMI < 18·50
${\rm{Kg}}/{{\rm{m}}^2}$
) estimates, and according to WHO guidelines for SSA, the participants were classified as underweight (BMI < 18·50
![]() ${\rm{Kg}}/{{\rm{m}}^2}$
), normal weight (18·50–24·99
${\rm{Kg}}/{{\rm{m}}^2}$
), normal weight (18·50–24·99
![]() ${\rm{Kg}}/{{\rm{m}}^2}$
), overweight (25·0–29·9
${\rm{Kg}}/{{\rm{m}}^2}$
), overweight (25·0–29·9
![]() ${\rm{Kg}}/{{\rm{m}}^2}$
) and obese (>= 30·0
${\rm{Kg}}/{{\rm{m}}^2}$
) and obese (>= 30·0
![]() ${\rm{Kg}}/{{\rm{m}}^2}$
). Preliminary analyses showed that obesity was marginal in the DRC. Therefore, and to avoid instability of statistical models, overweight and obesity were grouped in the category overweight/obesity, resulting into three categories. The normal weight (18·50–24·99
${\rm{Kg}}/{{\rm{m}}^2}$
). Preliminary analyses showed that obesity was marginal in the DRC. Therefore, and to avoid instability of statistical models, overweight and obesity were grouped in the category overweight/obesity, resulting into three categories. The normal weight (18·50–24·99
![]() ${\rm{Kg}}/{{\rm{m}}^2}$
) was used as reference category in the analysis.
${\rm{Kg}}/{{\rm{m}}^2}$
) was used as reference category in the analysis.
Child health outcomes
Previous literature has extensively documented the relationship between maternal nutritional status, referred to as maternal overweight/obesity and child health outcomes(Reference Aviram, Hod and Yogev11,Reference Abu Hamad, Abed and Abu Hamad12,Reference Aune, Saugstad and Henriksen21–Reference Briese, Voigt and Hermanussen24) . This paper is interested in the associations between maternal overweight/obesity and (i) neonatal mortality; (ii) post-neonatal mortality; (iii) infant mortality; (iv) childhood mortality and (v.) under-five mortality. All these indicators have been linked to development levels worldwide(Reference Ezbakhe and Pérez-Foguet31) with developing countries experiencing higher levels of child mortality compared with developed countries(Reference Hanmer, Lensink and White32,Reference O’Hare, Makuta and Chiwaula33) .
DHS collect information about age at death for deceased children. This information was used to classify the period of child deaths for deceased children. All these variables are binary, indicating whether a child has deceased in a specific age interval. These include:
-
Neonatal mortality (nn): The risk of dying before birth and first month.
-
Post-neonatal mortality (pnn): The risk of dying between first month and 11 months, contingent to surviving the first month.
-
Infant mortality (IM): The risk of dying between birth and 11 months.
-
Childhood mortality ( ${n_{1 - 5}}$
): The risk of dying between first year and before 5 years, for children who survived till the first anniversary.
 -
Under-five mortality (U5M): The risk of dying between birth and the fifth birthday.
Key independent variables
In this paper, two set of independent variables, selected from existing literature, were used to estimate the associations between maternal nutritional status and child health outcomes. Given the nature of analyses, the unit of analysis was different for each set of estimations. For maternal nutritional status, woman was the unit of analysis while child was the unit of analysis to estimate the associations between maternal nutritional status and child mortality.
Maternal overweight/obesity
To estimate maternal nutritional status, the predictors used in the analysis included women’s age and education, working status at the time of survey, breast-feeding status, marital status, sex of the head of household, household wealth index, place of residence and province of residence. The original variable household wealth index has five categories (poorest, poor, middle, rich and richest). In this study, this variable was recorded into two categories: poor (poorest and poor) and non-poor households.
Child health outcomes
The predictors of interest to estimate the risk of dying in a specific age interval included maternal nutritional status as key independent variable, controlling for sex of the child, pregnancy outcome (child is singleton), birth order, women’s age and education, parity, working status, sex of head of household, household wealth index, place of residence and province of residence.
Analytical strategy
Maternal nutritional status
The paper used multinomial logistic regression (MLR) to estimate the probabilities of women’s nutritional status. MLR approach is appropriate since the outcome measure is polychotomous. Further, MLR was considered attractive analytical technique because it does not assume normality, linearity or homoscedasticity(Reference Starkweather and Moske34). In MLR, vectors
![]() $Y = \left( {{y_1},{y_2},...,{y_{k + 1}}} \right)$
are observed for the dependent variable;
$Y = \left( {{y_1},{y_2},...,{y_{k + 1}}} \right)$
are observed for the dependent variable;
![]() ${y_i} = 0$
for all
${y_i} = 0$
for all
![]() $i$
, and one
$i$
, and one
![]() $j$
with
$j$
with
![]() ${y_j} = 1$
, and corresponding probability
${y_j} = 1$
, and corresponding probability
![]() ${p_j}$
. The MLR is given by:
${p_j}$
. The MLR is given by:
 $${p_i} = {{exp\left( {{\pi ^{{{\left( i \right)}^ \top }}}} \right)} \over {1 + \mathop \sum \nolimits_{j = 1}^k exp\left( {{\pi ^{{{\left( i \right)}^ \top }}}} \right)}}\,\,\,{\rm{for\;i\; = \;1,\;2,\;}}...{\rm{,\;k}}$$
and
where
![]() $x = {\left( {{x_1},{x_2},...,{x_m}} \right)^ \top }$
is the vector of covariates and
$x = {\left( {{x_1},{x_2},...,{x_m}} \right)^ \top }$
is the vector of covariates and
![]() ${\pi ^{\left( i \right)}}$
is the parameter vector corresponding to the i-th response category. In equation (2), the parameters set to zero and allows computing the probability for the base category in the MLR. The MLR model was performed to investigate the relationship between maternal age at the time of survey and nutritional status, controlling for other relevant variables. Using a BMI category of 18.5–24.99
${\pi ^{\left( i \right)}}$
is the parameter vector corresponding to the i-th response category. In equation (2), the parameters set to zero and allows computing the probability for the base category in the MLR. The MLR model was performed to investigate the relationship between maternal age at the time of survey and nutritional status, controlling for other relevant variables. Using a BMI category of 18.5–24.99
![]() ${\rm{Kg}}/{{\rm{m}}^2}$
(normal weight) as the reference category, a set of logistic regressions for underweight and overweight/obese were estimated. All covariates were simultaneously entered into the model. Results were presented in the form of coefficients with significance levels and 95 % CI.
${\rm{Kg}}/{{\rm{m}}^2}$
(normal weight) as the reference category, a set of logistic regressions for underweight and overweight/obese were estimated. All covariates were simultaneously entered into the model. Results were presented in the form of coefficients with significance levels and 95 % CI.
Child mortality. In this paper, the indicators pertaining to child health outcomes were all defined as binary outcomes. In a previous study, scholars used linear probability model (LPM) to estimate the effects of dying before the first anniversary(Reference Pongou, Kuate Defo and Tsala Dimbuene35). Although this statistical technique leads to easy interpretation, it does not account for the non-linearity of the events; yet, demographic research has clearly pointed out to this issue(Reference Sharrow, Hug and You36). Therefore, generalised linear models (GLM) were used in this paper to account for non-linearity of the outcomes. In GLM, outcomes (
![]() $Y$
) are assumed to be generated from a distribution belonging to a large family of exponential distributions. Under this assumption, the conditional mean
$Y$
) are assumed to be generated from a distribution belonging to a large family of exponential distributions. Under this assumption, the conditional mean
![]() $\mu $
of the distribution of the outcomes depends on the independent variables
$\mu $
of the distribution of the outcomes depends on the independent variables
![]() $X$
as follows:
$X$
as follows:
Compared with the standard linear model, GLM have the following advantages: (i) dropping the normality requirements; (ii) relaxing the homoscedasticity assumption and (iii) allowing for some function of
![]() $E\left( Y \right)$
to be linear in the parameters as a link
$E\left( Y \right)$
to be linear in the parameters as a link
![]() $g\left( . \right)$
.
$g\left( . \right)$
.
Specifically, estimations in this paper were performed using the family binomial and logit as the link function in STATA 18 SE. Additionally, the number of iterations was increased using the option
![]() $iter\left( {100} \right)$
to improve the stability of the models.
$iter\left( {100} \right)$
to improve the stability of the models.
Results
Descriptive results
Tables 1–3 present descriptive results for samples of women of reproductive ages (Tables 1 and 2) and children under age 5 years (Table 3), respectively. Findings indicate that, overall, 16 % of women of reproductive ages are overweight or obese (Table 1). A marginal percentage (result not shown) of them are obese (3·4 %). There are rationales to pay attention to geographical variations of maternal nutritional status given diet differences across provinces in the country. In this paper, Table 2 highlights the importance of geographical variations in analysing women’s weight. Clearly, women’s average weight varies by province, urban residence and household poverty levels. Indeed, the average weight of women of reproductive ages ranged from 48·5
![]() ${\rm{kg}}$
in Kongo Central to 61·3 kg in Kinshasa. Findings also showed rural–urban differences (51·1 kg v. 58·4 kg), differences by poverty levels, with women living in better-off households being heavier (on average: 56·2 kg) compared with their counterparts living in poor households (49·9 kg).
${\rm{kg}}$
in Kongo Central to 61·3 kg in Kinshasa. Findings also showed rural–urban differences (51·1 kg v. 58·4 kg), differences by poverty levels, with women living in better-off households being heavier (on average: 56·2 kg) compared with their counterparts living in poor households (49·9 kg).
Table 1. Descriptive statistics of the sample of women of reproductive ages
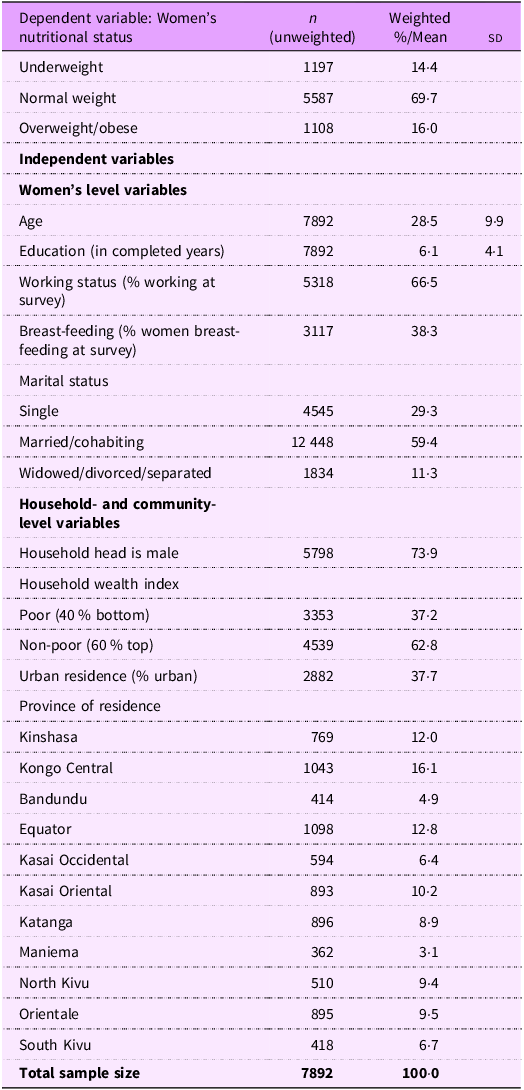
Table 2. Sub-national estimates of maternal nutritional status among women of reproductive ages: making a case for a geographical inquiry
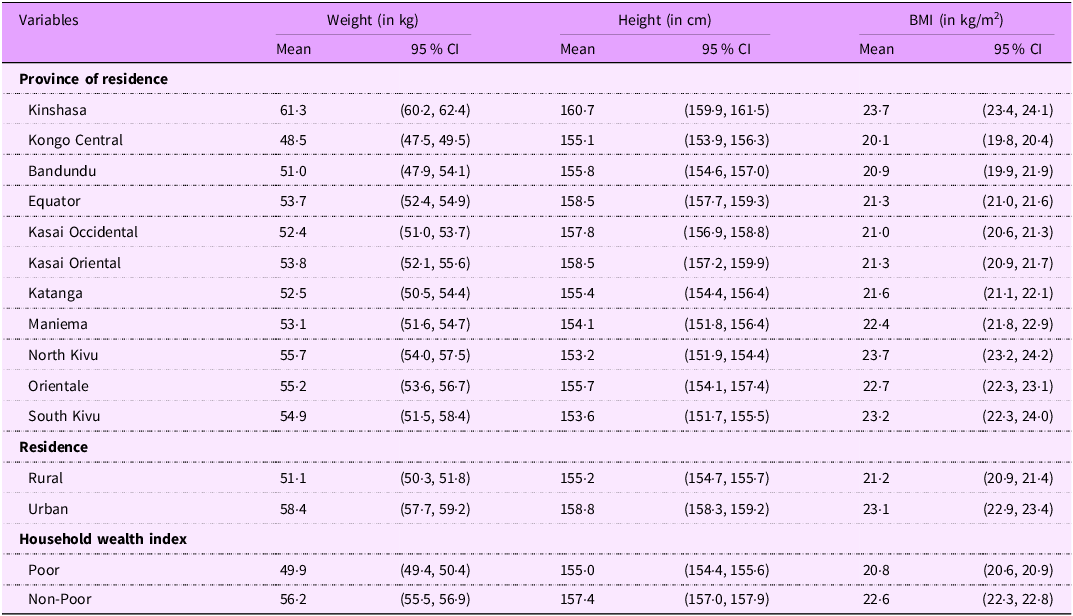
Table 3. Maternal nutritional status and child mortality in the Democratic Republic of the Congo

Regarding height, findings indicate that shortest women live in the provinces of North Kivu (average: 153·2 cm), South Kivu (average: 153·6 cm) and Maniema (average: 154·1 cm). In contrast, tallest women are found in Kinshasa, the Capital City, with an average of 160·7 cm. Similarly, findings indicate differences between rural and urban areas, as well as between poor and non-poor households. Finally, analyses of BMI showed that skinniest women lived in the province of Kongo Central (on average: 20·1 Kg/
![]() ${{\rm{m}}^2}$
). Again, women living in the provinces of North Kivu, South Kivu and Maniema recorded highest BMI, along with Kinshasa.
${{\rm{m}}^2}$
). Again, women living in the provinces of North Kivu, South Kivu and Maniema recorded highest BMI, along with Kinshasa.
Table 3 focuses on the associations between women’s nutritional status and child mortality. Figures in Table 3 are expressed in terms of number of deaths per 1000 live births. Findings indicate a clear gradient between maternal nutritional status and children health outcomes. Indeed, child health outcomes were worst among children born from underweight women compared with those born from overweight/obese women. However, these differences were not statistically significant. Neonatal mortality was higher among children born from underweight women (35·2 p. 1000) compared with those born from overweight/obese women (23·4 p.1000). Post-neonatal mortality rates were also higher among children born from underweight women (48·6 p.1000) compared with those from overweight/obese women (40·0 p.1000). Findings also that infant mortality rates were higher among children born from underweight women (82·0 p.1000) compared with those from overweight/obese women (62·5 p.1000). Likewise, childhood mortality rates were higher among children born from underweight women (50·7 p.1000) compared with those from overweight/obese women (49·2 p.1000). Finally, under-five mortality rates were higher among children born from underweight women (128·6 p.1000) compared with those from overweight/obese women (108·6 p.1000).
Multivariate results
Predicting maternal nutritional status
Figures 2 and 3 display the predicted probabilities of the nutritional status of women of reproductive ages in the Democratic Republic of Congo, based on a MLR of women’s observed nutritional status on age, while controlling for women’s education, working status, breast-feeding status, marital status, parity, sex of household head, household poverty, place of residence and provinces.

Figure 2. Predicted probabilities of women’s nutritional status at national and sub-national levels in the Democratic Republic of Congo.
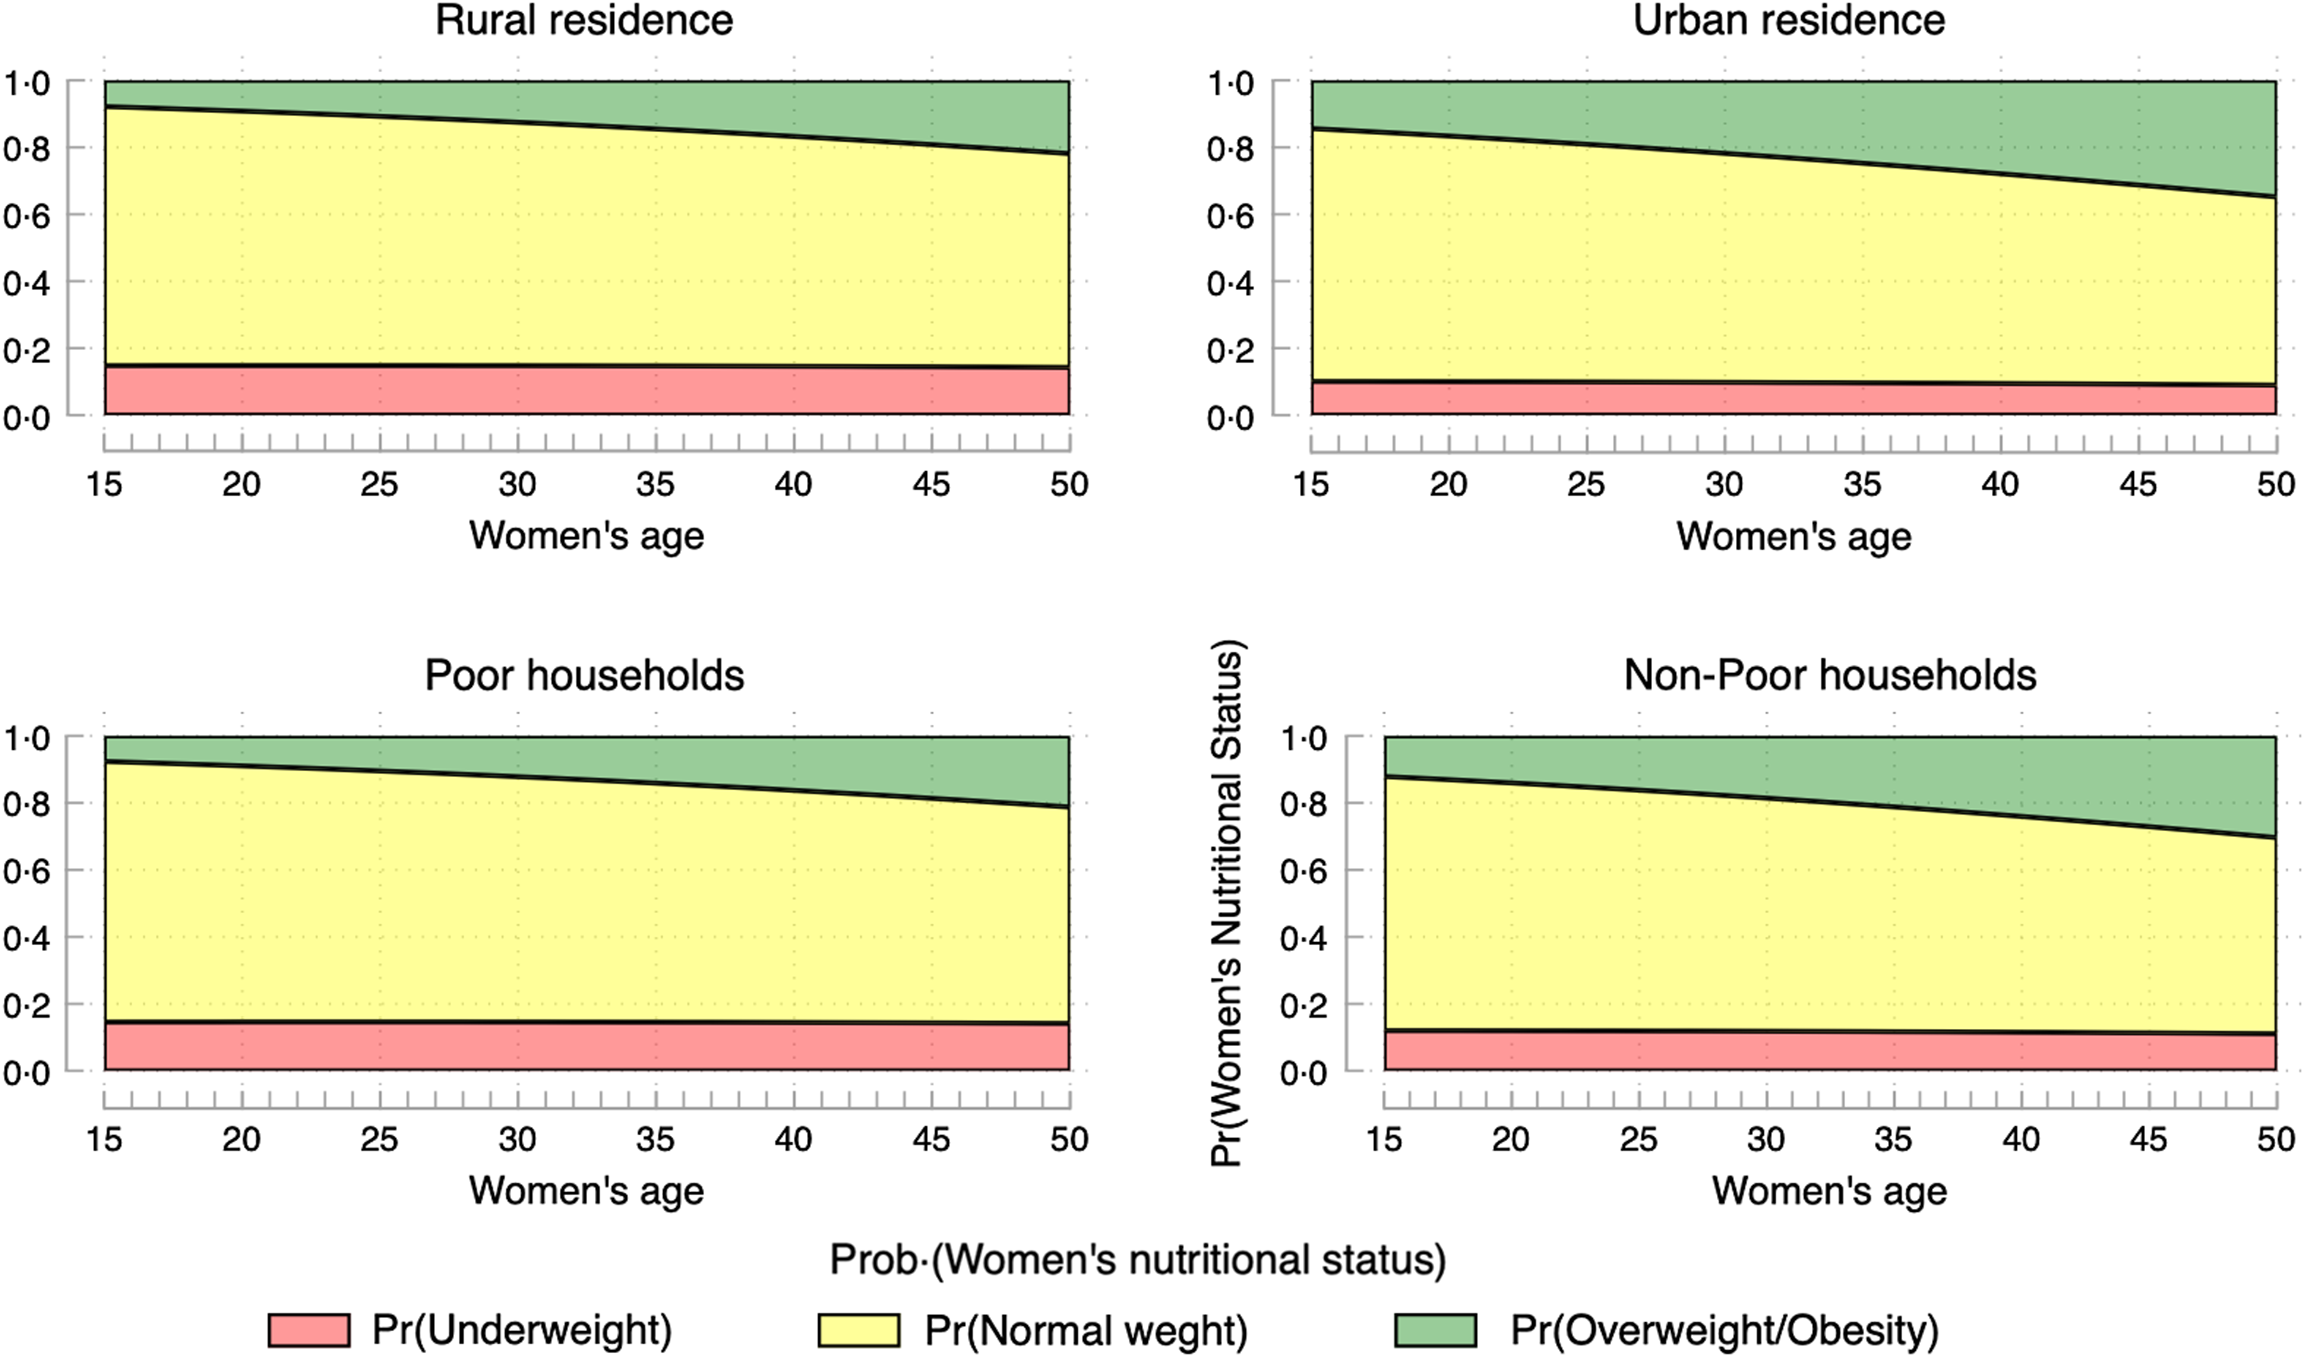
Figure 3. Predicted probabilities of women’s nutritional status in the Democratic Republic of Congo, by place of residence and household poverty levels.
When focusing on overweight/obesity only (Fig. 2), the following provinces are the most affected: North Kivu and South Kivu, Orientale, and to some extent, Kinshasa. Marginally, the provinces of Kasai oriental, Bandundu and Katanga are affected. Figure 3 shows that obesity is primarily concentrated in urban areas and among better-off households.
Associations between maternal nutritional status and child mortality
Figure 4 and Table 4 present the associations between women’s nutritional status (for the entire sample, and by household poverty levels and place of residence) and five child health outcomes, including neonatal mortality, post-neonatal mortality, infant mortality, child mortality, and under-five mortality, controlling for child-level variables (sex of the child, birth order and type of birth), woman-, household-, and community-level variables (age, education, parity, sex of household head, household poverty, place of residence and province).

Figure 4. Associations between women’s nutritional status and child mortality in the Democratic Republic of Congo.
Table 4. Maternal nutritional status and child mortality: entire sample, and by household poverty levels and place of residence
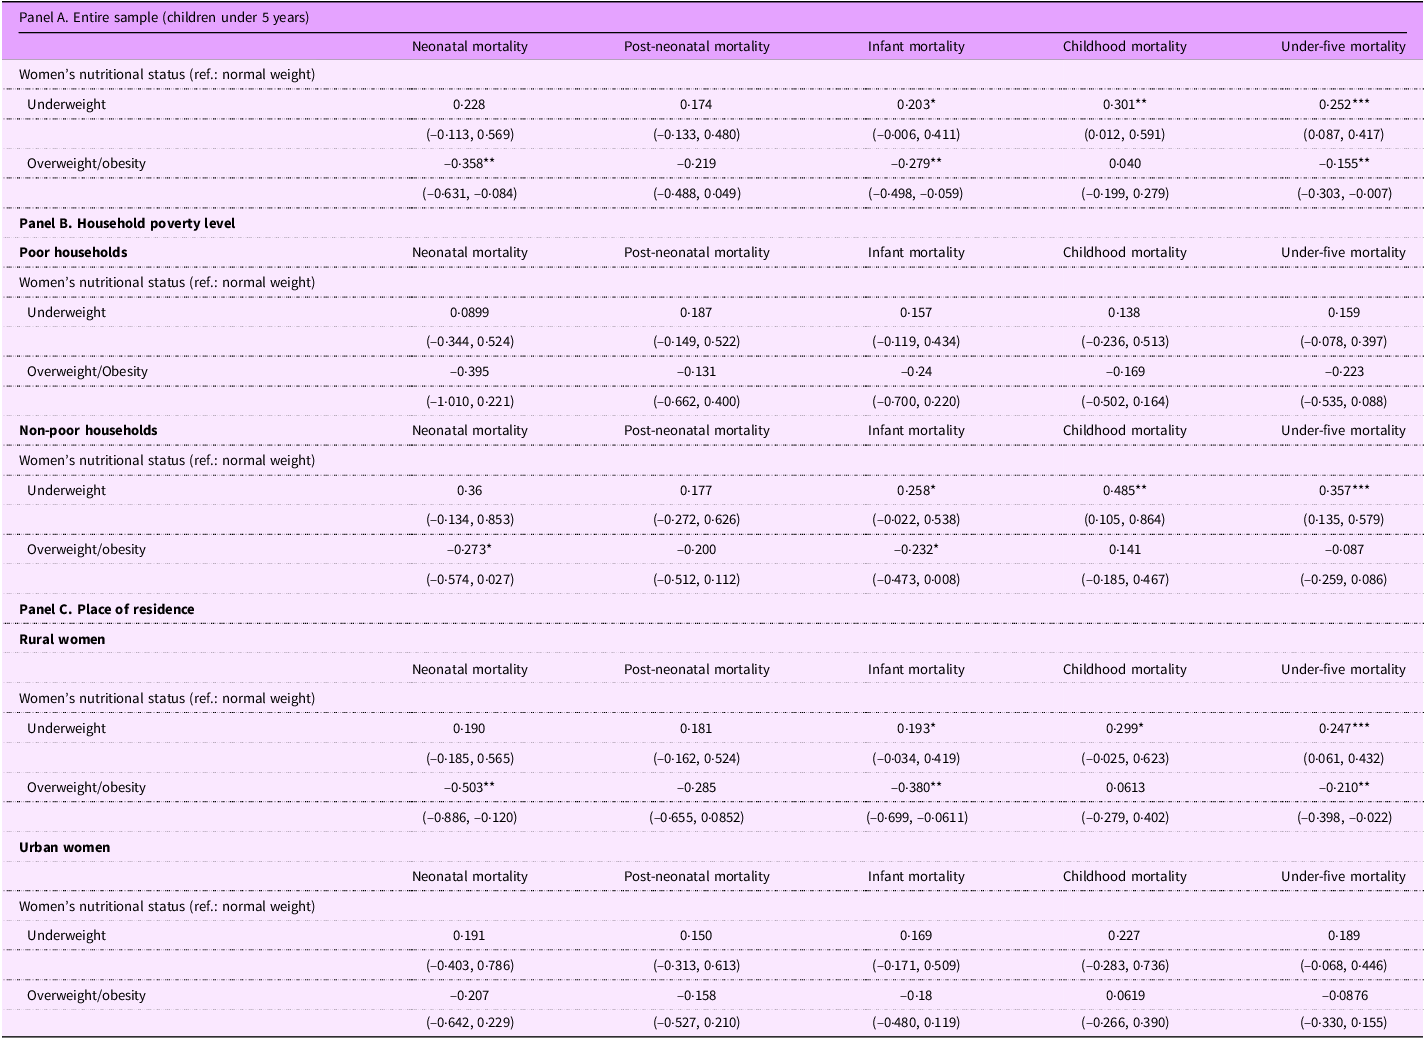
CI are in parentheses.
Statistical significance: ***P < 0.01, **P < 0.05, *P < 0.1.
Figure 4 confirms the absence of a clear gradient between maternal nutritional status and child health outcomes as aforementioned. For instance (see Table 4), underweight is positively associated with infant mortality (
![]() $\beta = 0.203;\;95\% {\rm{\;CI}}:\left( { - 0.006,\;0.449} \right)$
), childhood mortality (
$\beta = 0.203;\;95\% {\rm{\;CI}}:\left( { - 0.006,\;0.449} \right)$
), childhood mortality (
![]() $\beta = 0.301;\;95\% {\rm{\;CI}}:\left( {0.012,\;0.591} \right)$
) and U5M (
$\beta = 0.301;\;95\% {\rm{\;CI}}:\left( {0.012,\;0.591} \right)$
) and U5M (
![]() $\beta = 0.252;\;95\% {\rm{\;CI}}:\left( {0.087 - 0.417} \right)$
). Overweight/obesity is negatively associated with three child health outcomes, including neonatal mortality (
$\beta = 0.252;\;95\% {\rm{\;CI}}:\left( {0.087 - 0.417} \right)$
). Overweight/obesity is negatively associated with three child health outcomes, including neonatal mortality (
![]() $\beta = - 0.358;\;95\% {\rm{\;CI}}:\left( { - 0.631,\; - 0.084} \right)$
), infant mortality (
$\beta = - 0.358;\;95\% {\rm{\;CI}}:\left( { - 0.631,\; - 0.084} \right)$
), infant mortality (
![]() $\beta = - 0.279;\;95\% {\rm{\;CI}}:\left( { - 0.498,\; - 0.059} \right)$
) and under-five mortality (
$\beta = - 0.279;\;95\% {\rm{\;CI}}:\left( { - 0.498,\; - 0.059} \right)$
) and under-five mortality (
![]() $\beta = - 0.155;\;95\% {\rm{\;CI}}:\left( { - 0.303,\; - 0.007} \right)$
).
$\beta = - 0.155;\;95\% {\rm{\;CI}}:\left( { - 0.303,\; - 0.007} \right)$
).
When data are disaggregated by household poverty levels (see Table 4; Panel B), findings show that women’s nutritional status is not significantly associated with child health outcomes for poor households. In advantaged households, some associations between women’s nutritional status and child health outcomes reached statistical significance, mimicking the pattern in the entire sample. Indeed, underweight was positively associated with infant mortality (
![]() $\beta = 0.258;{\rm{\;}}95{\rm{\% \;CI}}:\left( { - 0.022,{\rm{\;}}0.538} \right)$
), childhood mortality (
$\beta = 0.258;{\rm{\;}}95{\rm{\% \;CI}}:\left( { - 0.022,{\rm{\;}}0.538} \right)$
), childhood mortality (
![]() $\beta = 0.485;\;95\% {\rm{\;CI}}:\left( {0.105,\;0.864} \right)$
) and under-five mortality (
$\beta = 0.485;\;95\% {\rm{\;CI}}:\left( {0.105,\;0.864} \right)$
) and under-five mortality (
![]() $\beta = 0.357;\;95\% {\rm{\;CI}}:\left( {0.135,\;0.579} \right)$
). Likewise, overweight/obesity was marginally negatively associated with neonatal mortality (
$\beta = 0.357;\;95\% {\rm{\;CI}}:\left( {0.135,\;0.579} \right)$
). Likewise, overweight/obesity was marginally negatively associated with neonatal mortality (
![]() $\beta = - 0.273;\;95\% {\rm{\;CI}}:\left( { - 0.574,\; - 0.027} \right)$
) and infant mortality (
$\beta = - 0.273;\;95\% {\rm{\;CI}}:\left( { - 0.574,\; - 0.027} \right)$
) and infant mortality (
![]() $\beta = - 0.232;\;95\% {\rm{\;CI}}:\left( { - 0.473,\; - 0.008} \right)$
).
$\beta = - 0.232;\;95\% {\rm{\;CI}}:\left( { - 0.473,\; - 0.008} \right)$
).
Looking into the associations between maternal nutritional status and child health outcomes by place of residence (Table 4; Panel C). Among rural women, underweight was positively associated, net of controls, with under-five mortality (
![]() $\beta = 0.247;95\% {\rm{\;CI}}:\left( {0.061,\;0.432} \right)$
) and marginally with infant mortality (
$\beta = 0.247;95\% {\rm{\;CI}}:\left( {0.061,\;0.432} \right)$
) and marginally with infant mortality (
![]() $\beta = 0.193;95\% {\rm{\;CI}}:\left( {0.034,\;0.419} \right)$
) and childhood mortality (
$\beta = 0.193;95\% {\rm{\;CI}}:\left( {0.034,\;0.419} \right)$
) and childhood mortality (
![]() $\beta = 0.299;95\% \;{\rm{CI}}:\left( { - 0.025,\;0.623} \right)$
). In contrast, overweight/obesity was negatively associated with neonatal mortality (
$\beta = 0.299;95\% \;{\rm{CI}}:\left( { - 0.025,\;0.623} \right)$
). In contrast, overweight/obesity was negatively associated with neonatal mortality (
![]() $\beta = - 0.503;95\% \;{\rm{CI}}:\left( { - 0.886,\; - 0.120} \right)$
), infant mortality (
$\beta = - 0.503;95\% \;{\rm{CI}}:\left( { - 0.886,\; - 0.120} \right)$
), infant mortality (
![]() $\beta = - 0.380;95\% {\rm{\;CI}}:\left( { - 0.699,\; - 0.061} \right)$
) and under-five mortality (
$\beta = - 0.380;95\% {\rm{\;CI}}:\left( { - 0.699,\; - 0.061} \right)$
) and under-five mortality (
![]() $\beta = - 0.210;95\% {\rm{\;CI}}:\left( { - 0.398,\; - 0.022} \right)$
). Among urban women, no significant associations are found between maternal nutritional status and child health outcomes.
$\beta = - 0.210;95\% {\rm{\;CI}}:\left( { - 0.398,\; - 0.022} \right)$
). Among urban women, no significant associations are found between maternal nutritional status and child health outcomes.
Geographical variations of the associations between maternal nutritional status and child health outcomes
Table 5 presents the associations between maternal nutritional status and child health outcomes by province of residence. Although Table 5 provides much more details, this section focuses on overweight/obesity. In Bandundu, findings indicated that maternal overweight/obesity was significantly and negatively associated with childhood mortality (
![]() $\beta = - 1.713;95\% {\rm{\;CI}}:\left( { - 3.144,\; - 0.283} \right)$
) and under-five mortality (
$\beta = - 1.713;95\% {\rm{\;CI}}:\left( { - 3.144,\; - 0.283} \right)$
) and under-five mortality (
![]() $\beta = - 0.822;95\% {\rm{\;CI}}:\left( { - 1.492,\; - 0.151} \right)$
). In Equator, being overweight/obese was significantly and positively associated with under-five mortality (
$\beta = - 0.822;95\% {\rm{\;CI}}:\left( { - 1.492,\; - 0.151} \right)$
). In Equator, being overweight/obese was significantly and positively associated with under-five mortality (
![]() $\beta = 0.320;95\% {\rm{\;CI}}:\left( {0.034,\;0.606} \right)$
). In contrast, being overweight/obese in North Kivu was significantly and negatively associated with under-five mortality (β = −0.608; 95% CI : (−1.202, −0.014))
$\beta = 0.320;95\% {\rm{\;CI}}:\left( {0.034,\;0.606} \right)$
). In contrast, being overweight/obese in North Kivu was significantly and negatively associated with under-five mortality (β = −0.608; 95% CI : (−1.202, −0.014))
Table 5. Maternal nutritional status and child mortality, sub-national estimates
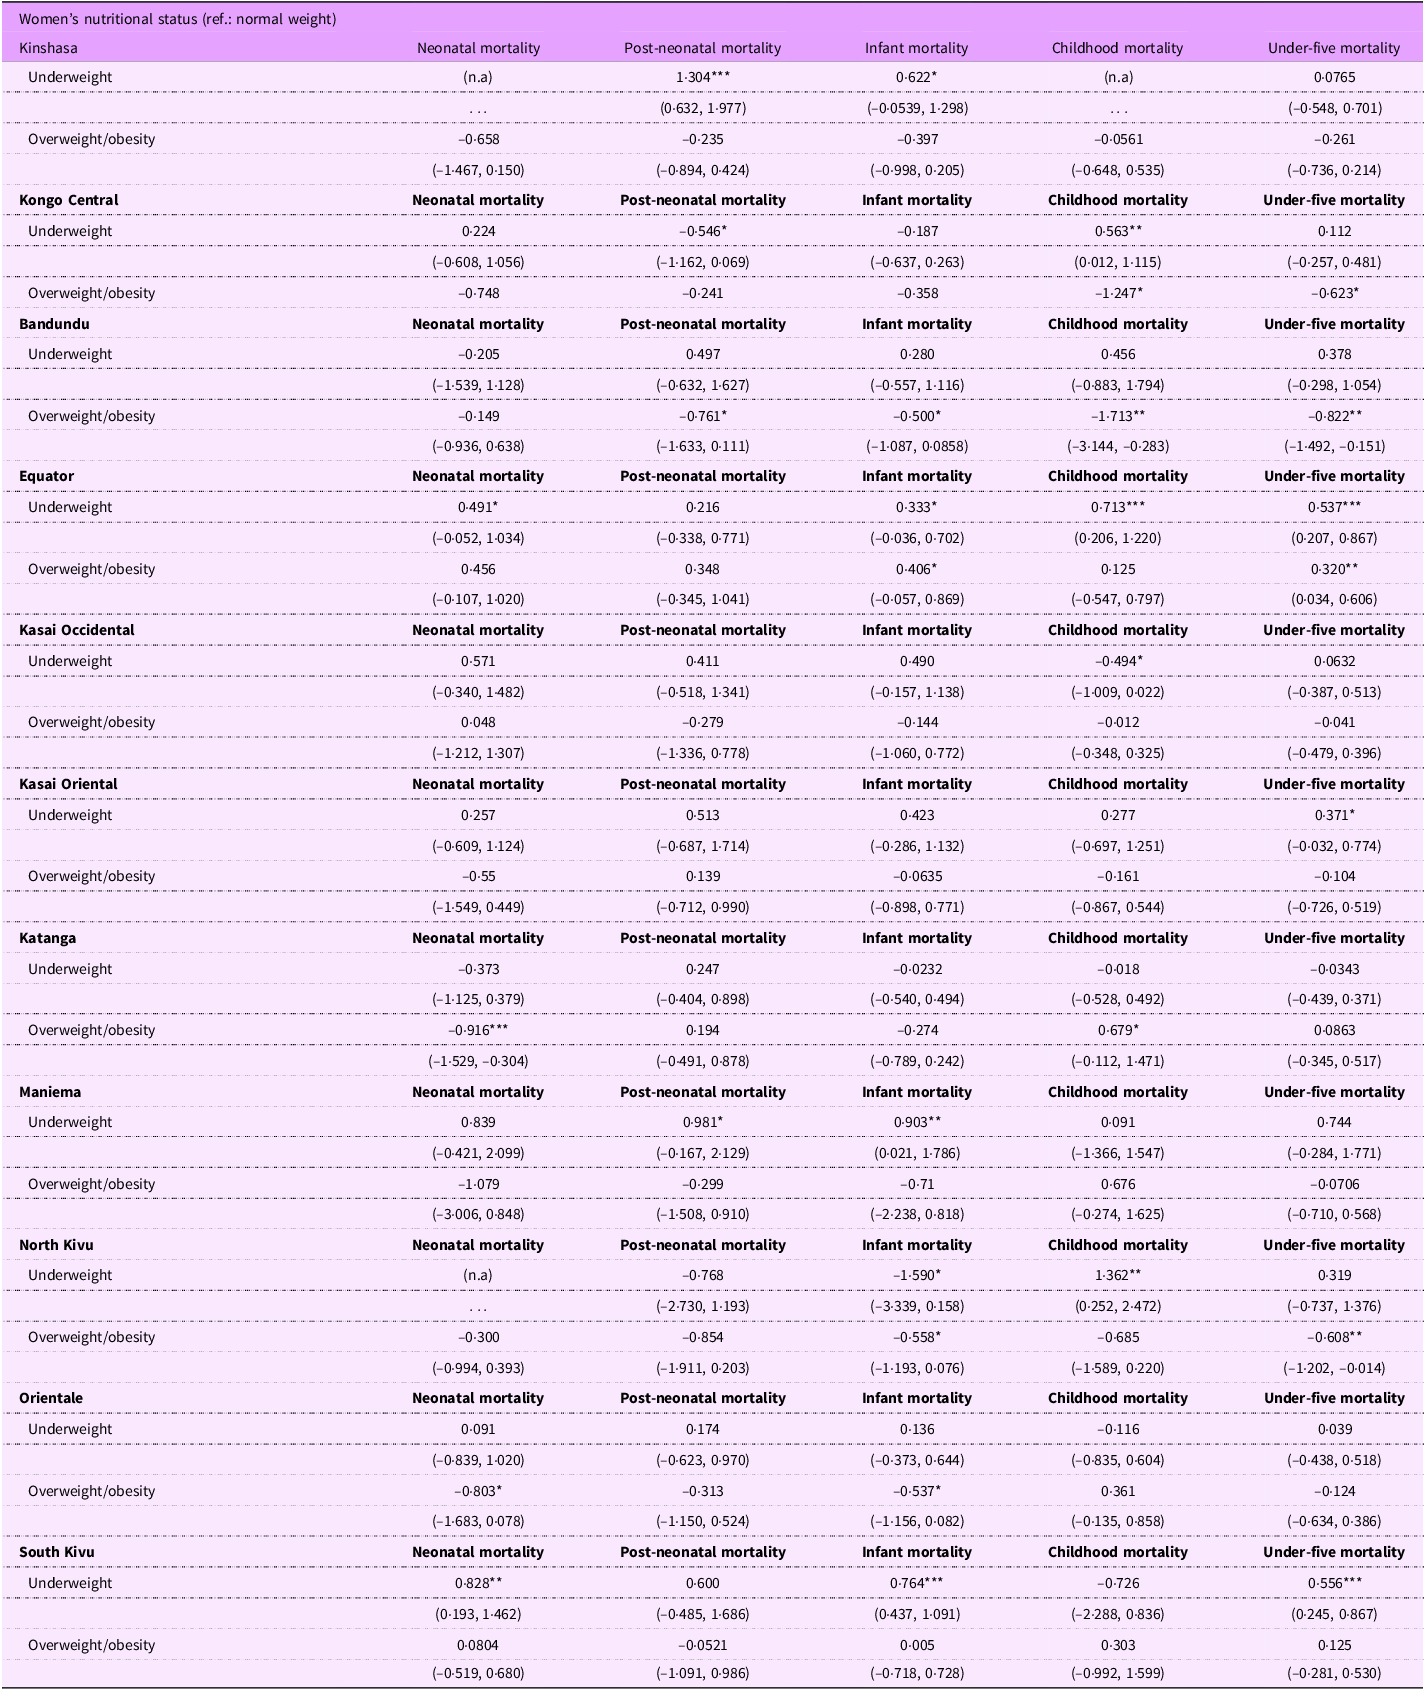
n.a.: Estimates not available due to small cell sizes.
CI are in parentheses.
Statistical significance: ***P < 0.01, **P < 0.05, *P < 0.1.
Discussion
The objectives of the paper are twofold. First, the study investigated the relationship between maternal age and maternal nutritional status, with a special attention on obesity in the Democratic Republic of Congo. Second, the paper was interested in the relationship between maternal nutritional status and child mortality assuming that children from obese mothers have worse outcomes compared with those born from non-obese mothers.
Main findings
Maternal age and nutritional status among women of reproductive ages
Findings from this paper showed that the likelihood of being obese among women of reproductive ages in the DRC increased with age, after controlling for women’s education, working status, breast-feeding status, marital status, parity, sex of household head, household poverty, place of residence and province. However, the percentage of obese women was marginal (3·4 %) and lower than reported in previous studies. For instance, a study reported that 13 % of adults aged 18 years and above were obese, and 39 % were overweight(Reference Lim, Xue and Wang37). Collapsing overweight and obesity brings up to 16 %; this percentage became comparable to figures reported in Uganda around 2011(Reference Amegbor, Yankey and Davies38) and SSA(Reference Agyemang, Boatemaa and Frempong39). The study in Uganda reported a prevalence of overweight/obesity of 19·4 % in 2011. Furthermore, obesity was more prevalent among women living in advantaged households(Reference Neupane, K. C. and Doku40). Explanations include the lifestyles and physical activity. Women from advantaged households have more access to processed foods; therefore, increasing their risks to be obese. Also, they do adopt a much more sedentary lifestyle. They do exercise less compared with women from poor households and rural areas. For instance, they have access to maids and personal drivers which significantly limit their opportunities to exercise. In contrast, women from disadvantaged households and rural areas have more opportunities to exercise due to financial constraints and lifestyle, therefore, decreasing the likelihood of being obese.
The paper highlighted geographical variations of women’s nutritional status in the Democratic Republic of Congo. Overall, all the eleven provinces are unevenly affected in terms of the prevalence of obesity. Some provinces (North Kivu, Orientale and South Kivu) and to some extent Kinshasa the Capital City are more affected. These inequalities will significantly impact the Sustainable Development Goals (SDG) related to obesity. SDG 2 and 3 focus on ending all forms of malnutrition (SDG 2) and NCD (SDG 3), particularly as the country grapples with inequalities in obesity prevalence. Therefore, the government should devise more effective programmes and interventions to tackle these inequalities to ensure that the country could reach SDG goals. Indeed, DRC has made limited progress towards achieving the diet-related NCD targets(Reference Schedwin, Furaha and Kapend18).
Figures reported here on overweight/obesity are lower than those found in more localised studies(Reference Mawaw, Yav and Mukuku41). In a baseline study on obesity, diabetes and hypertension among Tenke Fungurume Mining workforce, findings showed that prevalence of obesity increased from 4·5 % to 11·1 % between 2010 and 2015. Localized studies could uncover further disparities across provinces, highlighting the need for urgent action to address this pandemic and reduce the prevalence of NCD in the country.
Maternal nutritional status and child mortality
Previous studies have consistently reported that maternal obesity is positively and significantly with adverse pregnancy outcomes(Reference Aviram, Hod and Yogev11,Reference Briese, Voigt and Hermanussen24) and health risks during infancy(Reference Cnattingius, Villamor and Johansson26,Reference Onubi, Marais and Aucott42–Reference Gao, Peng and Xue45) . This study provided partial support of the associations between maternal obesity and child mortality. In the entire sample, maternal obesity was positively and significantly associated with childhood mortality. When data are disaggregated by province, urban residence and poverty levels, findings are more inconsistent compared with what has been reported in previous studies.
Two empirical explanations can be drawn from previous studies. First, previous have been undertaken in developed countries where obesity prevalence is alarmingly high and could lead to adverse pregnancy and child outcomes. Indeed, the average national prevalence of obesity in developed countries is estimated at 17 %(Reference Ng, Fleming and Robinson5). The corresponding figure in developing countries ranges between 6·8 % and 8·7 %(Reference Prentice46,Reference Bhurosy and Jeewon47) . In the current study, the prevalence of obesity among women of reproductive ages was very low. That can explain the poor and unstable relationship observed between maternal obesity and child obesity for the entire sample and disaggregated data. Second, the concentration of obesity among women of reproductive ages can be another plausible explanation. In developing countries and SSA, previous studies showed that the prevalence of obesity is low and concentrated among advantaged women(Reference Neupane, K. C. and Doku40).
Additionally, previous studies showed that child mortality is higher in poor households. Therefore, it might be a compensation effect concerning the associations between maternal obesity and child mortality. While one might expect maternal obesity to be associated with child mortality; being in better-off households provides with a buffer in the sense that those households provide children with good care when they are sick and therefore leads to lower risks of child mortality. This explanation is not definitive because the relationship between maternal obesity and child mortality is not widely documented in SSA. Some exceptions do exist(Reference Cresswell, Campbell and Silva48–Reference Nohr50). However, these studies mostly used pooled data, therefore, increasing statistical power of the estimates and masking differences within and across countries. The current study dug into geographical disparities in maternal obesity and how this might affect child mortality. With this approach, the paper provided insights to better devise national and local strategies to better tackle the double burden of nutrition in the country.
Study strengths and limitations
The paper used nationally representative data which yielded to robust estimates of the associations between maternal age and obesity on the one hand, and on the other hand, of the associations between maternal nutritional status and child mortality. Additionally, women’s height and weight data used to compute BMI were objectively measured, reducing possible misclassification. However, all women in the original sample were not included in the analyses because BMI was not collected. This reduced statistical power of modelling, especially at sub-national levels.
Conclusion and policy implications
The paper evidenced the disparities of overweight/obesity prevalence in the Democratic Republic of Congo. The consequences of overweight/obesity on population health are poorly documented developing countries, while it is alarmingly increasing in SSA. Therefore, more comprehensive and effective national and sub-national interventions to tackle overweight and obesity in the country are of chief importance to reach SDG 2 and 3. NCD have the potential to increase operational costs while decreasing productivity in the country and might bring additional pressure to health facilities.
Acknowledgements
The authors thank the DHS Program for the data used in this study.
Authorship
Z.T.D conceived and designed the study, interpreted the results, wrote the first draft of the manuscript and contributed to revision of the manuscript. Z.T.D. and S.M.M. analysed the data. Z.T.D., S.M.M. and R.M.N. contributed to study design, data interpretation and critical revision of the manuscript. All authors read and approved the final version, and they take responsibility for any issue that may arise from the publication of this manuscript.
Financial support
This research received no specific grant from any funding agency in the public, commercial or not-for-profit sectors.
Competing interests
The authors have no conflict of interest to declare.
Ethics of human subject participation
Ethical approvals were obtained from the national ethics committees of Democratic Republic of the Congo. Written informed consent was obtained from every participant before she/he was allowed to take part in the survey. Consent was obtained from parents before their children’s measurements were taken. The DHS Program in the USA granted the authors permission to use the data. The data were completely anonymous and publicly available at https://dhsprogram.com/data/available-datasets.cfm; therefore, the authors did not seek further ethical clearance.


