Eating behaviour problems in children have been linked to underweight and poor growth as well as to overweight and obesityReference Bryant-Waugh, Markham and Kreipe(1–Reference Mikkilä, Räsänen and Raitakari8). Eating behaviour has been divided into six areas: (i) satiety responsiveness; (ii) responsiveness to food cues; (iii) emotional eating; (iv) general interest in eating; (v) speed of eating; and (vi) food fussinessReference Wardle, Guthrie and Sanderson(2–Reference Tanofsky-Kraff, Ranzenhofer and Yanovski6).
It is known that eating behaviour is formed in the first years of life and that eating habits in adulthood are related to those learned in childhoodReference Mikkilä, Räsänen and Raitakari(8). These situations demonstrate the importance of investigating eating behaviour at early ages and suggest that actions aimed at promoting healthy eating habits should focus with greater emphasis on childrenReference Tanofsky-Kraff, Ranzenhofer and Yanovski(6–Reference Mikkilä, Räsänen and Raitakari8).
The Children’s Eating Behaviour Questionnaire (CEBQ) is one of the most widely used measures of eating behaviour in childrenReference Wardle, Guthrie and Sanderson(2). The CEBQ is designed to assess six aspects of children’s eating behaviour, with its eight subscales divided into two categories: ‘food approach’ and ‘food avoidant’ subscales. ‘Food approach’ subscales are: (i) Food Responsiveness (FR), which consists of items assessing appetite and an inclination towards appealing external food cues (i.e. external eating); (ii) Enjoyment of Food (EF), which also reflects a child’s appetite and interest in eating; (iii) Emotional Overeating (EOE), which taps into overeating in response to negative emotions (e.g. anger, sadness, anxiety and boredom); and (iv) Desire to Drink (DD), which assesses the need for frequent beverage or drink consumption. ‘Food avoidant’ subscales are: (v) Satiety Responsiveness (SR), consisting of items indicating that a child attends to internal cues of fullness and stops eating based on such perceived fullness; (vi) Slowness in Eating (SE), comprising items that assess a child’s speed of eating (e.g. taking a longer time to finish food or consume food); (vii) Emotional Undereating (EUE), which consists of items that describe undereating in response to different negative emotions; and (viii) Food Fussiness (FF), which consists of items reflecting a child being selective about foods eaten (e.g. picky eating or difficulty in pleasing a child with food)Reference Wardle, Guthrie and Sanderson(2).
The CEBQ was originally developed and validated in the UK, but translated versions of the CEBQ have also been validated in other, mainly high-income countriesReference Wardle, Guthrie and Sanderson(2, Reference Dos Passosa, Gigantea and Maciela3, Reference Sleddens, Kremers and Thijs5, Reference Svensson, Lundborg and Cao9–Reference Njardvik, Klar and Thorsdottir18). Previous studies using the CEBQ evaluated children from 1 to 13 years old, with the number of participants ranging from 135 to 1002Reference Wardle, Guthrie and Sanderson(2, Reference Dos Passosa, Gigantea and Maciela3, Reference Sleddens, Kremers and Thijs5, Reference Svensson, Lundborg and Cao9–Reference Njardvik, Klar and Thorsdottir18). Despite its widespread use and translation into several languages, the factor structure of the CEBQ has been a matter of debateReference Njardvik, Klar and Thorsdottir(18).
Until now, no studies have been conducted in Bosnia and Herzegovina or in our region using the CEBQ, nor have studies evaluating eating behaviour in relation to body weight status in children. The aim of the present study was to analyse the factorial nature of the CEBQ which was translated into Bosnian language (and used as a study tool); and to estimate the relationship between eating behaviour and weight status categories in a cohort of 3- to 10-year-old Bosnian and Herzegovina children, in order to identify specific eating styles that are associated with weight status and can be seen as important and modifiable determinants implicated in the development and maintenance of overweight/obesity as well as underweight.
Methods
A cross-sectional study was performed from September 2016 to September 2017 in pre-school institutions, primary health-care institutions and elementary schools in Tuzla Canton, in each of its thirteen municipalities. Tuzla Canton, as the most populated canton in Bosnia and Herzegovina, has about 500 000 citizens, out of which 30 000 are children aged 3–10 years. The study was conducted on a voluntary basis by children and parents with respect for ethical provisions of children and one parent’s anonymity, and was approved by the Ministry of Education, Science, Culture and Sport and the Ministry of Health of Tuzla Canton as well as the ethical advisory body from each pre-school institution, elementary school and health institution. Written informed consent was obtained from parents.
Study population
We randomly selected and visited one pre-school institution and one elementary school, as well as the primary health-care institution, in every municipality where we randomly selected pairs of children of appropriate age and one of the parents (mother or father). All parents were previously asked whether they wanted to participate in research with their children. Institutions were selected by the lottery method except the pre-school institution from five municipalities which had only one institution, which we visited. In each institution children of appropriate age were selected with random number tables (numbers were assigned by asking the correspondent person in each institution to make a list of children before our visit without previous knowledge for what it will be used). Every second child of appropriate age who came to health institutions for vaccination was recruited. All parents were asked if they already participated in the study so that they could be excluded if they had already been recruited in another recruitment place. Exclusion criteria were inborn or acquired deformities or any diagnosed chronic diseases in children. Prior to inclusion into the survey, parents were provided with appropriate information which explained the purpose, objectives and significance of the research. A questionnaire was handed over to all children or parents during our visits to pre-school institutions and elementary schools, when we took anthropometric measurements of children. The completed questionnaires were returned to the correspondent person in every institution and then we collected them in a second visit 7–15 d after that. Those participants included at health-care institutions answered items on the spot and handed the questionnaire over to the correspondent person, which we collected during our monthly visit.
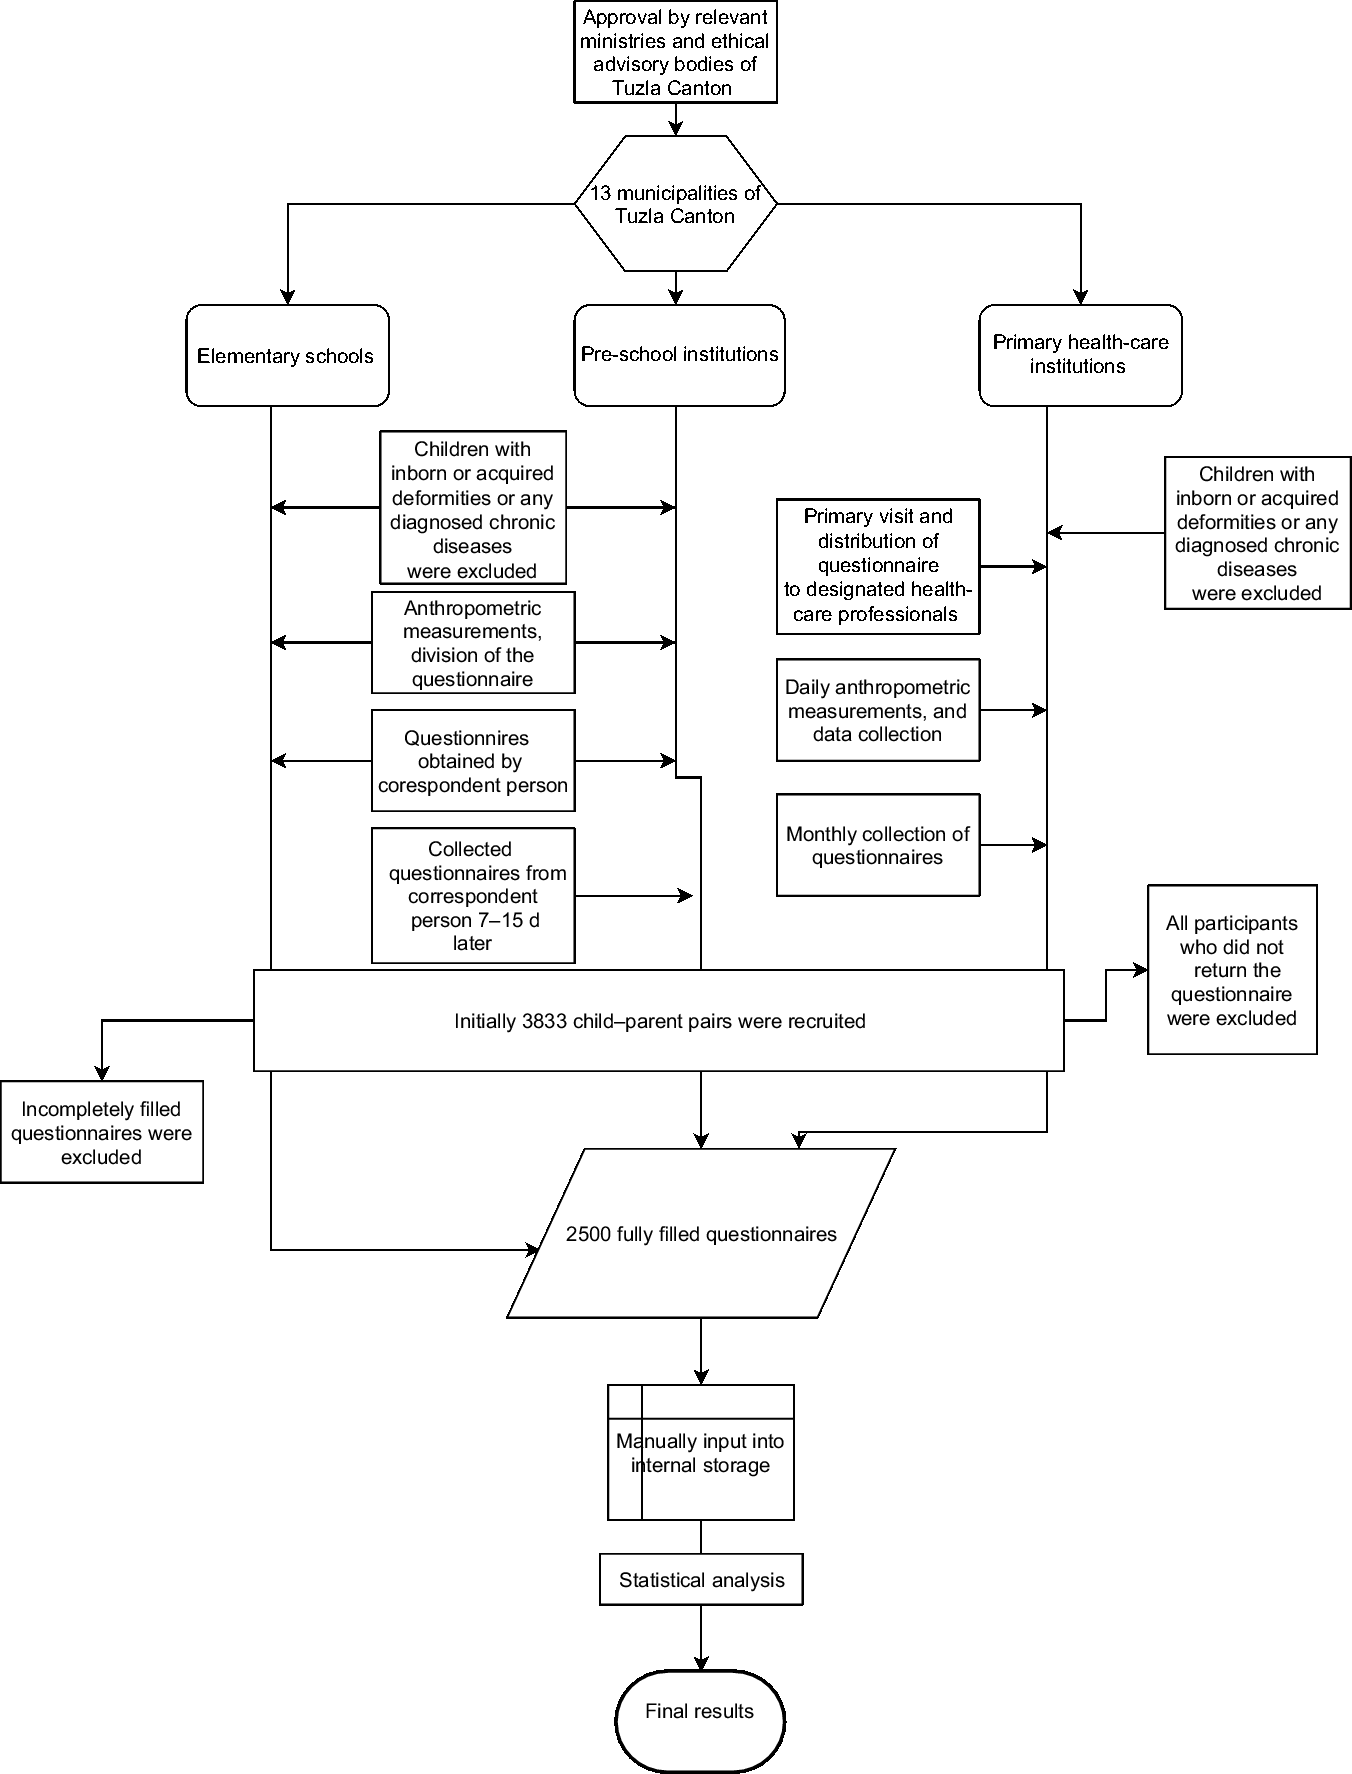
The study population initially included 3833 children aged 3–10 years (12·7 % of the total child population) and 3833 parents. Out of that number, 2561 returned an answered questionnaire with the mean response rate being 66·81 %, ranging from 12·11 to 98·51 % for different institutions. Respondents who did not answer all of the questionnaire items or who subsequently refused to take part in the survey were also excluded. Finally, the total study sample included 2500 of out 3833 children and one of their parents. A flow diagram of data collection is presented in Fig. 1.

Fig. 1 Flowchart of data collection in the present study conducted in Tuzla Canton, Bosnia and Herzegovina, from September 2016 to September 2017
Questionnaire
The questionnaire consisted of two parts. The first part gathered data on the demographic characteristics of participants and the second part was the CEBQReference Mikkilä, Räsänen and Raitakari(8), which was translated into Bosnian language by a team of two experts. The first translator provided a draft version of the translation, then the second translator controlled and delivered the final version. If there were any disagreements, an independent court interpreter made the final decision. The second translator back-translated the measure and the first translator revised it.
The CEBQ is designed to measure eating styles in childrenReference Wardle, Guthrie and Sanderson(2). It is a parent-report measure comprised of thirty-five items, each rated on a five-point Likert scale that ranges from ‘never’ to ‘always’. The instrument is ideal for use in research investigating the early precursors of eating disordersReference Wardle, Guthrie and Sanderson(2, Reference Dos Passosa, Gigantea and Maciela3, Reference Sleddens, Kremers and Thijs5, Reference Svensson, Lundborg and Cao9–Reference Njardvik, Klar and Thorsdottir18).
Anthropometric measurements
Child anthropometric measurements were taken by trained clinical staff. Weight was measured using a GIMA scale (model 27310 Astra) to the nearest of 0·01 kg and height was measured using a SECA 213 portable stadiometer to the nearest 0·01 m. For reliability, all measurements were taken in duplicate and averaged. The scale was calibrated before each measurement. The obtained values of body weight and body height were used to calculate BMI as body weight (in kilograms) divided by the square of height (in metres). To assess the weight status of participants, BMI values were expressed as a percentile value and Z-score for the appropriate age and sexReference Bryant-Waugh, Markham and Kreipe(1). BMI groups were classified according to the US Centers for Disease Control and Prevention age- and sex-matched percentile grading as: underweight (<5th percentile); normal, healthy weight (≥5th and <85th percentile); overweight (≥85th and <95th percentile); and obese (≥95th percentile)(19).
Statistical analysis
We performed data analysis using the statistical software package IBM SPSS Statistics for Windows, version 24.0. The descriptive statistics are presented as means and sd, or as numbers and percentages for categorical data. The original eight-factor model of the CEBQ was tested with principal component analysis and varimax rotationReference Tanofsky-Kraff, Ranzenhofer and Yanovski(6). Cronbach’s α coefficients and average corrected item–total correlations were calculated to assess internal reliability and validity of the original eight subscales of the CEBQ. As in previous studies we used the guidelines by Nunnally, who considered that average corrected item–total correlations above 0·30 are ‘good’ and correlations below 0·15 may be unreliableReference Nunnally(20). To examine differences in CEBQ subscale scores between weight categories, one-way ANOVA with effect sizes and post hoc analysis using the Tukey honestly significant difference test were used. To assess predictivity of the CEBQ, sex and age of the child on BMI Z-score we used multiple hierarchical regression analysis. P values <0·05 were regarded as statistically significant.
Results
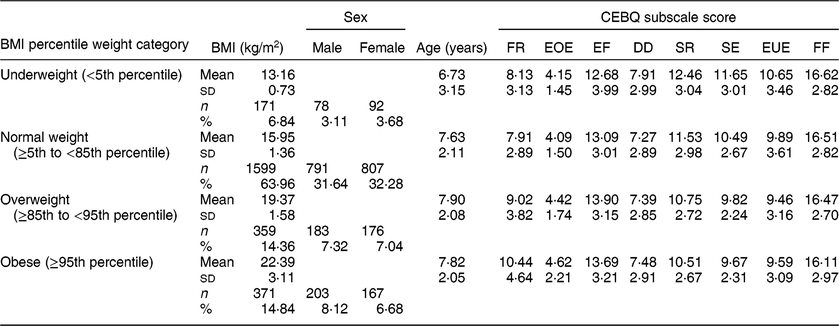
We examined 2500 children, of whom 49·8 % were girls and 50·2 % were boys. Mean age of the children was 7·64 (sd 2·19) years. The prevalence of underweight was 6·8 %, overweight 14·4 %, while there were 14·8 % obese children. Participant characteristics are shown in Table 1.
Table 1 Characteristics of the sample according to BMI percentile weight category: children aged 3–10 years (n 2500), Tuzla Canton, Bosnia and Herzegovina, September 2016–September 2017

CEBQ, Children’s Eating Behaviour Questionnaire; FR, Food Responsiveness; EOE, Emotional Overeating; EF, Enjoyment of Food; DD, Desire to Drink; SR, Satiety Responsiveness; SE, Slowness in Eating; EUE, Emotional Undereating; FF, Food Fussiness.
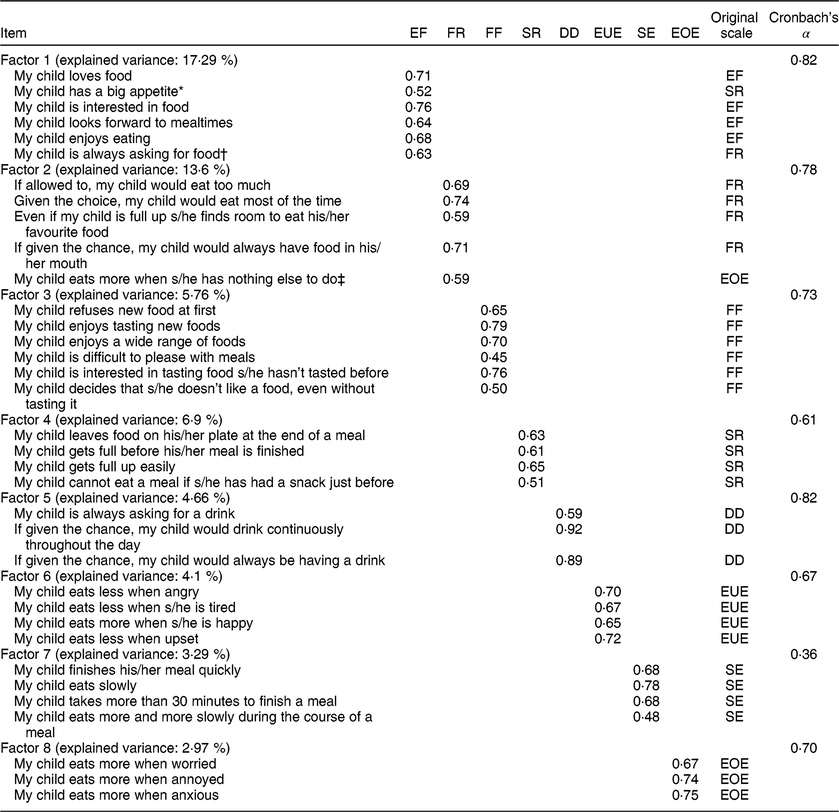
The factor analysis of the CEBQ revealed an eight-factor solution, which accounted for 56·94 % of the total variance (Table 2). Most of the items loaded as expected and the factor loadings were comparable to those in the original study and other validation studiesReference Wardle, Guthrie and Sanderson(2, Reference Mallan, Liu and Mehta15–Reference Njardvik, Klar and Thorsdottir18). Only three items loaded differently compared with the original study. The item ‘My child has a big appetite’ had the highest loading on the EF subscale and not on the SR subscale to which it originally belonged; it was therefore retained on the EF subscale (with reversed scores). The item ‘My child is always asking for food’, originally belonging to the FR subscale, loaded on to the EF subscale. The third item that did not load as expected was ‘My child eats more when s/he has nothing else to do’ from the EOE subscale, which loaded on to the FR subscale and was retained there. There were no items with a factor loading below 0·40 and all were included in further analyses.
Table 2 Factor loadings from factor analysis (principal component analysis with varimax normalised rotation) of all thirty-five items of the Children’s Eating Behaviour Questionnaire among children aged 3–10 years (n 2500), Tuzla Canton, Bosnia and Herzegovina, September 2016–September 2017

EF, Enjoyment of Food; FR, Food Responsiveness; FF, Food Fussiness; SR, Satiety Responsiveness; DD, Desire to Drink; EUE, Emotional Undereating; SE, Slowness in Eating; EOE, Emotional Overeating.
* The item ‘My child has a big appetite’ had the highest loading on the EF factor and not on the SR factor to which it originally belonged. Therefore, this item was incorporated in the factor EF with inverse score.
† The item ‘My child is always asking for food’ loaded most highly on to the EF factor than on the FR factor, where the item originally belonged. Therefore, this item was incorporated in the factor EF.
‡ The item ‘My child eats more when s/he has nothing else to do’ from EOE factor had highest loading on the FR factor and was retained there.
Internal reliability coefficients (Cronbach’s α) were calculated for each of the resulting eight factors as presented in Table 2. They are all acceptable except for SR and EUE, which fall into the questionable range, and SE, which has a low coefficient. The average item–total correlations, correcting for the contribution of the items to the scale, suggest adequate consistency of item content within the CEBQ subscales (EF 0·82, FR 0·78, FF 0·73, SR 0·61, DD 0·59, EUE 0·67, SE 0·36, EOE 0·67) and all corrected item–total correlations are considered ‘good’Reference Nunnally(20).
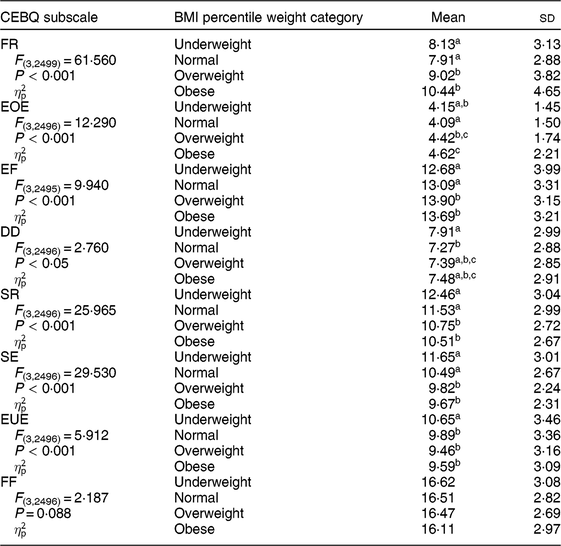
In further analysis we used CEBQ subscales which resulted from factor analysis in our sample. We conducted one-way ANOVA with effect sizes using BMI percentile weight categories and CEBQ subscales, with post hoc Tukey honestly significant difference test analysis (Table 3). This showed significant differences in CEBQ subscale scores within BMI percentile weight categories in all subscales except FF. The ![]() $\eta _{\rm{p}}^2$ coefficient was small for all subscales. Post hoc analysis showed different results. In ‘food approach’ subscales FR, EOE and EF, significant differences were found between the underweight and overweight/obese categories, except for the EOE subscale where there was no difference between the underweight and overweight categories. In the same subscales significant differences were found between the normal weight and overweight/obese categories. In the FR subscale a significant difference was also found between the overweight and obese categories. On the other hand, in the DD subscale a significant difference was only found between the underweight and normal weight categories. In ‘food avoidant’ subscales SR, SE and EUE, significant differences were found between the underweight category and all other categories, as well between the normal weight category and overweight/obese categories. There was no significant difference between categories in the FF subscale.
$\eta _{\rm{p}}^2$ coefficient was small for all subscales. Post hoc analysis showed different results. In ‘food approach’ subscales FR, EOE and EF, significant differences were found between the underweight and overweight/obese categories, except for the EOE subscale where there was no difference between the underweight and overweight categories. In the same subscales significant differences were found between the normal weight and overweight/obese categories. In the FR subscale a significant difference was also found between the overweight and obese categories. On the other hand, in the DD subscale a significant difference was only found between the underweight and normal weight categories. In ‘food avoidant’ subscales SR, SE and EUE, significant differences were found between the underweight category and all other categories, as well between the normal weight category and overweight/obese categories. There was no significant difference between categories in the FF subscale.
Table 3 One-way ANOVA for the association between Children’s Eating Behaviour Questionnaire (CEBQ) subscales and BMI percentile weight category, with effect sizes and post hoc analysis, among children aged 3–10 years (n 2500), Tuzla Canton, Bosnia and Herzegovina, September 2016–September 2017

FR, Food Responsiveness; EOE, Emotional Overeating; EF, Enjoyment of Food; DD, Desire to Drink; SR, Satiety Responsiveness; SE, Slowness in Eating; EUE, Emotional Undereating; FF, Food Fussiness.
P < 0·05 is considered significant.
a,b,cMean values within each subscale with unlike superscript letters were significantly different (post hoc analysis using Tukey’s honestly significant difference test): P < 0·05.
A series of independent hierarchical regression analyses was used to model each subscale of the CEBQ separately with child BMI Z-score entered as a continuous dependent variable, while correcting for potential confounding variables (child’s sex and age; Table 4). In general, child BMI Z-score had linear higher values with the ‘food approach’ subscales of the CEBQ (β = 0·9 to 0·19), except the DD subscale which was excluded from analysis, and a lower value with ‘food avoidant’ subscales (β = −0·03 to −0·20; Table 4). Significant relationships were found for all analysed subscales. The DD subscale was excluded because it did not add a statistically significant amount to the overall multiple R 2, so it is not presented in Table 4.
Table 4 Hierarchical linear regression analysis for BMI Z-score on Children’s Eating Behaviour Questionnaire (CEBQ) subscales among children aged 3–10 years (n 2500), Tuzla Canton, Bosnia and Herzegovina, September 2016–September 2017

FR, Food Responsiveness; EOE, Emotional Overeating; EF, Enjoyment of Food; SR, Satiety Responsiveness; SE, Slowness in Eating; EUE, Emotional Undereating; FF, Food Fussiness.
Child sex and age were forced into the models before adding each of the CEBQ subscales separately. Standardised β coefficient was −0·025 (P = 0·198) and 0·141 (P < 0·001) for the control variables sex and age, respectively.
Discussion
The current study presents first data on the prevalence of overweight/obesity as well as underweight in our country. Comparing our data with the prevalence of obesity and overweight in children of the same age as ours in eight European countries, where overall prevalence of obesity is 7·0 % and overweight is 12·8 %, we can see that our data show higher overall prevalenceReference Ahrens, Pigeot and Pohlabeln(21). These are high-income countries, which can partially explain the difference because our country is an upper-middle-income country. Comparing our results with the overall overweight/obesity prevalence in 6-year-old children in Turkey as an upper-middle-income country, we can see that our prevalence is again higherReference Manios, Costarelli, Moreno, Pigeot and Ahrens(22).
The present study is the first that has used the CEBQ translated into Bosnian language. We have shown that the translated version of the CEBQ has good psychometric properties in terms of factor structure and internal reliability similar to previous studiesReference Wardle, Guthrie and Sanderson(2, Reference Dos Passosa, Gigantea and Maciela3, Reference Sleddens, Kremers and Thijs5, Reference Svensson, Lundborg and Cao9–Reference Njardvik, Klar and Thorsdottir18). We confirmed an eight-factor structure, which was previously confirmed by four studiesReference Wardle, Guthrie and Sanderson(2, Reference Mallan, Liu and Mehta15–Reference Njardvik, Klar and Thorsdottir18) . Out of all studies done using the CEBQReference Wardle, Guthrie and Sanderson(2, Reference Svensson, Lundborg and Cao9–Reference Njardvik, Klar and Thorsdottir18) our study has the largest number of participants (n 2500).
Studies have shown that children who are overweight have higher interest in food and a more pronounced response capacity to the influence of external food attributes such as taste, colour and smellReference Dos Passosa, Gigantea and Maciela(3, Reference Santos, Ho‐Urriola and González10). The significant difference in scores on subscales FR and EF between BMI percentile weight categories found in our study is consistent with previous researchReference Dos Passosa, Gigantea and Maciela(3, Reference Webber, Hill and Saxton7, Reference Cao, Svensson and Marcus11, Reference Viana, Sinde and Saxton13) demonstrating that children with a higher BMI are responsive to environmental food cues.
Our results add to the discussion about the association between emotional eating and nutritional status. As in previous studiesReference Dos Passosa, Gigantea and Maciela(3, Reference Cao, Svensson and Marcus11, Reference Mallan, Liu and Mehta15–Reference Sirirassamee and Hunchangsith17), higher BMI was positively associated with the EOE subscale and inversely associated with the EUE subscale in our child population.
Children with higher BMI had higher scores on the DD subscale, which reflects the desire of children to carry with them usually sugary beverages with low nutritional value and high energy densityReference Domoff, Miller and Kaciroti(16, Reference Pérez-Morales, Bacardí-Gascón and Jiménez-Cruz23). Our study did not show similar results because those in the underweight category had the higher score on this subscale, which was significantly different from the score in the normal weight category. No other significance was found, and this subscale was excluded from regression analysis. One possible explanation for the lack of association in the current study is that the sample mean for DD was higher in our study than the sample means in the other studiesReference Dos Passosa, Gigantea and Maciela(3, Reference Sleddens, Kremers and Thijs5, Reference Viana, Sinde and Saxton13, Reference Mallan, Liu and Mehta15). Approximately 93 % of our sample had a mean score at or over the mid-point of the scale. This limited range of scores may account for the lack of association between the DD subscale and child BMI Z-score in regression analysis.
Significantly higher scores on the SR subscale found in the present study for the underweight category compared with other categories, and for the normal weight compared with the overweight and obese categories, confirm the idea that a decrease in response to satiety makes children less capable of regulating food intake and thus contributes to excess weight gainReference Wardle, Guthrie and Sanderson(2, Reference Dos Passosa, Gigantea and Maciela3, Reference Svensson, Lundborg and Cao9, Reference Viana, Sinde and Saxton13, Reference Berkowitz, Moore and Faith24). Previous studies also found that overweight children had lower scores on the SE subscale, demonstrating a faster eating patternReference Webber, Hill and Saxton(7, Reference Svensson, Lundborg and Cao9, Reference Viana, Sinde and Saxton13, Reference Berkowitz, Moore and Faith24). Overweight children eat faster and with greater bite size compared with normal-weight childrenReference Berkowitz, Moore and Faith(24). This is consistent with our results.
No significant association was found between the FF subscale and BMI percentile weight categories. Previous studies had different results, but we can conclude that further evidence is necessary to confirm that picky eaters consume fewer kilojoules, and weigh less, than non-picky eatersReference Webber, Hill and Saxton(7, Reference Svensson, Lundborg and Cao9, Reference Dovey, Staples and Gibson26, Reference Van’t Riet, Sijtsema and Dagevos27).
A strength of the present study was the large sample of children and their parents, which includes both pre-school and elementary-school children. The translated version of the CEBQ has shown as good internal and external reliability as the original version, and good correlation between different eating behaviours and BMI of children was proved. No study on this topic was done before in our country or in our region.
The present study has a number of limitations. As the study was cross-sectional in design, it is difficult to determine the temporal associations between the factors. The CEBQ is a parent-report measure and could be subject to bias. Parents have a large influence on the child’s eating style which was not analysed in our study. Furthermore, the cross-sectional design carries a limitation regarding the causal inference, as it is not possible to verify whether the assessed eating behaviours were determinants or consequences of excess weight.
The main finding of the study was that the prevalence of overweight and obesity among children in Bosnia and Herzegovina was at a high level. The present study suggests that the CEBQ is valuable for identifying specific eating styles, which can be seen as important and modifiable determinants implicated in the development and maintenance of abnormal weight status. More studies in this line of research are needed to validate some of the assumptions made herein. It is expected that the present study will contribute to the development of public policies in our country, as well as others, for the prevention of obesity and malnutrition in children that consider the importance of nutritional education of parents and their children with a focus on the principles of healthy eating, increasing physical activity levels, positive child eating behaviours and positive parental feeding practices.
Acknowledgements
Financial support: This research received no specific grant from any funding agency in the public, commercial or not-for-profit sectors.Conflict of interest: None. Authorship: R.S. conceived and designed the project and provided study oversight; R.B. and N.P. analysed the data; R.B. and N.P. drafted the manuscript. Both authors reviewed and approved the manuscript. R.S. has primary responsibility for the final content. Ethics of human subject participation: This study was conducted according to the guidelines laid down in the Declaration of Helsinki and all procedures involving research study participants were approved by the ethical advisory body from each pre-school institution, elementary school and health institution. Written informed consent was obtained from all parents.


