Depression and anxiety are common problems and impose large economic and social burdens (Reference Meltzer, Gill and PetticrewMeltzer et al, 1995; Reference Simon, Ornel and Von KorofrSimon et al, 1995; Reference Spitzer, Kroenker and LinzerSpitzer et al, 1995; Reference Kessler, Barber and BirnbaumKessler et al, 1999; Reference Berto, D'llario and RuffoBerto et al, 2000). These costs can be substantially reduced by effective treatment (Reference Simon, Revicki and HeiligensteinSimon et al, 2000). Patients generally prefer psychological therapies to medication (Reference Angermeyer and MatschingerAngermeyer & Matschinger, 1996; Reference TyleeTylee, 2001) and the National Service Framework for Mental Health (Department of Health, 1999) has called for increased availability of such treatments for common mental health problems. A shortage of trained therapists (Reference Goldberg and GournayGoldberg & Gournay, 1997) has directed attention to alternative methods for delivering psychological therapies that offer rapid and acceptable care pathways (Reference Lovell and RichardsLovell & Richards, 2000). We therefore assessed the cost-effectiveness of a computerised therapy program for anxiety and depression.
METHOD
Sample
Participants were recruited in two phases from 12 general practices in south-east England; they were included in the study if they were aged 18–75 years, had a diagnosis of depression, mixed depression and anxiety or anxiety disorders, and were not currently receiving face-to-face psychological therapy (including counselling). Patients who consented were then randomised to receive computerised therapy with usual treatment, or usual treatment alone. If recruits randomised to computerised therapy had previously been referred for face-to-face counselling or care from a psychologist, then this was replaced by the computerised therapy program for the duration of the study. Full details of the study method are given in another paper (Reference Proudfoot, Ryden and EverittProudfoot et al, 2004, this issue).
Intervention
The computerised therapy program used (Beating the Blues) consisted of a 15 min introductory video followed by eight 50 min sessions of cognitive–behavioural therapy (further details available from the authors upon request). General practitioners and practice nurses were kept informed about the patients’ progress by means of automatically generated computer printouts following each session. Treatment as usual consisted of a variety of interventions, including discussions with the general practitioner, referral to a counsellor, practice nurse or mental health professional, and treatment of physical conditions.
Outcome measures
Clinical measures were recorded at baseline and at a number of follow-up points. This was a cost-effectiveness analysis, and it was therefore appropriate to use the primary clinical outcome measure in the evaluation. Further analyses used an economic measure, the quality-adjusted life year (QALY), to compare the cost-utility of the interventions. The primary clinical outcome measure was the change in the level of depression, rated using the Beck Depression Inventory (BDI; Reference Beck, Steer and BrownBeck et al, 1996), between randomisation and 6 months following the end of treatment (which was around 8 months following randomisation). Other clinical outcome measures used were the Beck Anxiety Inventory (BAI; Reference Beck and SteerBeck & Steer, 1990) and the Work and Social Adjustment (WSA) scale (Reference MarksMarks, 1986).
Where BDI scores were missing, values were imputed using best subset regression analysis in Stata (StataCorp, 2002). The independent variables were the available BDI scores (pre-treatment, post-treatment, and at 1 month, 3 months and 6 months following treatment), as well as BAI and WSA scores and a number of socio-demographic characteristics (age, gender, ethnicity, employment status, marital status, length of illness and whether antidepressants were being taken).
A secondary outcome measure was an estimate of the number of depression-free days in the 8 months following randomisation, on the basis of BDI scores at four assessment points (immediately post-treatment, and 1 month, 3 months and 6 months following treatment), adapting an algorithm developed by Lave et al (Reference Lave, Frank and Schulberg1998). The calculation did not use the imputed values described above; if BDI data were missing, then it was conservatively assumed that the participant was in a state of depression at that time. The number of days in a state of depression between time points was estimated using a straight line interpolation. Therefore, if someone was not depressed at the post-treatment assessment but was depressed at the 1-month follow-up (or the score was missing), it was assumed this person had had 15 depression-free days during the period. A further measure, the number of QALYs gained, was also used; these were estimated using the method described by Lave et al (Reference Lave, Frank and Schulberg1998). On a utility scale of 0 to 1, a depression-free day was assumed to score 1 and a day with depression was assumed to score 0.59. These values were averages, calculated by Lave et al (Reference Lave, Frank and Schulberg1998), of those reported in the literature. Costs were formally linked to the above two outcome measures in the form of cost-effectiveness and cost-utility analyses (see below).
Service use
Service use data were collected from general practitioners’ notes and other primary care sources by nurses for patients in each arm of the trial for two periods: the 6 months prior to randomisation and the 8 months following randomisation – these periods were considered sufficiently long to capture the use of rarily accessed (but often expensive) services. The collection of baseline data allowed differences that might exist even within randomised controlled trials to be controlled for. The reliability of this method of data collection clearly depends on the reliability of the record-keeping of primary care staff. The aim was to be comprehensive, so that the effects on all health care services of providing the intervention or usual care could be observed. Because data were collected from primary care sources it was not possible to measure use of social service care other than that of home helps. Other studies too have focused on health care costs (Reference Bower, Byford and SibbaldBower et al, 2000).
Services measured included actual contacts with mental health care staff (psychiatrists, psychologists, community mental health nurses, counsellors and other therapists); with primary care staff (general practitioners, practice nurses, district nurses and health visitors); with hospital services (in-patient care for psychiatric and physical health reasons, out-patient care, day surgery, and accident and emergency attendances); with home helps; medication (all medication was recorded, but only data on antidepressants, anxiolytics and sedatives were used in the analyses); and contacts with other services (chiropodists, physiotherapists and dieticians). The number of contacts with each service was recorded or, in the case of medication, the length of the course and the dosage.
Service costs
Unit costs (which aim to reflect the long-run marginal costs) for most services were obtained from a recognised national source (Reference Netten and CurtisNetten & Curtis, 2000), which calculated staff costs by dividing the total cost (salary, oncosts, overheads, capital, land and training) of the service over 1 year by an appropriate unit of activity. Hospital costs (accident and emergency care, day surgery, generic in-patient and out-patient services and psychiatric in-patient care) were also obtained from this source. Medication costs were taken from the British National Formulary (British Medical Association & Royal Pharmaceutical Society of Great Britain, 2001). Unit costs were multiplied by the service use data to generate service costs per patient.
Although general practitioners were not charged for the use of the computerised therapy program in this study, in routine practice they would need to purchase a licence to use Beating the Blues. The average price per patient using this program was estimated by the manufacturer to be £ 100, taking into account the expected throughput of patients. To this was added £16 to cover the overhead and capital costs of the primary care setting where the application would be used, a figure derived from costs reported by Netten & Curtis (Reference Netten and Curtis2000). The total cost was then divided by 8 to calculate the cost per session (£14.50). The system is designed to be used independently by patients; however, primary care staff would be on hand to offer assistance if necessary, and they would also retrieve from the system reports on patients’ progress.
Lost production
We recorded the number of days of absence from work during the baseline and follow-up periods on the basis of the issue of a certificate by the general practitioner. Work days lost that did not require such a certificate were not recorded, and this measure of lost work is therefore an underestimate. We used the ‘human capital’ approach of assuming that the cost of each day of lost employment is equal to the age- and gender-specific national average daily wage; our rationale was that depression and anxiety may be less likely than other illnesses to result in long-term work absence and, therefore, replacement would not be as probable. Given the methodological debate concerning such costs, and because changes in production costs are more correctly seen as a consequence of treatment, we present service costs and total costs (including lost employment) separately.
The baseline and follow-up service use and cost periods differed in length. In order to make meaningful comparisons, the baseline 6-month costs were all multiplied by 1.33 in order to generate 8-month cost figures.
Statistical analysis
The analyses were conducted on an intention-to-treat basis, with the main focus on comparing the intervention and control groups. Significance tests for the difference in mean total costs at follow-up were conducted by generating bootstrapped 90% confidence intervals (with 5000 repetitions), because of the expected non-normality of the cost data. We controlled for baseline cost differences and phase of data collection (which was an indicator variable) using multiple regression analysis. (The rationale for using 90% confidence intervals rather than those at the more conventional level of 95% was that we are less risk-averse when making financial decisions than we are when making clinical decisions. It could, of course, be argued that financial decisions in health care have potentially serious implications, but these implications are likely to be clinical.) There might have been differences in costs between the practices, and therefore we used the ‘cluster’ option in the bootstrapped regression analysis. Clustered regression generally results in larger standard errors than standard regression.
Cost-effectiveness
The cost-effectiveness of the intervention compared with usual care was determined using the net benefit approach (Reference BriggsBriggs, 2001). There is a theoretical, but unknown, value (represented by the term λ below) that society would place on a 1-unit reduction in depression score as measured by the BDI. The net benefit (NB) to society of the intervention can be defined as
where E is the effectiveness (i.e. reduction in BDI score over 6 months) and SC is the service costs. For example, if for a particular patient the BDI score is reduced by 8 points during the follow-up period and if their service cost is £250, then we can calculate net benefit if we know λ. If λ =£0 then the net benefit is –£250, whereas if λ =£40 then the net benefit is £70.
We estimated net benefits for all patients in the sample by assuming different values for λ ranging from £0 to £100 in £10 increments. A regression model was then used to determine the mean difference in net benefit between the intervention (Beating the Blues – BtB) and treatment as usual (TAU) groups for every value of λ, controlling for baseline costs and the phase of data collection. For each model, 5000 regression coefficients for the BtB/TAU variable were generated using bootstrapping, and the proportion of these that were greater than zero indicated the probability that the intervention was cost-effective (i.e. it resulted in a mean incremental net benefit greater than zero). These probabilities were subsequently used to generate a cost-effectiveness acceptability curve. (There was no information available to inform the range and increments of λ; we therefore chose a range that would show what the value of λ had to be to achieve a probability value of around 0.8 for BtB being cost-effective.)
The net benefit approach was also used to analyse the link between costs and depression-free days. In this analysis, λ ranged between £0 and £50 and increased in £5 increments. (These increments were different from those used above, as it became clear that the likelihood of BtB being more cost-effective than TAU was sensitive to smaller changes in λ.) The same approach was used to assess the cost-utility of BtB relative to TAU. However, here alternative societal values for 1 QALY gained were used to generate the cost-utility acceptability curve. The alternative values ranged between £0 and £50 000 and increased in increments of £5000. Again, these values were chosen for pragmatic reasons, i.e. to show the point at which BtB becomes ‘clearly’ cost-effective.
The clinical trial also used the BAI and the WSA scale. These measures were not formally linked with the cost data, although the cost findings were viewed alongside changes in these scores in the form of a cost–consequences analysis in order to draw broad conclusions about the efficiency of BtB v. TAU.
Sensitivity analyses
Uncertainty often exists around some of the parameters in economic evaluations. In this study the unit cost of BtB was originally assumed to be £ 14.50 per session, but this was dependent on the costs to general practices of the system and the expected throughput of patients. We therefore examined the impact of different unit costs on service and total costs and also on the cost-effectiveness of BtB relative to TAU. The alternative values were £5 and £30 per session.
RESULTS
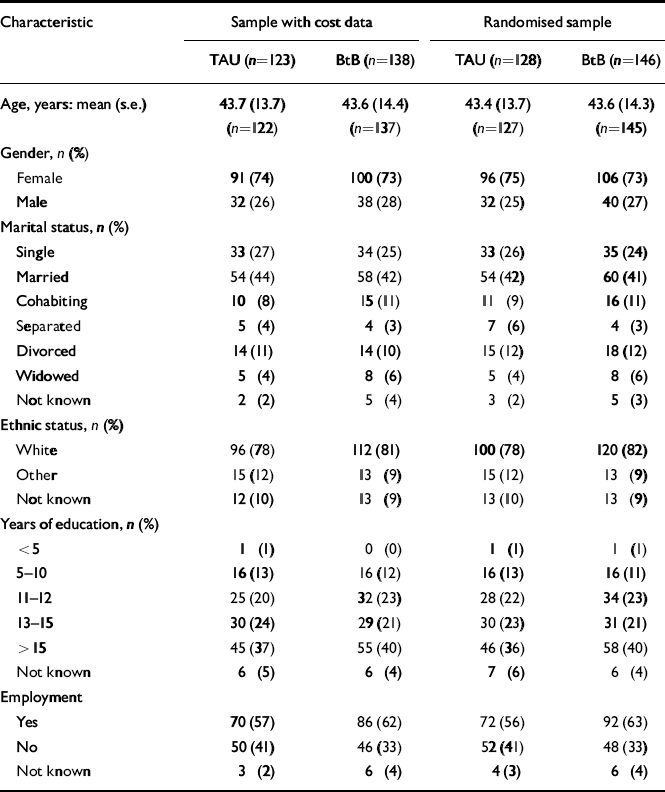
A total of 274 patients attending the surgeries were randomised into two groups (BtB, n=146; TAU, n=128), with cost data available for both baseline and follow-up periods for 261 (95%) patients (138 BtB, 123 TAU) (Fig. 1). The analyses presented below refer to these 261 patients, whose demographic characteristics are shown in Table 1; there was no other source of information for service use and lost employment days for the remaining 13 patients. The number of people for whom cost data were available differs from that reported by Proudfoot et al (Reference Proudfoot, Ryden and Everitt2004, this issue), but only marginally.

Fig. 1 Consort diagram. CIS–R, Clinical Interview Schedule – Revised; GP, general practitioner.
Table 1 Characteristics of the study sample
| Characteristic | Sample with cost data | Randomised sample | ||
|---|---|---|---|---|
| TAU (n=123) | BtB (n=138) | TAU (n=128) | BtB (n=146) | |
| Age, years: mean (s.e.) | 43.7 (13.7) | 43.6 (14.4) | 43.4 (13.7) | 43.6 (14.3) |
| (n=122) | (n=137) | (n=127) | (n=145) | |
| Gender, n (%) | ||||
| Female | 91 (74) | 100 (73) | 96 (75) | 106 (73) |
| Male | 32 (26) | 38 (28) | 32 (25) | 40 (27) |
| Marital status, n (%) | ||||
| Single | 33 (27) | 34 (25) | 33 (26) | 35 (24) |
| Married | 54 (44) | 58 (42) | 54 (42) | 60 (41) |
| Cohabiting | 10 (8) | 15 (11) | 11 (9) | 16 (11) |
| Separated | 5 (4) | 4 (3) | 7 (6) | 4 (3) |
| Divorced | 14 (11) | 14 (10) | 15 (12) | 18 (12) |
| Widowed | 5 (4) | 8 (6) | 5 (4) | 8 (6) |
| Not known | 2 (2) | 5 (4) | 3 (2) | 5 (3) |
| Ethnic status, n (%) | ||||
| White | 96 (78) | 112 (81) | 100 (78) | 120 (82) |
| Other | 15 (12) | 13 (9) | 15 (12) | 13 (9) |
| Not known | 12 (10) | 13 (9) | 13 (10) | 13 (9) |
| Years of education, n (%) | ||||
| <5 | 1 (1) | 0 (0) | 1 (1) | 1 (1) |
| 5–10 | 16 (13) | 16 (12) | 16 (13) | 16 (11) |
| 11–12 | 25 (20) | 32 (23) | 28 (22) | 34 (23) |
| 13–15 | 30 (24) | 29 (21) | 30 (23) | 31 (21) |
| > 15 | 45 (37) | 55 (40) | 46 (36) | 58 (40) |
| Not known | 6 (5) | 6 (4) | 7 (6) | 6 (4) |
| Employment | ||||
| Yes | 70 (57) | 86 (62) | 72 (56) | 92 (63) |
| No | 50 (41) | 46 (33) | 52 (41) | 48 (33) |
| Not known | 3 (2) | 6 (4) | 4 (3) | 6 (4) |
Service use
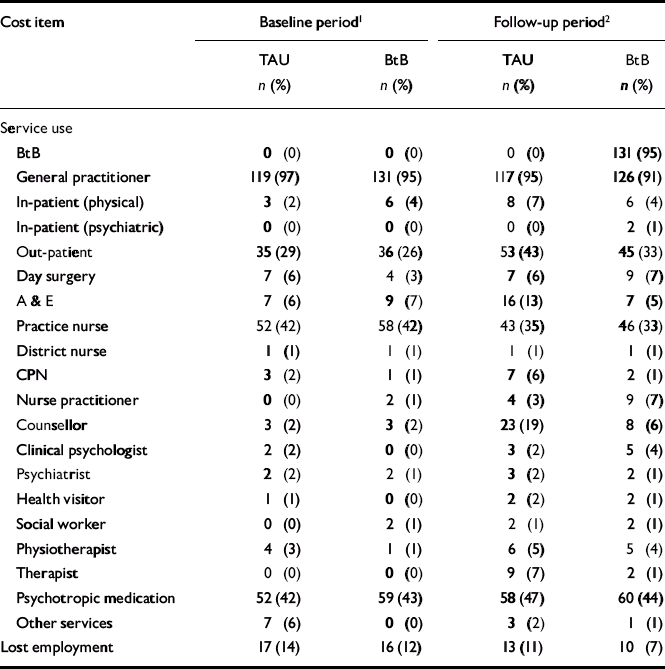
During the 6 months prior to randomisation (baseline), most of the patients had contact with their general practitioner (Table 2). Slightly under half of the participants in each group had contact with practice nurses and approximately a quarter had out-patient appointments; the latter were predominantly for physical health reasons, as were all in-patient episodes. Participants in the usual treatment group were more likely to use services in the ‘other’ category (these services, identified from the case notes, were dietician, midwife, support worker, chiropodist, complementary health care and a medical check with a private health insurer).
Table 2 Number of patients using services and with lost employment: comparison of the treatment-as-usual group (TAU; n=123) and the intervention group (BtB; n=138).
| Cost item | Baseline period1 | Follow-up period2 | ||
|---|---|---|---|---|
| TAU n (%) | BtB n (%) | TAU n (%) | BtB n (%) | |
| Service use | ||||
| BtB | 0 (0) | 0 (0) | 0 (0) | 131 (95) |
| General practitioner | 119 (97) | 131 (95) | 117 (95) | 126 (91) |
| In-patient (physical) | 3 (2) | 6 (4) | 8 (7) | 6 (4) |
| In-patient (psychiatric) | 0 (0) | 0 (0) | 0 (0) | 2 (1) |
| Out-patient | 35 (29) | 36 (26) | 53 (43) | 45 (33) |
| Day surgery | 7 (6) | 4 (3) | 7 (6) | 9 (7) |
| A & E | 7 (6) | 9 (7) | 16 (13) | 7 (5) |
| Practice nurse | 52 (42) | 58 (42) | 43 (35) | 46 (33) |
| District nurse | 1 (1) | 1 (1) | 1 (1) | 1 (1) |
| CPN | 3 (2) | 1 (1) | 7 (6) | 2 (1) |
| Nurse practitioner | 0 (0) | 2 (1) | 4 (3) | 9 (7) |
| Counsellor | 3 (2) | 3 (2) | 23 (19) | 8 (6) |
| Clinical psychologist | 2 (2) | 0 (0) | 3 (2) | 5 (4) |
| Psychiatrist | 2 (2) | 2 (1) | 3 (2) | 2 (1) |
| Health visitor | 1 (1) | 0 (0) | 2 (2) | 2 (1) |
| Social worker | 0 (0) | 2 (1) | 2 (1) | 2 (1) |
| Physiotherapist | 4 (3) | 1 (1) | 6 (5) | 5 (4) |
| Therapist | 0 (0) | 0 (0) | 9 (7) | 2 (1) |
| Psychotropic medication | 52 (42) | 59 (43) | 58 (47) | 60 (44) |
| Other services | 7 (6) | 0 (0) | 3 (2) | 1 (1) |
| Lost employment | 17 (14) | 16 (12) | 13 (11) | 10 (7) |
The high level of contact with general practitioners, practice nurses and out-patient services continued into the 8-month follow-up period. Large differences were observed for the proportion of patients attending accident and emergency or out-patient departments, and having contacts with community psychiatric nurses, counsellors and other therapists. Greater use was made by the TAU group for all these services. For psychotherapy services, including counselling, this may reflect the suppression of such services to the BtB group during the treatment period imposed by the study design. By follow-up, the proportion of patients who had had to stop working at some time was reduced slightly in the BtB group.
At follow-up, two people in the BtB sample had had psychiatric in-patient treatment, for 20 days and 30 days respectively. None of the available information suggested that the study intervention had precipitated the need for in-patient psychiatric care. In both cases the patient either did not want the treatments offered in primary care or did not respond to them, and therefore more specialist mental health care was one option open to them. At the baseline assessment over a third of patients had been taking antidepressant medication, and this proportion increased slightly at follow-up.
Service costs
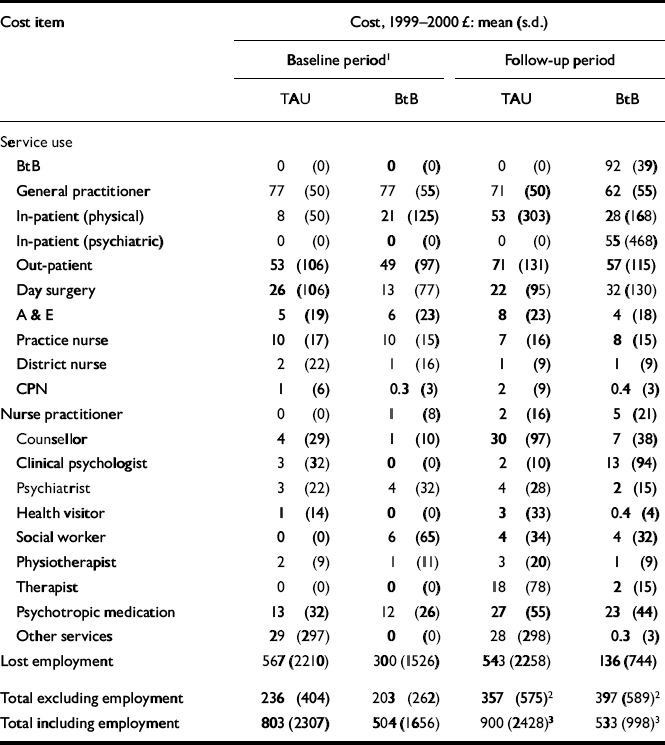
The mean costs of individual services were generally quite low for the two groups at baseline (Table 3), and the overall mean total service cost was £33 lower for the BtB group at this assessment point. Few substantial differences between the groups had emerged by follow-up; however, the mean costs of both counsellors and other therapists over the 8-month period were substantially higher for the TAU group. The mean service cost was £40 higher for the BtB group at follow-up; with baseline costs and phase of data collection controlled for, this difference was not statistically significant (90% CI –£28 to £ 148).
Table 3 Cost of services used and lost employment: comparison of the treatment-as-usual group (TAU; n=123) and the intervention group (BtB; n=138)
| Cost item | Cost, 1999–2000 £: mean (s.d.) | |||
|---|---|---|---|---|
| Baseline period1 | Follow-up period | |||
| TAU | BtB | TAU | BtB | |
| Service use | ||||
| BtB | 0 (0) | 0 (0) | 0 (0) | 92 (39) |
| General practitioner | 77 (50) | 77 (55) | 71 (50) | 62 (55) |
| In-patient (physical) | 8 (50) | 21 (125) | 53 (303) | 28 (168) |
| In-patient (psychiatric) | 0 (0) | 0 (0) | 0 (0) | 55 (468) |
| Out-patient | 53 (106) | 49 (97) | 71 (131) | 57 (115) |
| Day surgery | 26 (106) | 13 (77) | 22 (95) | 32 (130) |
| A & E | 5 (19) | 6 (23) | 8 (23) | 4 (18) |
| Practice nurse | 10 (17) | 10 (15) | 7 (16) | 8 (15) |
| District nurse | 2 (22) | 1 (16) | 1 (9) | 1 (9) |
| CPN | 1 (6) | 0.3 (3) | 2 (9) | 0.4 (3) |
| Nurse practitioner | 0 (0) | 1 (8) | 2 (16) | 5 (21) |
| Counsellor | 4 (29) | 1 (10) | 30 (97) | 7 (38) |
| Clinical psychologist | 3 (32) | 0 (0) | 2 (10) | 13 (94) |
| Psychiatrist | 3 (22) | 4 (32) | 4 (28) | 2 (15) |
| Health visitor | 1 (14) | 0 (0) | 3 (33) | 0.4 (4) |
| Social worker | 0 (0) | 6 (65) | 4 (34) | 4 (32) |
| Physiotherapist | 2 (9) | 1 (11) | 3 (20) | 1 (9) |
| Therapist | 0 (0) | 0 (0) | 18 (78) | 2 (15) |
| Psychotropic medication | 13 (32) | 12 (26) | 27 (55) | 23 (44) |
| Other services | 29 (297) | 0 (0) | 28 (298) | 0.3 (3) |
| Lost employment | 567 (2210) | 300 (1526) | 543 (2258) | 136 (744) |
| Total excluding employment | 236 (404) | 203 (262) | 357 (575)2 | 397 (589)2 |
| Total including employment | 803 (2307) | 504 (1656) | 900 (2428)3 | 533 (998)3 |
Total costs
Lost employment costs were on average £267 greater for the TAU group at baseline. With the inclusion of lost employment, the TAU group was shown to have mean baseline costs that were £299 higher than those for the BtB group. The mean cost of lost employment at follow-up was £407 less for the BtB patients and this was statistically significant (90% CI £ 196–£586). The TAU group was £367 more expensive with the inclusion of the costs of lost employment, and controlling for baseline costs this was seen to be statistically significant (90% CI £ 123–£589).
Outcomes
Computer-delivered CBT resulted in improved scores on the BDI, BAI and WSA scale (full details of the main clinical outcomes are reported by Reference Proudfoot, Ryden and EverittProudfoot et al, 2004, this issue). With imputation for missing values (which was particular to the economic analysis), this therapy resulted in a mean reduction in BDI score, relative to the usual treatment group, of 3.5 (95% CI 0.6–6.4). Based on the BDI scores over time, the TAU group was estimated to have a mean of 61.0 (s.d.=67.1) depression-free days, v. 89.7 (s.d.=74.2) depression-free days for the BtB group. This estimate is limited by the small number of measurement points and the uncertainty created by missing data. Complete BDI follow-up scores were available for 148 (57%) of the 261 participants: 65 (53%) of the TAU group and 83 (60%) of the BtB group. For 34 (13%) one of the scores was missing, for 21 (8%) two scores were missing, for 16 (6%) three scores were missing and for 42 (16%) all four were missing. The difference in number of depression-free days between the groups was 28.4, after controlling for phase of data collection, and this was highly significant (95% CI 10.7–45.5). These figures are equivalent to an incremental QALY gain of 0.032 for BtB over TAU. This equates to 3% of 1 QALY, which is relatively small, but the follow-up period was also relatively short.
Cost-effectiveness and cost-utility analysis
The intervention was both more expensive and more effective than treatment as usual (although only the effectiveness difference was statistically significant); it was therefore uncertain whether it was more cost-effective. Figure 2 shows that if society places a zero value on a unit reduction in BDI score then there is only a 14% chance that BtB is more cost-effective than TAU. However, the probability of the intervention being more cost-effective soon increases with positive values placed on such a reduction, and at a value of £40 and above per unit reduction, the probability of BtB being cost-effective is in excess of 0.8.
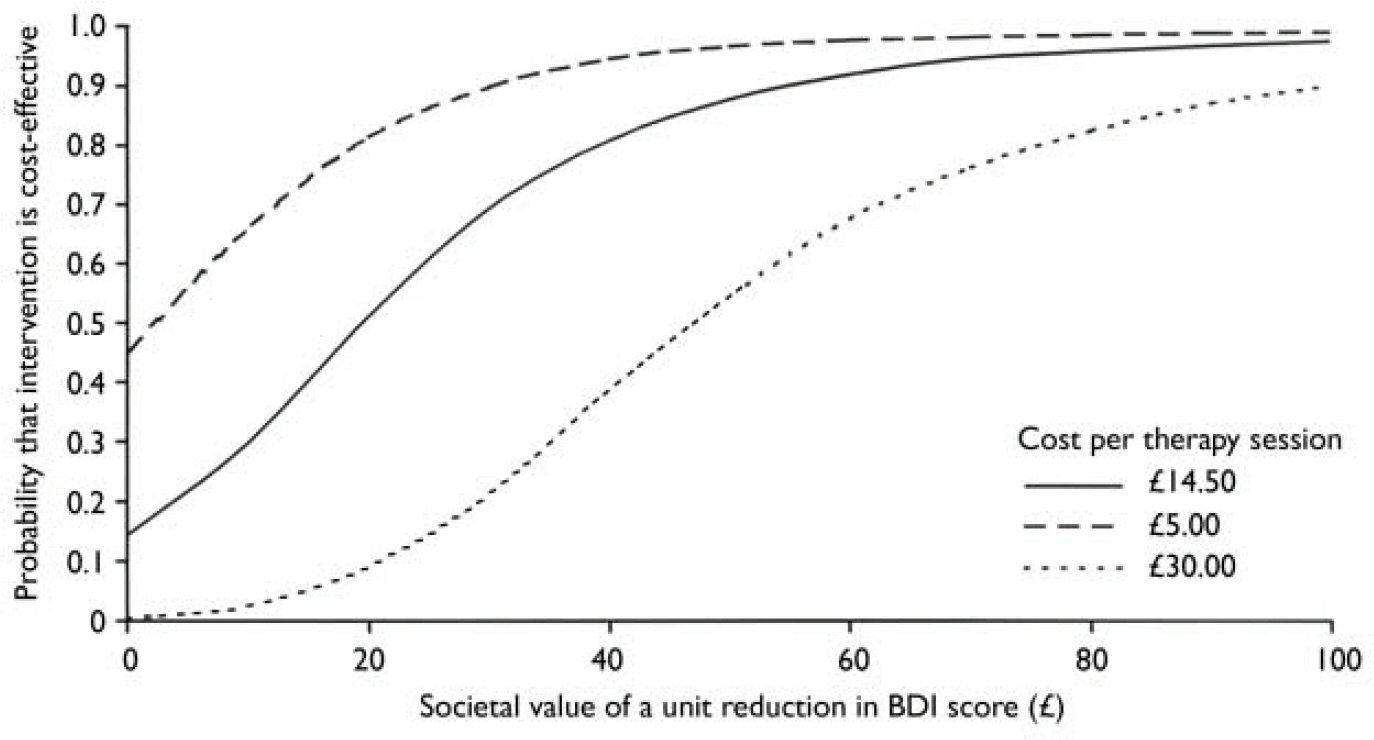
Fig. 2 Cost-effectiveness acceptability curve for computer-delivered cognitive–behavioural therapy based on the societal value of a unit reduction in Beck Depression Inventory (BDI) score.
The effects of using unit costs of £5 and £30 for the computer-delivered therapy sessions on cost-effectiveness are also shown. In the former case it can be seen that even with a zero value placed on a unit reduction in BDI score there is a 45% chance that BtB is more cost-effective than TAU; for the more expensive sessions, slightly higher values are required before BtB is clearly more cost-effective.
Figure 3 shows that if society places a zero value on a depression-free day then there is only a 14.5% chance that BtB is more cost-effective than TAU. However, if a value of £ 5 is placed on a depression-free day there is an 80% chance of BtB being more cost-effective, and this soon approaches 100% for higher values.
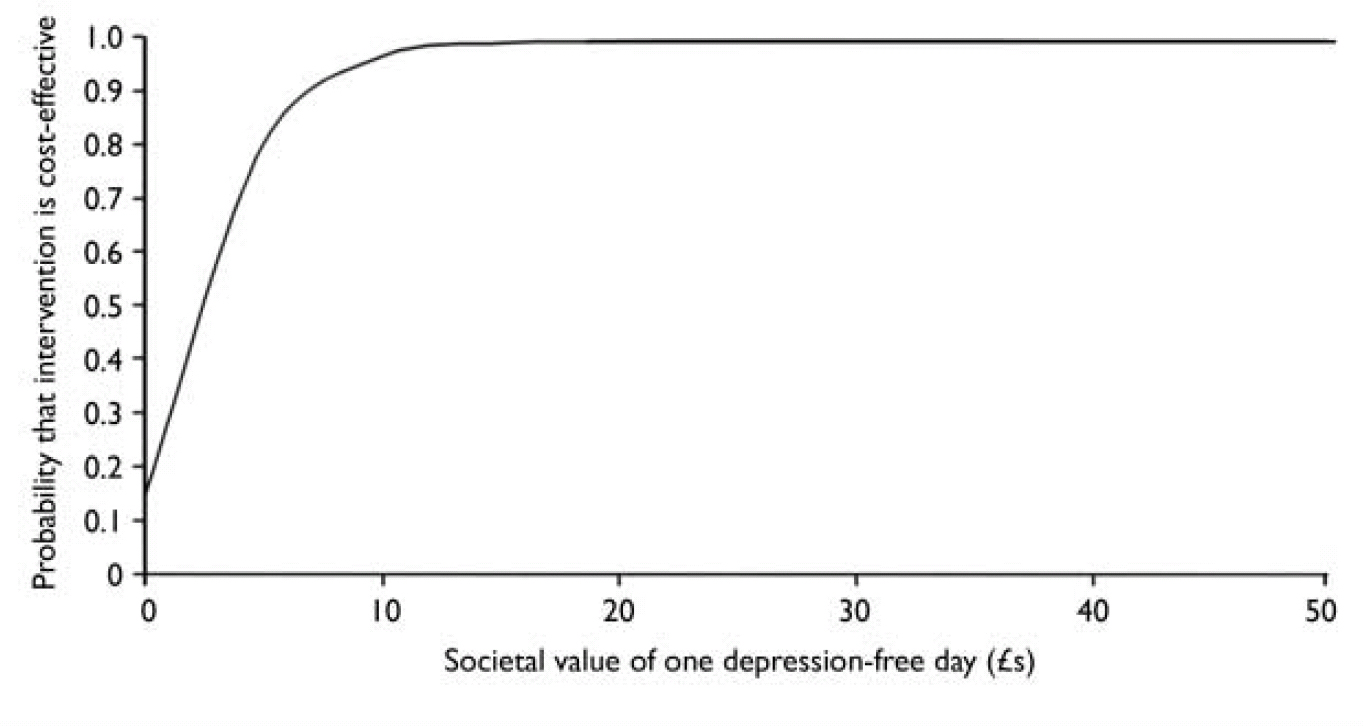
Fig. 3 Cost-effectiveness acceptability curve based on societal value of one extra depression-free day.
The results of the cost-utility analysis are shown in Fig. 4. If society places a £ 5000 value on 1 QALY there is an 85% chance that BtB is more cost-effective. The figure becomes over 99% with QALYs valued at £15 000.
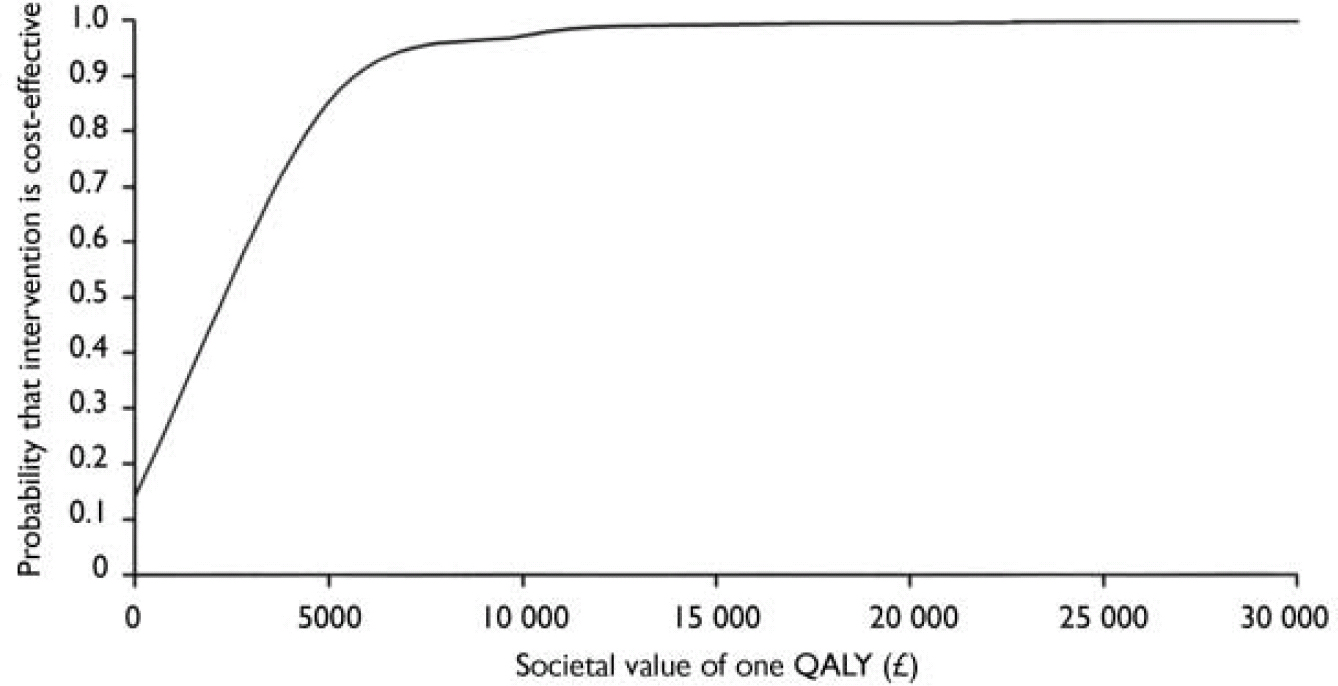
Fig. 4 Cost-effectiveness acceptability curve based on societal value of one extra quality-adjusted life year (QALY) attained.
DISCUSSION
This economic evaluation of computer-delivered CBT supports its cost-effectiveness in four respects. First, it is clinically superior to treatment as usual by the primary care team, at negligible additional cost. Second, even for what seem to be modest societal values of a unit decrease in the BDI score, the likelihood of this intervention being relatively cost-effective is high. Third, cost-utility analysis indicates a highly competitive cost per QALY relative to other interventions recommended for use in the National Health Service (NHS). Finally, significant productivity increases were indicated by a reduction in lost employment, compared with treatment as usual.
Service costs
Service costs were comparable to those reported, also in the UK, by Bower et al (Reference Bower, Byford and Sibbald2000), who found similar costs before and after psychological treatments for patients with depression receiving face-to-face psychological therapies or treatment as usual in primary care. It might be considered disappointing that neither study found any direct cost savings from the provision of clinically effective psychological therapies, whether delivered face-to-face or by computer. However, a treatment yielding substantial clinical benefit, without incurring significantly or commensurately greater costs, may reasonably be deemed cost-effective.
Acceptability
Formally linking cost and outcomes data added further strength to the claim that computer-delivered CBT is cost-effective. Even if the value placed by society on a unit reduction in BDI score is considered to be only £40, this therapy attains an 81% probability of cost-effectiveness. Similarly, assigning a value of £5 to a depression-free day would result in an 80% chance of the therapy being cost-effective. With regard to the cost-utility analysis, there is a 99% probability that it is cost-effective if QALYs are valued at £15 000, which appears to be well below the decision-making threshold used by the National Institute for Clinical Excellence (NICE) – often assumed to be between £30 000 and £50 000, although such a range has not been officially defined. Finally, the fact that the therapy produced significantly better outcomes as measured by the BAI and the WSA scale indicates that it is cost-effective in a broader sense than shown by the analyses reported here.
Lost employment
Mean certificated lost-employment costs were lower following the intervention. This result resembles that reported by Simon et al (Reference Simon, Revicki and Heiligenstein2000), who found that previously depressed patients in remission are most likely to remain in paid employment and report fewer missed days from work owing to illness. Our findings suggest that the employment benefits of increasing access to effective treatments for anxiety and depression are likely to outweigh the direct savings in health care costs.
Implications
Computerised CBT offers a worthwhile contribution to the provision of greater and more equitable access to psychological treatment for common mental health problems encountered in primary care, as called for by the National Service Framework for Mental Health (Department of Health, 1999). It could have a role in a stepped care model that would enable trained cognitive–behavioural therapists to conserve their limited resources for more complex and challenging cases. However, we have no evidence yet to indicate whether computerised therapy is more or less cost-effective than face-to-face therapy for patients with different levels of symptom severity. Computerised therapy might also have a place in the management of patients who refuse psychotropic medication, as well as of those whose medication compliance is impaired by side-effects. The cost-utility analysis allows NHS commissioners and others to compare the benefits of computer-delivered CBT with those of interventions in other health care domains, with which treatments of depression and anxiety such as BtB may be in competition for scarce resources. Our cost-utility findings suggest that clinically effective treatment of anxiety and depression yields good value for money relative to many other areas of NHS expenditure. However, although computerised therapy was cost-effective in securing better clinical and lost-employment outcomes than usual treatment at costs that were not significantly greater, it must be acknowledged that it did not appear to reduce health care costs either.
The effect of computer-delivered CBT on lost employment has wide implications for the value of effective mental health interventions for many stakeholders. Lost employment has adverse consequences for both individuals and their employers. Since both workers and employers stand to gain from computerised CBT, our findings support its provision within employee assistance programmes.
Limitations
This study has some limitations. The number of days of lost employment is likely to be an underestimate, as lost days for which a doctor's certificate was not obtained were not included. Depression and anxiety typically result in many shorter, uncertificated episodes of absence, which are also likely to be curtailed by the provision of effective treatment programmes. Their exclusion is likely to bias a comparison against an effective treatment such as computer-delivered CBT.
A second limitation is that the service utilisation focus was on health care costs, although people with depression or anxiety may also make increased use of services provided by other agencies. In their comparison of short-term counselling with standard primary care for patients with depression, Simpson et al (Reference Simpson, Corney and Fitzgerald2000) found that social care services accounted for 14% of total costs and criminal justice services 3% of total costs.
Third, the QALYs used in the cost-utility analysis were not directly measured as part of the study. Utility values were obtained from another study simply for days with and days without depression, and clearly there should be a more graduated spectrum of values between these two extremes. In addition, crucial assumptions had to be made with regard to missing BDI scores on which the depression-free days were based. The cost-utility analysis should thus be seen as more tentative than the cost-effectiveness analysis. Future studies should either measure utility directly, or should use an instrument from which QALYs can be more readily derived.
Fourth, the cost-effectiveness analysis required us to assume societal values for unit improvements in outcome. There are, however, no recognised benchmarks as to what are acceptable values for making decisions. A high probability of cost-effectiveness when a QALY gain is valued at £15 000 suggests good value for money, but this is only based on previous decision-making by bodies such as NICE. It is less clear what constitutes an appropriate value for a unit change in depression. The use of cost-effectiveness acceptability curves addresses this problem in part, but value judgements still need to be made when a treatment is both more expensive and more effective.
Finally, the costs of general practitioner consultations by patients in the intervention group may be slightly inflated because the protocol called for general practitioners to review patients proactively. Although such consultations might also have met clinical needs that would have occasioned the visits in any event, it is possible that we over-estimated the number of consultations that would be required by patients using computerised therapy in a non-research context.
Clinical Implications and Limitations
CLINICAL IMPLICATIONS
-
▪ Computer-delivered cognitive–behavioural therapy results in service costs that are marginally higher than treatment as usual.
-
▪ Extra service costs are more than offset by reductions in days of lost employment.
-
▪ Computerised therapy is cost-effective with relatively low values placed on reductions in depression, increases in depression-free days and increases in quality-adjusted life years.
LIMITATIONS
-
▪ Service use data were collected from general practitioners’ records, and may underestimate contacts.
-
▪ Only lost employment days for which a doctor's certificate had been provided were included in the analysis.
-
▪ Utility values for quality-adjusted life years were obtained from a secondary source.


eLetters
No eLetters have been published for this article.