Introduction
Chickpea (Cicer arietinum L.) is one of the most important food legumes in different parts of the world. It serves as a good source of dietary protein, vitamins and minerals, also it improves soil fertility through symbiotic association with rhizobia (Acharjee and Sarmah, Reference Acharjee and Sarmah2013). In Algeria, chickpea is grown in more than 35,000 ha of land with an average productivity of above 10 q ha–1 (ITGC 2021). However, various challenges exist for chickpea as a crop coupled with diverse biotic and abiotic stresses. Therefore, identification of chickpea accession is important to reduce the impacts of disease, pests, drought and cold that interfere with plant cycles.
The diversity of all living things on earth is referred to as biodiversity, and it is essential for biological progress and survival (Rao and Hodgkin, Reference Rao and Hodgkin2002). According to Singh et al. (Reference Singh, Bisht and Dutta2014) germplasm refer to the total hereditary materials available in crop species and its wild relatives, also known as genetic resources or gene pool, which include inbred lines, landraces, open pollinated varieties, exotic accessions, wild species, cultivars and breeding stocks. Nguyen et al. (Reference Nguyen, Taylor, Redden and Ford2004) consider chickpea genetic background as narrow and that is threatened by the decreasing of its cultivation throughout the world. So efforts are displayed to alleviate this situation by releasing new well adapted cultivars (Bayahi and Rezgui, Reference Bayahi and Rezgui2015). Despite that, chickpea crop still suffering from the limited genetic basis available in the primary gene pool (Upadhayaya et al., Reference Upadhyaya, Dwivedi, Baum, Varshney, Udupa, Gowda, Hoisington and Singh2008; Roorkiwal et al., Reference Roorkiwal, Von Wettberg, Upadhyaya, Warschefsky, Rathore and Varshney2014; Pavan et al., Reference Pavan, Lotti, Marcotrigiano, Mazzeo, Bardaro, Bracuto, Ricciardi, Taranto, D'Agostino, Schiavulli and De Giovanni2017). Even if, the limited hybridization of wild chickpea with the cultivated species due to reproductive barriers (Rao et al., Reference Rao, Reddy and Bramel2003), they remain an important source of resistance to multiple stresses. However, the valuable genetic resources present in the primary gene pool comprising progenitor species can be successfully utilized for genetic enhancement (Singh et al., Reference Singh, Bisht and Dutta2014), and can increase grain yield (Choudhary et al., Reference Choudhary, Khanna, Jain, Bharadwaj, Kumar, Lakhera and Srinivasan2013). However, the lack of evaluation and documentation of Algerian chickpea associated with its low utilization represent major constraint limiting crop production, it rely basically on introduced varieties from ICARDA nurseries and landraces used by farmers in very restraint area. Again, the majority of 19th-century studies were untraceable, except for the work of Laumont and Chevassus (Reference Laumont and Chevassus1956) surveying Algerian chickpea improvement history, mentioning the characteristics of cultivated varieties in that epoch such as Abdellys, Ain Timouchent, Oran, Misserghin, Mogador, Sidi Bel Abbes, Tessalah. Those local varieties and/or domesticated genotypes since than dispersed and many are lost, however some are still present on limited fields surfaces with undetermined names. A few morphological characters and geographic distribution are commonly used for classification of chickpea into two main cultivar groups (Kumar and Abbo, Reference Kumar and Abbo2001). Chickpea is grouped into two type based on shape, size and colour of the seed: Kabuli cultivars are white to cream coloured and used almost exclusively for cooking whole seeds as a vegetable, Desi cultivars are wrinkled at beak with brown, light brown, fawn, yellow, orange, black or green colour (Ahmad et al., Reference Ahmad, Gaur and Croser2005; Miao et al., Reference Miao, Zhang and Jiang2009; Agarwal et al., Reference Agarwal, Jhanwar, Priya, Singh, Saxena, Parida, Garg, Tyagi and Jain2012) this type are normally uncoated to directly cooked or milled to flour. In addition, the Desi type, grown mainly in the Indian subcontinent and East Africa, is characterized by pink flowers and small seed (100- to 200 mg), the Kabuli type, native to the Mediterranean and Near-East region, possess white flowers and larger seed (200- to 680-mg) (Kumar and Abbo, Reference Kumar and Abbo2001). Therefore, morphological and parametric evaluation of chickpea's germplasm including landraces and improved varieties, is a critical step to identify the interesting traits such as plant height, productivity in drought condition and disease response, which are the most challenging stresses in the area and on the other hand display their resemblance to enhance their futures uses and fulfil knowledge gap.
In light of that, the current study aims to analyse the genetic diversity among 56 chickpea accessions differing in morphological traits, as well to provide a leading knowledge through documentation that ensure an effective use of conserved genetic resources, in attempt to study diversity including Ascochyta blight response from one part and the linked accession and traits from another part. This is achievable by the use of multivariate analysis techniques such as principal component analysis, cluster analysis and factor analysis, which are considered as a set of methods for investigating genotype diversity by identifying groups of genotypes that exhibit diverse traits and direct genotypic accession variation patterns to identify relationships between genotypes (Sharifi et al., Reference Sharifi, Astereki and Pouresmael2018).
Materials and methods
Site description
The study was conducted during two growing seasons 2020 and 2021, in a station of the Technical Institute of Field Crops (ITGC), located at Beni Slimane (36°13′09.8″N 3°13′49.1″E), Northeast of Algiers, Algeria. The field experiment was at an altitude of 672 m above mean sea level. The climate is semi-arid Mediterranean with a dry summer and cold winters, surface soils regularly undergoing drying-rewetting cycles from the irregular distribution of rainfall. The average annual rainfall at this area over the last 20 years was 430 mm; with a maximum of rainfall in December and January, and a minimum in July and August. The mean annual rainfall while it was 462 and 483 mm for 2020 and 2021, respectively. The mean annual temperature over two growing seasons was 19.4°C with mean minimal values of 15.7°C in January and mean maximal values of 22.1°C in July and August.
Plant material and field conditions
Fifty six chickpea national and international accessions collected from farmers and Technical Institute of Field Crops in the North of Algeria (online Supplementary Table S1), covering the most popular leguminous growth areas, including Ain-Timouchent, Tlemcen, Sidi Bel Abbes, Saida, Tiaret, Ain-Defla, Medea, Bouira, Setif, Constantine, Mila, Guelma, El-Taref and Skikda. The experiment was carried out based on a randomized complete block design with two replications, using 50 × 10 cm spacing and three-row plots of 4 m length. The size of plot was 1.5 × 4 m rows (6 m2). Plants were fertilized with 35 kg ha–1 nitrogen from Urea and 70 kg phosphorus ha–1 from Super Phosphate Triple. With the exception of fungicide and pesticide, agronomic practices were applied to ensure steadily growing plants. Field trials were conducted in late January and harvested in late June over two seasons.
Plant growth evaluation
All the accessions were studied mainly for morphologic characterization based on UPOV (The International Union for the Protection of New Varieties of Plants) script available online (https://www.upov.int/edocs/tgdocs/en/tg143.doc). Qualitative traits including seed colour (SDC) and shape (SDS), plant attitude (ATT) and intensity of ramification (RMF), green colour intensity on foliage (FIGC) and pod (PIGC), leaflet size (LFS) and flower colour (FC), were observed and recorded in every years to check uniformity and stability (online Supplementary Figs S1 and S2). As well for measurement of quantitative traits including seed yield (SY), number of days to flowering (DF), number of days to maturity (DM), number of days from flowering to maturity (DFM = DM – DF), plant height (PH), percentage of pods with one seed (OSD), peduncle length (PCL), pod length (PDL) and one hundred seed weight (HSW), were measured in every years. Yield was recorded on basis of plot then converted to kg ha–1. We also used a 1–9 scale, developed by Singh et al. (Reference Singh, Hawtin, Nene and Reddy1981) for disease rating, showing resistance score related to the appeared symptoms that explain the severity of Ascochyta blight (ASCHO) on plants at maturity.
Statistical analysis
The entire collected data include 09 quantitative and 10 qualitative variables, was subjected to statistical analysis using R software version 4.1.1 (R Core Team, 2021). Analysis of variance (one way ANOVA), minimum, maximum, mean, standard deviation and coefficient of variation of quantitative traits were computed using the ‘stats’ package at 5% probability for significance between differences. For dimension reduction, we used factor analyses of mixed data (FAMD) algorithm implemented under FactoMineR package (Husson et al., Reference Husson, Josse, Le, Mazet and Husson2016). Kassambara (Reference Kassambara2017) consider the FAMD as a principal component method that deal with both numeric and categorical variable in a single set of data, it can acts as principal component analysis for quantitative variables and a multiple correspondence analysis for qualitative variables. Ending with clustering individuals to understand the similarity between accessions using Euclidean distance and ward's method of linkage based on multidimensional variance.
Results
Univariate analysis
The data met the assumption for homogeneity of variance as shown by Levene's test for both seasons and replications, with a P value > 0.05 for all traits (Table 1). The analysis of variance indicates high significant differences among chickpea's accessions for all measured traits (P < 0.001). However, the ratio of the standard deviation to the mean (CV %), indicate the level of dispersion around the mean (Table 1).
Table 1. Homogeneity of variances and descriptive statistics for the quantitative traits
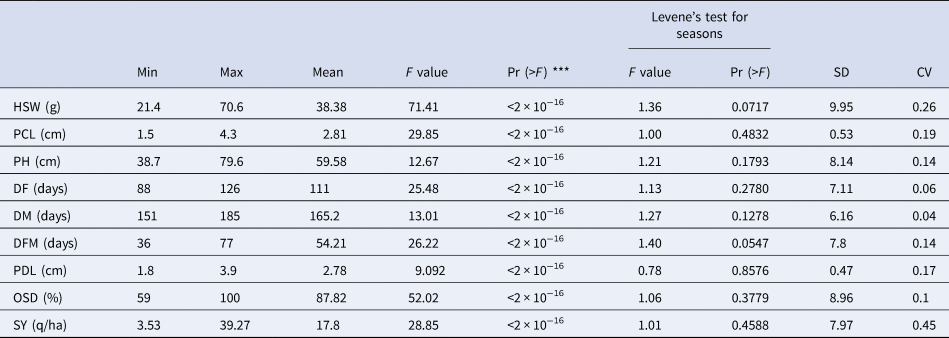
hundred seed weight (HSW), peduncle length (PCL), plant height (PH), of days to flowering (DF), number of days to maturity (DM), number of days from flowering to maturity (DFM), pod length (PDL), percentage of pods with one seed (OSD), seed yield (SY), standard deviation (SD), coefficient of variation (CV).
Significance codes: 0 ‘***’ 0.001 ‘**’ 0.01 ‘*’ 0.05 ‘.’ 0.1 ‘ ’ 1.
Factor analysis
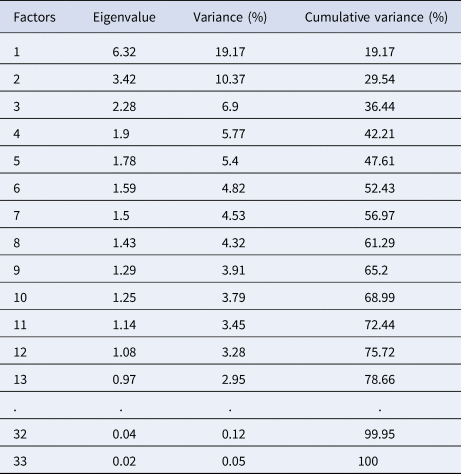
The dimensions reduction performed on 19 mixed data, under FAMD algorithm shows a highest percentage of explained variances of 19.17% decreasing to 0.02%, corresponding to an eigenvalue of 6.34–0.04 respectively. The first twelve 12 dimensions were obtained with eigenvalues > 1 (Table 2). The first plane contains 29.54% of explained variance, it expresses a significant structure in the data comparing it with normally distributed one (see Husson and Pagès Reference Husson and Pagès2011, Appendix).
Table 2. Eigenvalues and the corresponding explained variances of each factor
Following FAMD analysis, the position of quantitative variables is estimated on the generated dimensions after data standardization (Fig. 1), the most distant variables to the origin of the graph, measures the quality of the variables on the factor map. Furthermore, the OSD is less contributing on the plane and followed DF vector, displaying a first group. Variables such HSW, PCL, PDL and DFM are highly and positively correlated among each other constituting a second group, but negatively with both DM and PH that establish a third group. However, DM is located between these two groups and positioned perfectly on the opposite side of SY, revealing a negative correlation.
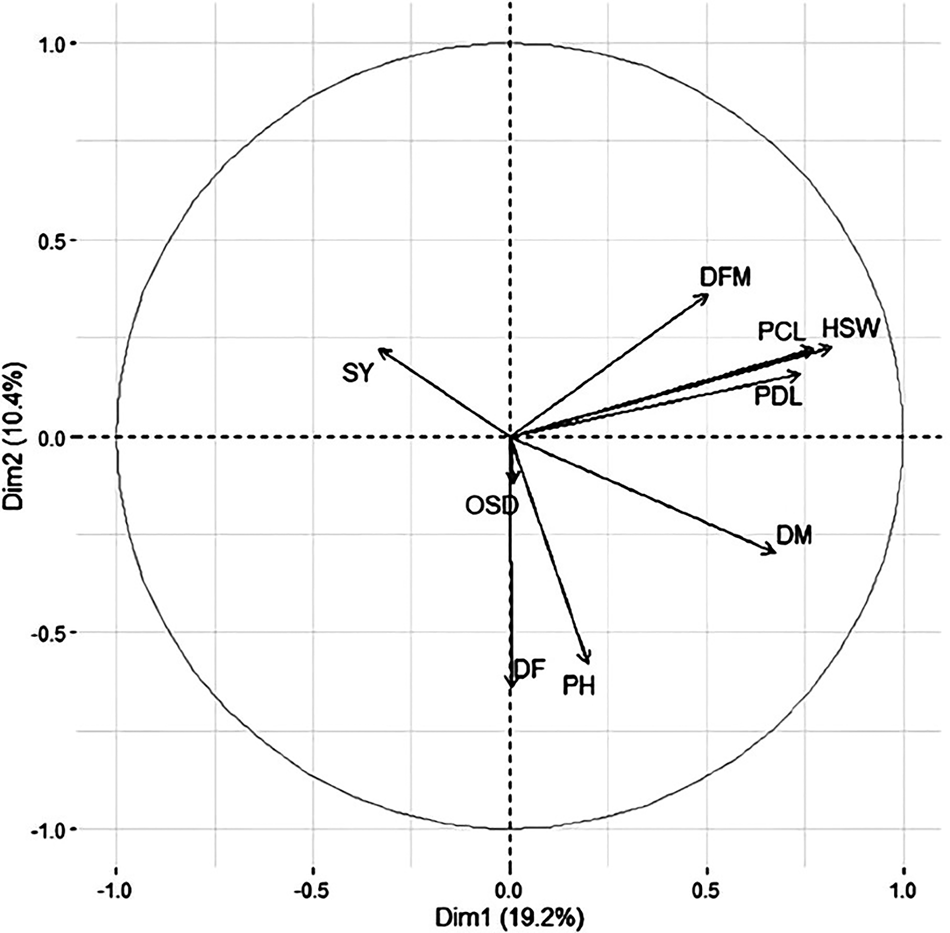
Figure 1. Graphical representation of quantitative variables distribution on the first two dimensions.
Cluster analysis
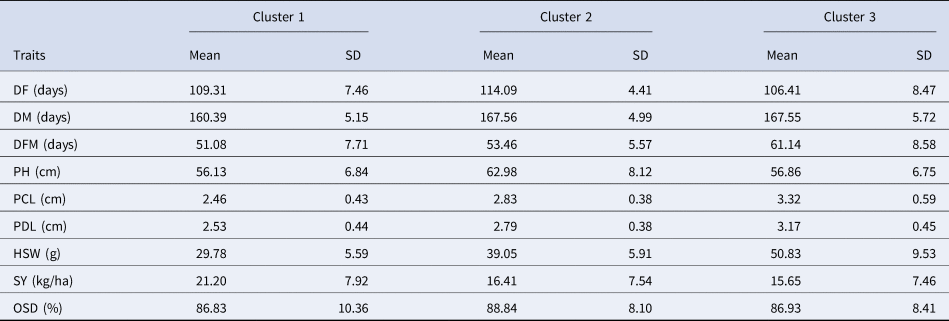
Cluster analysis helps to group the genotypes formed on individual's similarity. Based on the Dendrogram (Fig. 2) and the coating using the confidence ellipses around the mean of groups (Fig. 3), the clustering pattern relatively showed the existence of a three distinct cluster cluster 1, cluster 2 and cluster 3 carry 18, 27 and 11 genotypes respectively. Means and standard deviation for each clusters are given in Table 3.

Figure 2. Dendrogram illustrating genetic relationship of 56 chickpea (C. arietinum L.) genotypes using 19 traits.
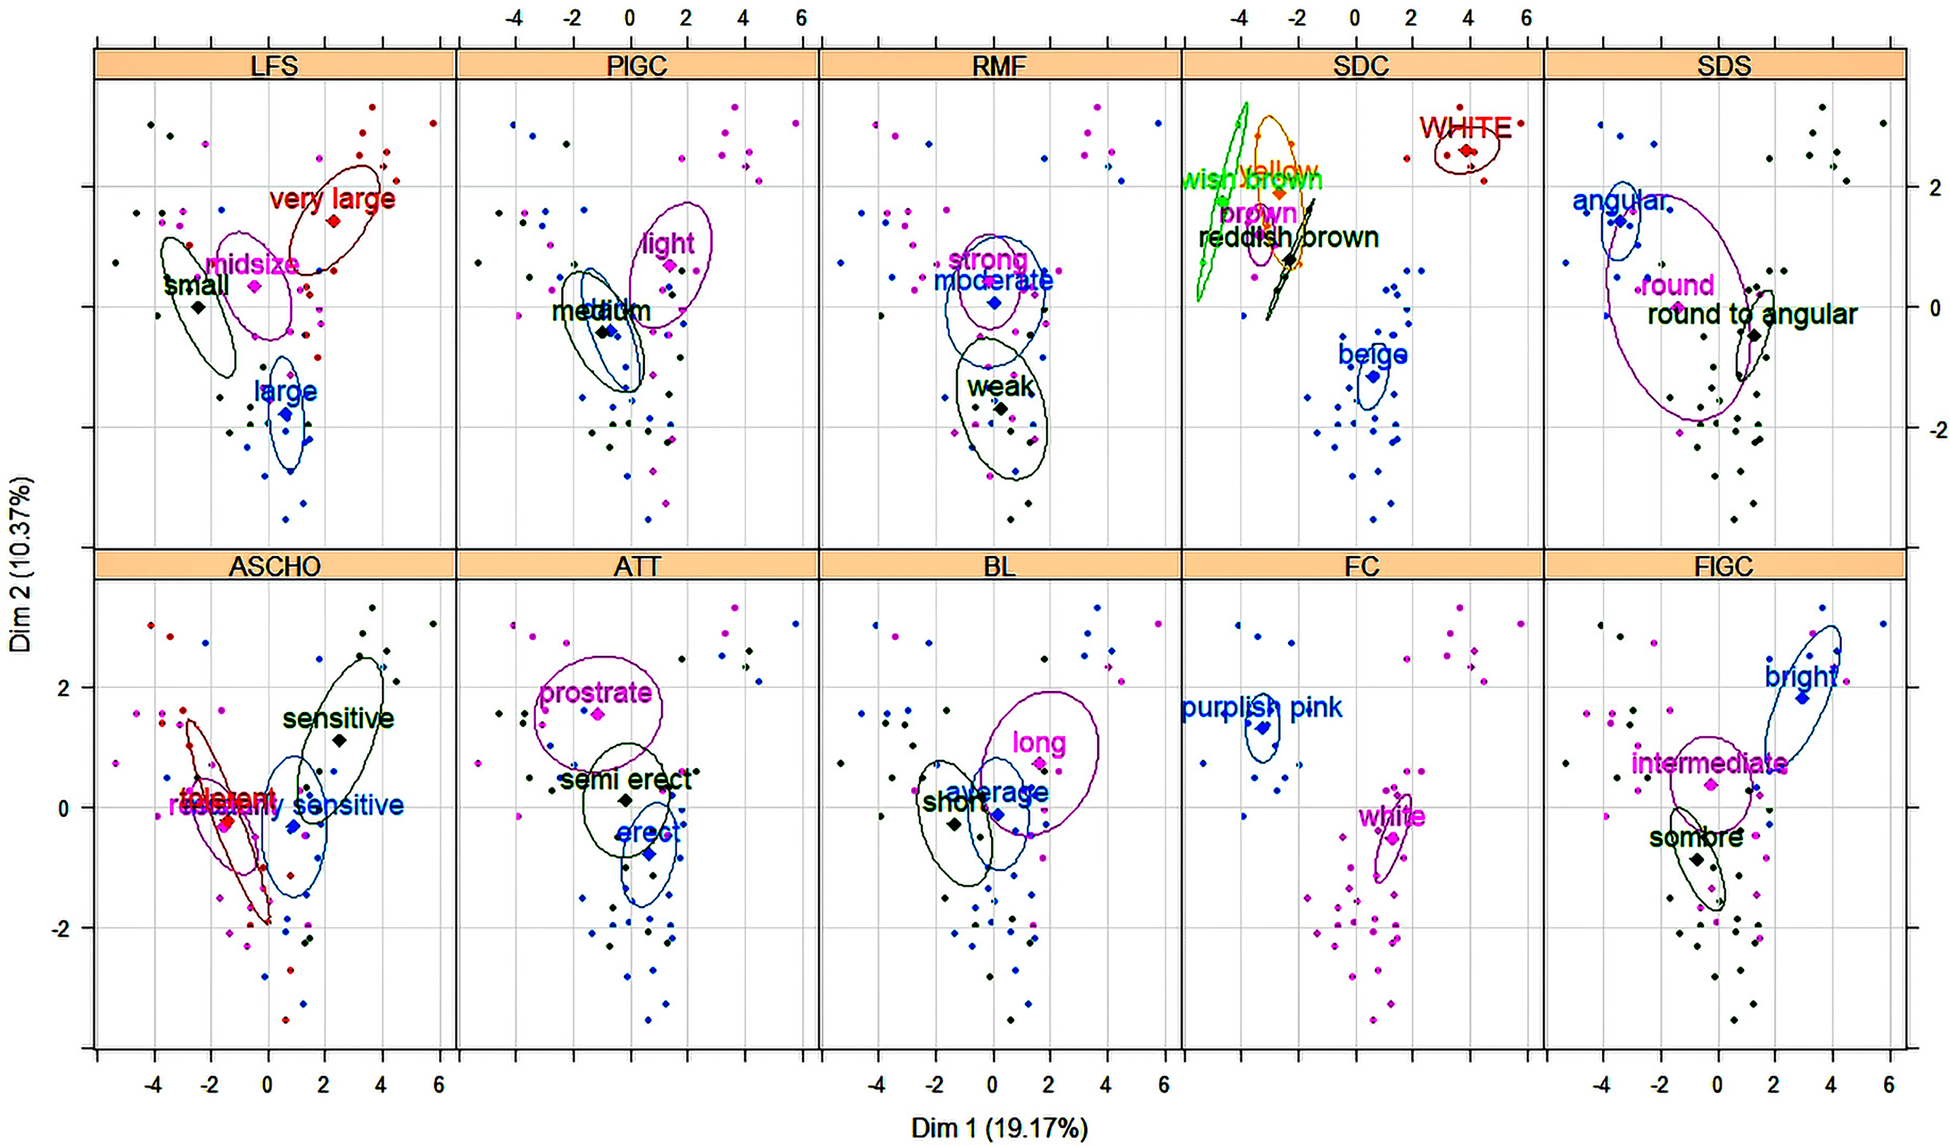
Figure 3. Individuals' distribution using confidence ellipses around categorical variables.
Table 3. Average and standard deviation of quantitative variables for each cluster
Discussion
Regarding phenology, the most crucial qualities for a chickpea's ability to adapt to various agro-climatic situations especially short season environments; are early flowering and early maturity (Gaur et al., Reference Gaur, Samineni, Tripathi, Varshney and Gowda2015). Chauhan et al. (Reference Chauhan, Ryan, Chandra and Sadras2019) improved the limited model to predict flowering time relying on temperature and photoperiod, by adding soil moisture, hence we suspect that drought and heat stress in semi-arid experimentation extended chickpea DF [92.5–124.5 days], represented by accession NCR_147 and NCR_103 respectively. This is slightly inconsistent with ICARDA's result of selection strategy for Mediterranean environments, showing mean number of days to 50% flowering never occurred before 130 days from late December germination (Singh and Reddy, Reference Singh and Reddy1996). Reduced crop duration may also help chickpea escape damage by the limited moisture that mostly affect the crop at podding stages (Kumar and Abbo, Reference Kumar and Abbo2001). Consequently, when there is a severe drought during April to May, accessions with low DFM are preferred to grow in purpose to capture maximum amount of available water before evaporation reach its upper level. Moreover, this is the main reason to push our focus on podding stage rather than the entire crop length, which is directly impacted by DF since it represent a part of plant cycle.
In general, plants attain a height of 20–100 cm, although tall cultivars under favourable conditions can grow up to 130 cm (Singh, Reference Singh1997). This indicates that our accessions carry an intermediate value (38–79 cm). Peduncle length could be classified as short (<5 mm), medium (5–10 mm) and long (>10 mm) such as cultivar Nil, BRC-305 and CCV15118 respectively (Biswal et al., Reference Biswal, Solanki, Prajapat, Shiv and Babbar2021), our result listed PCL range from 1.5 to 4.3 cm, which could be classified according to the previous scale into one single group. Nonetheless, a gap of 4.3–1.0 = 3.3 cm is huge to be considered identical or similar, thus we chose to work with quantitative data since the discretization had a greater impact on grouping individuals, and this involves the remaining quantitative variables as well including OSD. Under rainfed conditions, PDL showed a representative discrimination among accessions that could express high value under controlled conduct; as mentioned by Bicer et al. (Reference Bicer, Kalender and Sakar2004) that spring irrigation supply increase Pod length as well as HSW and SY. Singh et al. (Reference Singh, Holly and Bejiga1991) stated that the weight of 100 seeds varies from less than 8 g to more than 70 g, within this range, oscillate our results that showed a HSW between 22.2 and 66.8 g. Seed yield showed a most dispersed parameter around the mean (17.8 q × ha−1), suggesting a high distinguished performance of the studied accessions, with a difference of 35.74 q × ha−1 between maximum and minimum. However, SY is the outcome of numerous inter-correlated characters, which include yield components, such as plant/m2, seed/plant and HSW. In addition, Pundir et al. (Reference Pundir, Reddy and Mengesha1992) consider seeds per pods as a fourth component that determine yield.
Regarding dimension reduction our data allow us to get 33 dimensions out of 19 variables because each qualitative variable had at least two levels (such as flower colour that contain two available options, it could be either white or purplish pink). According to PCA graph (Fig. 1) the percentage of pod carrying only one seed, tend to go higher with lateness and tallness. Similar to our results, Anbessa et al. (Reference Anbessa, Warkentin, Bueckert and Vandenberg2007) found that days to flowering (DF) was positively associated with days to maturity (DM), Singh et al. (Reference Singh, Bejiga and Malhotra1990) also reported a positive and high correlation between DF and DM evaluated out of 3267 ICARDA's Kabuli accessions. However, The reason why maturity days move slightly toward the second group (HSW, PCL, PDL and DFM) is that it represents the entire plant life cycle that include the number of days from sowing to flowering plus from flowering to dried plant, which is positioned in the graph between DFM and DF at the opposite side of SY. Moreover, DFM and HSW are negatively correlated or had no correlation with DF as reported by Gaur et al. (Reference Gaur, Samineni, Tripathi, Varshney and Gowda2015). This indicates that when DF took long DFM tend to be smaller and when DM took high number of days than yield decreases. Furthermore, early flowering accessions allow the plant to grow rapidly and capture the late rainfall supply. In addition, pods size and peduncle was evaluated based on length and showed a strong positive correlation with seed weight and DFM. Its size varies greatly, but it is the trait that is least influenced by the environment (Singh, Reference Singh1997). Hossain et al. (Reference Hossain, Ford, McNeil, Pittock and Panozzo2010) also showed a close genetic relationship between seed size and weight by identifying two major complementary quantitative trait loci (QTL) and a low genotype × environment interaction (<6%) suggesting a limited environmental influence on this trait. Consequently, large seed is a defining characteristic of accessions with high HSW, making large pods noticeable for these accessions.
Beside seed per plant and plant density components, significant positive correlation in yield contributing traits was observed with plant height and negatively with 100 seed weight, as reported by Toker and Ilhan Cagirgan (Reference Toker and Ilhan-Cagirgan2004) and Singh and Singh (Reference Singh and Singh1989). Those are in harmony with our result, except for plant height, which is negatively correlated to seed yield, while HSW had negative impact on SY, this could be explained by the negative and significant relationships between number of pod per plant and 100 seed weight, reported by Talebi et al. (Reference Talebi, Fayaz and Jelodar2007). In light of that, the number of seeds per plant is more determinant than the HSW. However, other traits related to plant performance against biotic and abiotic stress, could affect SY as shown by plant reaction to Ascochyta blight (Toker and Ilhan Cagirgan, Reference Toker and Ilhan-Cagirgan2004). Accessions with high seed weight were more sensitive, they also share other character such as green colour intensity, whereas: accessions with dark green colour on leaflet had tendency to resist to the available Ascochyta blight. Moreover, studies on the impact of climate change on chickpea production highlighted the effect of warmer temperatures on crop development and subsequent chickpea yield, the yield of chickpea declined by up to 301 kg/ha per 1°C increase in mean seasonal temperature in India (Devasirvatham Reference Devasirvatham2013). Singh (Reference Singh1997) also reported that the percentage of flowers and pods abscised varied with sowing date and cultivar. In addition, pod filling is highly dependent on weather (Pundir et al., Reference Pundir, Reddy and Mengesha1992).
The number of entries among clusters reflects the diversity and similarity among accessions. Cluster 1 contain almost 32.14% of total accessions and were characterized by low HSW, PCL and PDL, a medium DF and PH, earliness in DM, low DFM and high yielding. Cluster 2 classify 48.21% of total accessions with medium HSW, PCL, PDL, DM, DFM, SY, late DF and a highest PH value. 19.64% of accessions are contained within cluster 3, characterized by low SY, high HSW, PCL and PDL, a medium PH and DM and an early flowering (Fig. 3). However, seed filling rate and maximum seed weight of chickpea decreased with decreasing water supply (Ghassemi-Golezani and Ghassemi, Reference Ghassemi-Golezani and Ghassemi2012). Nevertheless, the highest yielding accessions, highest seed yield per plant and lowest 100 seed weight were obtained by Desi type, As pointed out by Davies et al. (Reference Davies, Turner, Palta, Siddique and Plummer2000) that better drought tolerance in Desi type is partly a consequence of better remobilization of C and N and higher pod number. Similar to the previous classification, cluster 1 involve Desi type, characterized by a: small seed, purplish pink flower, coloured and angular seed, strong ramification, short beak length, small leaflet size, intense green colour on leaf and dark to moderate on pods, tolerance to resistance to Ascochyta blight and finally a variable attitude (prostrate, semi erect and erect). Furthermore, cluster 2 and 3 group Kabuli type sharing: a white flower colour, medium DM, round to angular seed's shape. Nevertheless, many differences are recorded between the two-Kabuli clusters as mentioned above for quantitative traits. In addition, cluster 3 recorded light green colour in both pod and foliage, whitish seeds and the most sensitive group to Ascochyta blight. While cluster 2 group beige seeds, erect to semi erect growth habit, variable value of; ramification (strong, medium and weak), green colour intensity, beak length, leaflet size and even different level of response to Ascochyta blight (Fig. 3). According to Hasan and Deb (Reference Hasan and Deb2013) flower colour is the most important diagnostic character in chickpea and is widely used as a marker gene in genetic studies and breeding work, most of the ‘Desi’ types are either semi-erect or semi-spreading. Seed colour as well is an important distinguishing feature and Desi chickpeas are the most colourful seed, which is in harmony with our findings.
Conclusion
Fruitful results are obtained through 19 agro-morphological trait evaluation, as an essential step towards diversity analysis of chickpea. The previous results indicated the presence of considerable diversity among the studied accessions, which contribute to documentation's enhancement by providing useful information to ensure continuity between the collection of genetic resources and its utilization. Additionally, the targeted variables are indispensable for chickpea improvement of productivity, such as earliness, disease resistance and plant height for machine harvesting purposes. However, it does not escape our notice that the germplasm collection should be evaluated against other biotic and abiotic stresses in further studies, targeting other important traits such as insect and herbicide tolerance, in aim to be widely used for such an important crop that provides dietary proteins to humans and ameliorates soil fertility.
Supplementary material
The supplementary material for this article can be found at https://doi.org/10.1017/S1479262123001065
Acknowledgments
The authors are grateful to the technical institute of field crop for the support we received from its experimental stations during the collections missions, as well as hosting our experiment to achieve this study. We also acknowledge the many farmers in Algeria who provided useful information and accessions, without which this study could not have been completed.


