Introduction
Several polymetallic ore deposits were exploited in the Peloritani Mountains, northeastern Sicily, Italy, where small Pb–Zn–Fe–As–Sb–Cu–Ag–W–(Au) ore bodies are hosted within tectonic slices affected by both Variscan and Alpine tectono-metamorphic events. Previous authors focused their attention mainly on primary ore minerals (e.g. Saccà et al., Reference Saccà, Saccà and Nucera2015, and references therein), whereas little is known about secondary phases occurring in these mineralisations. Some oxides (cervantite, goethite and stibiconite), carbonates (azurite, hydrozincite, malachite and smithsonite), sulfates (anglesite), phosphates (pyromorphite) and arsenates (annabergite, erythrite, scorodite and symplesite) have been reported (Seguenza, Reference Seguenza1856; La Valle, Reference La Valle1898, Reference La Valle1899; Traina, Reference Traina1905; Baldanza, Reference Baldanza1950; Triscari and Saccà, Reference Triscari and Saccà1982, Reference Triscari and Saccà1984; Triscari, Reference Triscari1985; Saccà et al., Reference Saccà, Saccà, Nucera, De Fazio and D'Urso2007). However, the geochemistry of the ore bodies suggests the possible existence of other secondary compounds. Their study is not a trivial exercise, because they could play an important role in controlling the geochemical behaviour of several potentially toxic elements (PTE).
De Vivo et al. (Reference De Vivo, Lima, Catalano and Chersicla1993) pointed out the presence of anomalies of As, Hg, Sb, Zn and Pb in stream sediments from the Peloritani Mountains. Cosenza et al. (Reference Cosenza, Lima, Ayuso, Foley, Albanese, Messina and De Vivo2015) investigated the soil geochemistry in this area, reporting high contents of PTE such as As, Zn, Sb and Pb. One of the two anomalous areas found in this region is located between Fiumedinisi, Budali and Alì, and Pb isotopes indicate a geogenic contribution to this contamination, related to the weathering of ore deposits and mine wastes in the area studied.
In the framework of a survey of the mineralogy of the Peloritani Mountains, a sample of galena-bearing quartz vein was sampled from the adit of one of the tunnels belonging to the abandoned Tripi mine, Alì, Messina Province. The observation of this sample under the binocular microscope revealed the occurrence of alunite-supergroup minerals encrusting thin fissures in the quartz vein. One of them formed yellow equant grains, whose chemical composition indicated its classification as kintoreite, a relatively uncommon phase first described by Pring et al. (Reference Pring, Birch, Dawe, Taylor, Deliens and Walenta1995) from Broken Hill, New South Wales, Australia.
There are several reasons for characterising this new occurrence of kintoreite. From an environmental perspective, this phase, whose origin is related to the weathering of primary ores, could be a potential host for the Pb anomaly observed in soils in the Alì area (Cosenza et al., Reference Cosenza, Lima, Ayuso, Foley, Albanese, Messina and De Vivo2015), in agreement with previous studies showing the presence of nanoparticles of kintoreite in soils (e.g. Schindler and Hochella, Reference Schindler and Hochella2017). Moreover, the finding of kintoreite from the Peloritani Mountains is the third Italian occurrence of this mineral, following the identification reported by Albertini (Reference Albertini and Manni2014) from the Monte Falò mine, Piedmont, and by Guastoni et al. (Reference Guastoni, Gentile and Soldani2018) from the nearby locality of Chiotta Strivera, Piedmont. Only few data are reported for these occurrences and no crystal-chemical characterisation was performed. Finally, kintoreite from the Tripi mine is enriched in Al and S and consequently its full description can provide interesting insights on the crystal chemistry of alunite-supergroup minerals.
Geological background
The Peloritani Mountains represent the southernmost portion of the Calabria–Peloritani Arc, an arc-like structure that connects the Apennines with the Maghrebian Chain. It is delimited by the Pollino line, in the north, and the Taormina line, in the south (Messina et al., Reference Messina, Somma, Macaione, Carbone and Careri2004, and references therein). This mountain belt is formed by the stacking of several tectonic units. Ore bodies are hosted mainly in the Mandanici Unit, a tectonic slice formed by low- to medium-grade metamorphic rocks affected by the Variscan orogeny; the Alpine event gave rise to cataclastic-to-mylonitic processes (Ferla and Meli, Reference Ferla and Meli2007; Carbone et al., Reference Carbone, Messina and Lentini2007, and references therein). The actual genesis and evolution of the ore deposits of the Peloritani Mountains have been debated by several authors (e.g. Ferla, Reference Ferla1982/1983; Ferla and Omenetto, Reference Ferla and Omenetto2000; Saccà et al., Reference Saccà, Saccà, Nucera and Somma2003).
Among the most important mining sites, the Tripi mine (38°00’50”N; 15°24’27”E) is located some hundred metres SSW of the small hamlet of Alì, Messina Province, Sicily. It exploited a stratabound fine-banded ore, composed mainly of sphalerite and Ag-bearing galena, with rare pyrite and trace amounts of chalcopyrite, arsenopyrite, pyrrhotite and covellite; quartz and fluorite are gangue minerals (Saccà et al., Reference Saccà, Saccà, Nucera, De Fazio and D'Urso2007). Secondary products are smithsonite, gypsum, hydrozincite, ‘limonite’ and malachite (Saccà et al., Reference Saccà, Saccà, Nucera, De Fazio and D'Urso2007).
Experimental
Specimen studied
Kintoreite occurs as yellow equant crystals, up to 0.05 mm in size, on quartz, associated with another alunite-supergroup mineral currently under study (Fig. 1a). The sample studied is deposited in the mineralogical collection of the Museo di Storia Naturale of the Università di Pisa, under the catalogue number 19928.
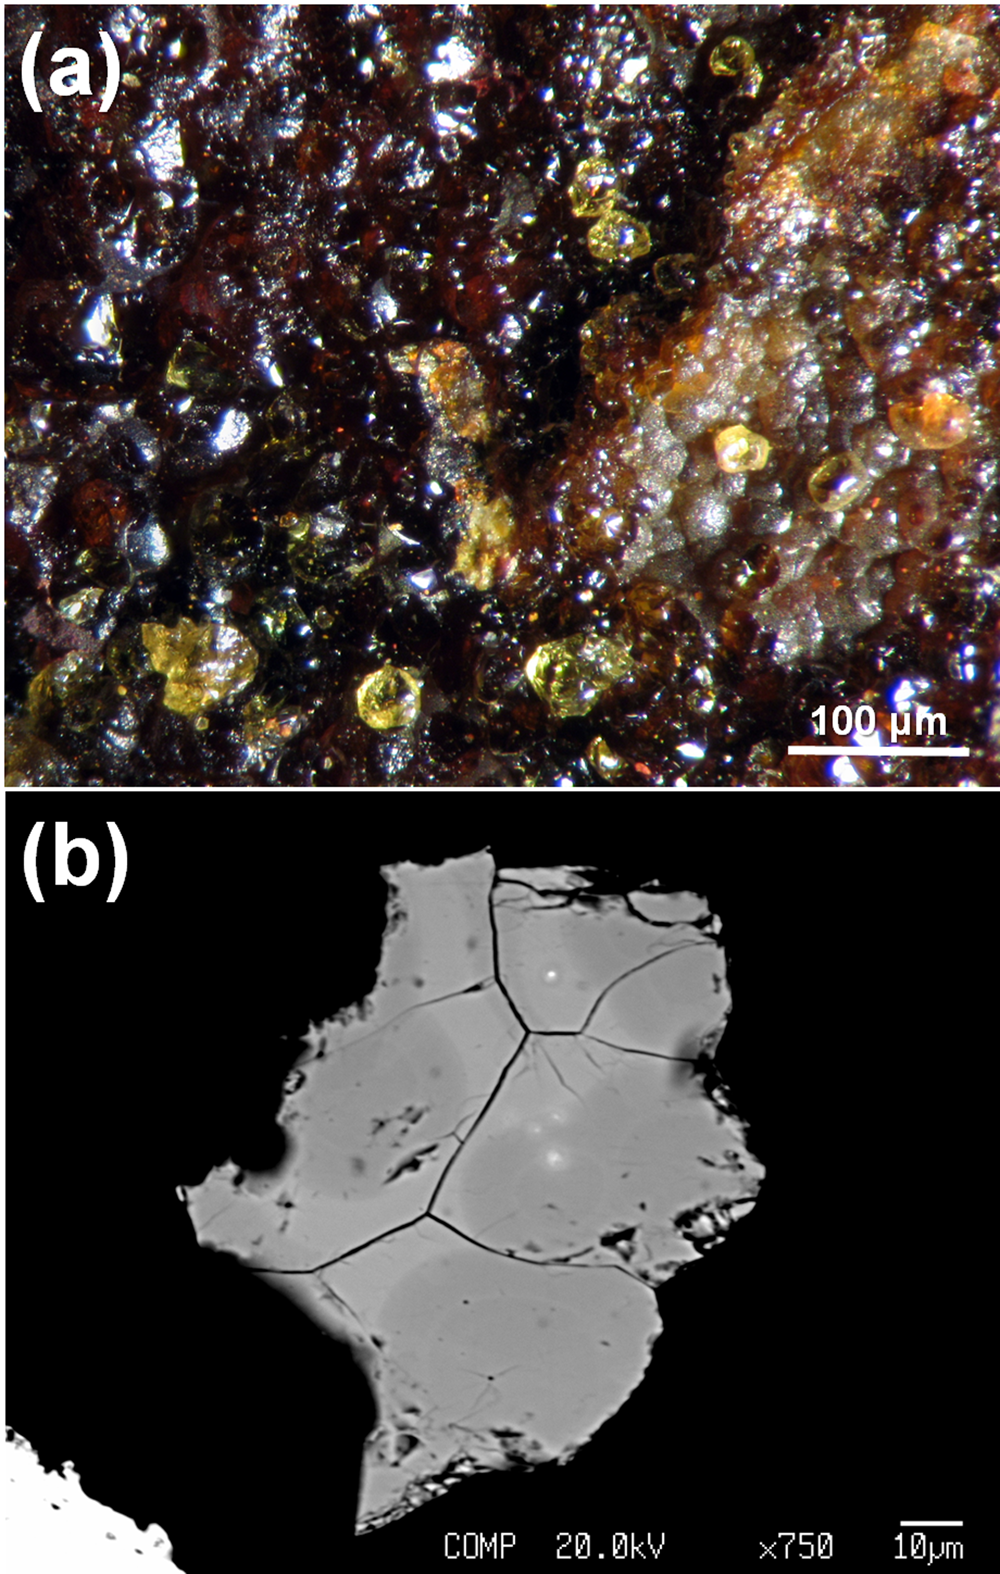
Fig. 1. Kintoreite from the Tripi mine, Alì, Messina Province, Sicily [Collection of the Museo di Storia Naturale, Università di Pisa; catalogue number 19928]. (a) Yellow equant crystals associated with another member of the alunite supergroup, still undetermined, brownish in colour. (b) Back-scattered electron image showing chemical inhomogeneity of kintoreite, with bright (Fe-rich) and dark (Al-rich) domains.
Chemical analysis
Quantitative chemical analyses were perfomed at the ‘Eugen F. Stumpfl’ laboratory, University of Leoben (Austria) using a Superprobe JEOL JXA 8200 electron microprobe (WDS mode, accelerating voltage = 20 kV, beam current = 10 nA and beam size = 1 μm). The following standards (element, emission line) were used: crocoite (PbKα), magnetite (FeKα), apatite (PKα), corundum (AlKα) and anhydrite (SKα). Other elements (K, Sr, Ba and As) were sought but were below the detection limit. The ZAF routine was applied for the correction of the recorded raw data. Counting times were 15 s for peak and 5 s for backgrounds. Table 1 gives chemical data.
Table 1. Electron microprobe data for kintoreite from the Tripi mine.
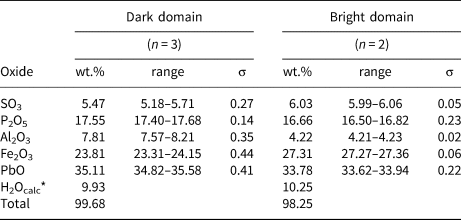
n = number of spot analyses. *Calculated in agreement with structural data. σ = estimated standard deviation.
Micro-Raman spectroscopy
Micro-Raman spectra were collected using a Horiba Jobin-Yvon XploRA Plus apparatus, equipped with a motorised x–y stage and an Olympus BX41 microscope with a 50× objective (Dipartimento di Scienze della Terra, Università di Pisa). Raman spectra were excited using the 532 nm line of a solid-state laser, attenuated to 25% (i.e. 6.25 mW) in order to avoid any potential sample damage. The minimum lateral and depth resolution was set to a few μm. The system was calibrated using the 520.6 cm–1 Raman band of silicon before each experimental session. Spectra were collected through multiple acquisitions (3) with variable counting times, ranging from 30 to 60 s. Back-scattered radiation was analysed with a 1200 gr/mm grating monochromator. Raman spectra were processed using Fityk (Wojdyr, Reference Wojdyr2010), subtracting the background and fitting the spectra to theoretical peak shapes using Voigt functions. Experimental precision can be estimated at ± 2 cm–1.
X-ray crystallography
Single-crystal X-ray diffraction data were collected at the Dipartimento di Scienze della Terra, Università di Pisa, Italy, using a Bruker Apex II diffractometer operating at 50 kV and 30 mA and equipped with an air-cooled Photon II CCD detector. Graphite-monochromatised MoKα radiation was used. The detector-to-crystal working distance was set to 50 mm. Intensity data were integrated and corrected for Lorentz, polarisation, background effects and absorption using the APEX3 software package (Bruker AXS Inc., 2016). Crystal structure refinement was performed using Shelxl-2018 (Sheldrick, Reference Sheldrick2015) starting from the atomic coordinates given by Kharisun et al. (Reference Kharisun and Bevan1997) for kintoreite. Neutral scattering curves were taken from the International Tables for Crystallography (Wilson, Reference Wilson1992). The following scattering curves were used: Pb at the Pb site, Fe at the Fe site, P at the P site, and O at the O(1)–O(3) sites. After several cycles of isotropic refinement, the R 1 factor converged to 0.0674, thus confirming the correctness of the structural model. Taking into account chemical data, the site occupancy at the Fe site was refined using the scattering curves of Fe vs. Al, improving the quality of refinement to R 1 = 0.0447. Owing to the similar scattering factors for P (Z = 15) and S (Z = 16), only the scattering curve of the former was used. Introducing the anisotropic displacement parameters for all atoms decreased the R 1 to 0.0376. However, Pb was negatively defined and consequently the final model was refined using anisotropic displacement parameters for all atoms but Pb. A maximum residual, interpreted as an H atom bonded to O(3), was located in the difference-Fourier map and a restraint on the O(3)–H bond distance was added. The refinement converged to R 1 = 0.0415 for 226 unique reflections with F o > 4σ(F o) and 31 least-square parameters. Details of data collection and structure refinement are in Table 2, whereas atomic coordinates and displacement parameters are shown in Table 3. Bond distances and bond-valence sums, calculated according to the bond parameters of Gagné and Hawthorne (Reference Gagné and Hawthorne2015), are given in Tables 4 and 5, respectively. The crystallographic information file has been deposited with the Principal Editor of Mineralogical Magazine and is available as Supplementary material (see below).
Table 2. Summary of crystal data and parameters describing data collection and refinement for kintoreite from the Tripi mine.
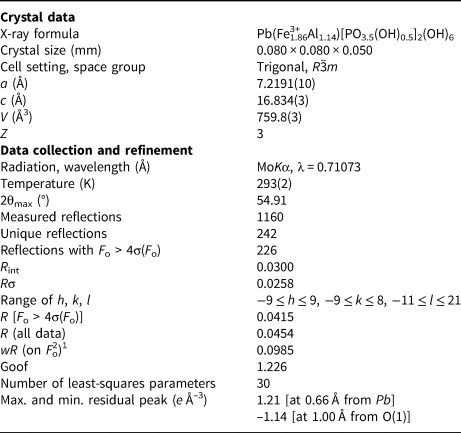
1w = 1/[σ2(F o2)+(0.0252P)2+41.9069P], where P = (F o2+2F c2)/3.
Table 3. Sites, Wyckoff positions, site occupancy factors (s.o.f.), fractional atom coordinates and isotropic (*) or equivalent isotropic displacement parameters (Å2) for kintoreite from the Tripi mine.

Table 4. Selected bond distances (Å) for kintoreite from the Tripi mine.
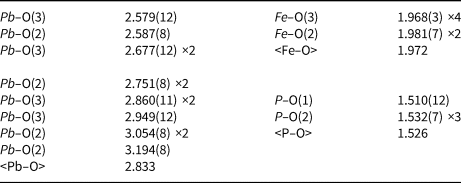
Table 5. Weighted bond-valence sums (in valence unit) for kintoreite from the Tripi mine.
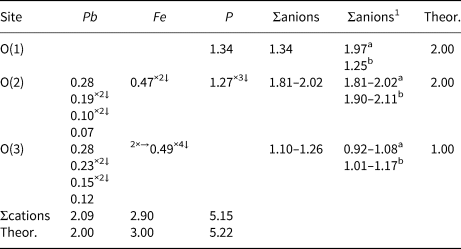
Note: left and right superscripts indicate the number of equivalent bonds involving cations and anions, respectively. The site occupancies (Fe0.68Al0.32) and (P0.78S0.22) were used for calculating the bond-valence sums at Fe and P sites. 1 Corrected for H-bonds. a O(1) acting as acceptor of H-bonds. b O(1) acting as donor of H-bonds.
Results and discussion
Chemical data
The back-scattered electron image of the grain studied revealed a compositional inhomogeneity (Fig. 1b), with dark and bright domains, related to different Fe/Al atomic ratios. Electron microprobe data were recalculated on the basis of 14 O atoms per formula unit (apfu), calculating the amount of H2O in order to constrain the sum of (P + S) to 2 apfu. The darker domains have the chemical formula Pb1.00(Fe3+1.89Al0.97)Σ2.86[P1.57S0.43O7.43(OH)0.57][(OH)5.58(H2O)0.42]Σ6.00, whereas the brighter ones correspond to Pb0.98(Fe3+2.21Al0.53)Σ2.74[P1.51S0.49O7.49(OH)0.51][(OH)5.18(H2O)0.82]Σ6.00.
To the best of our knowledge, the sample from the Tripi mine has the highest S content among kintoreite occurrences reported in literature. Kharisun et al. (Reference Kharisun and Bevan1997) described a kintoreite with a significant As and S substitution for P, i.e. 0.40 As apfu and 0.30 S apfu. On the contrary, several findings from Slovakia and the Czech Republic have negligible S contents (Pauliš et al., Reference Pauliš, Toegel and Jebavá2012; Števko et al., Reference Števko, Sejkora and Malíková2016; Vrtiška et al., Reference Vrtiška, Malíková, Dolníček and Sejkora2019, Reference Vrtiška, Sejkora, Dolníček and Malíková2021). The substitution of Fe3+ by Al3+ in the octahedral site agrees with the wide substitution observed between kintoreite and plumbogummite, ideally PbAl3(PO4)(PO3OH)(OH)6, by other authors (e.g. Vrtiška et al., Reference Vrtiška, Malíková and Sejkora2016).
Micro-Raman spectroscopy
The Raman spectral features of kintoreite from the Tripi mine are shown in Fig. 2. Between 100 and 1200 cm–1 (Fig. 2a), two regions can be distinguished. The first one, between 900 and 1200 cm–1, is characterised by stretching modes of P–O bonds and, probably, of S–O bonds. In the second region, between 100 and 650 cm–1, bending modes of O–P–O and O–S–O bonds, as well as M–O (M = Pb, Fe and Al) and lattice vibrations occur. Observed bands agree with the general features described by Frost et al. (Reference Frost, Weier, Martens and Mills2006). The interpretation of the weak band at 820 cm–1, attributed to the occurrence of (AsO4) groups by Frost et al. (Reference Frost, Weier, Martens and Mills2006), is, on the contrary, uncertain; indeed, As was found to be below the detection limit in the sample studied from the Tripi mine. Moreover, Plášil et al. (Reference Plášil, Škoda, Fejfarová, Čejka, Kasatkin, Dušek, Talla, Lapčák, Machovič and Dini2014) interpreted some bands observed at 722, 812 and 859 cm–1 in the Raman spectrum of hydroniumjarosite as due to δ(OH) modes, in keeping with the chemistry of the kintoreite studied.
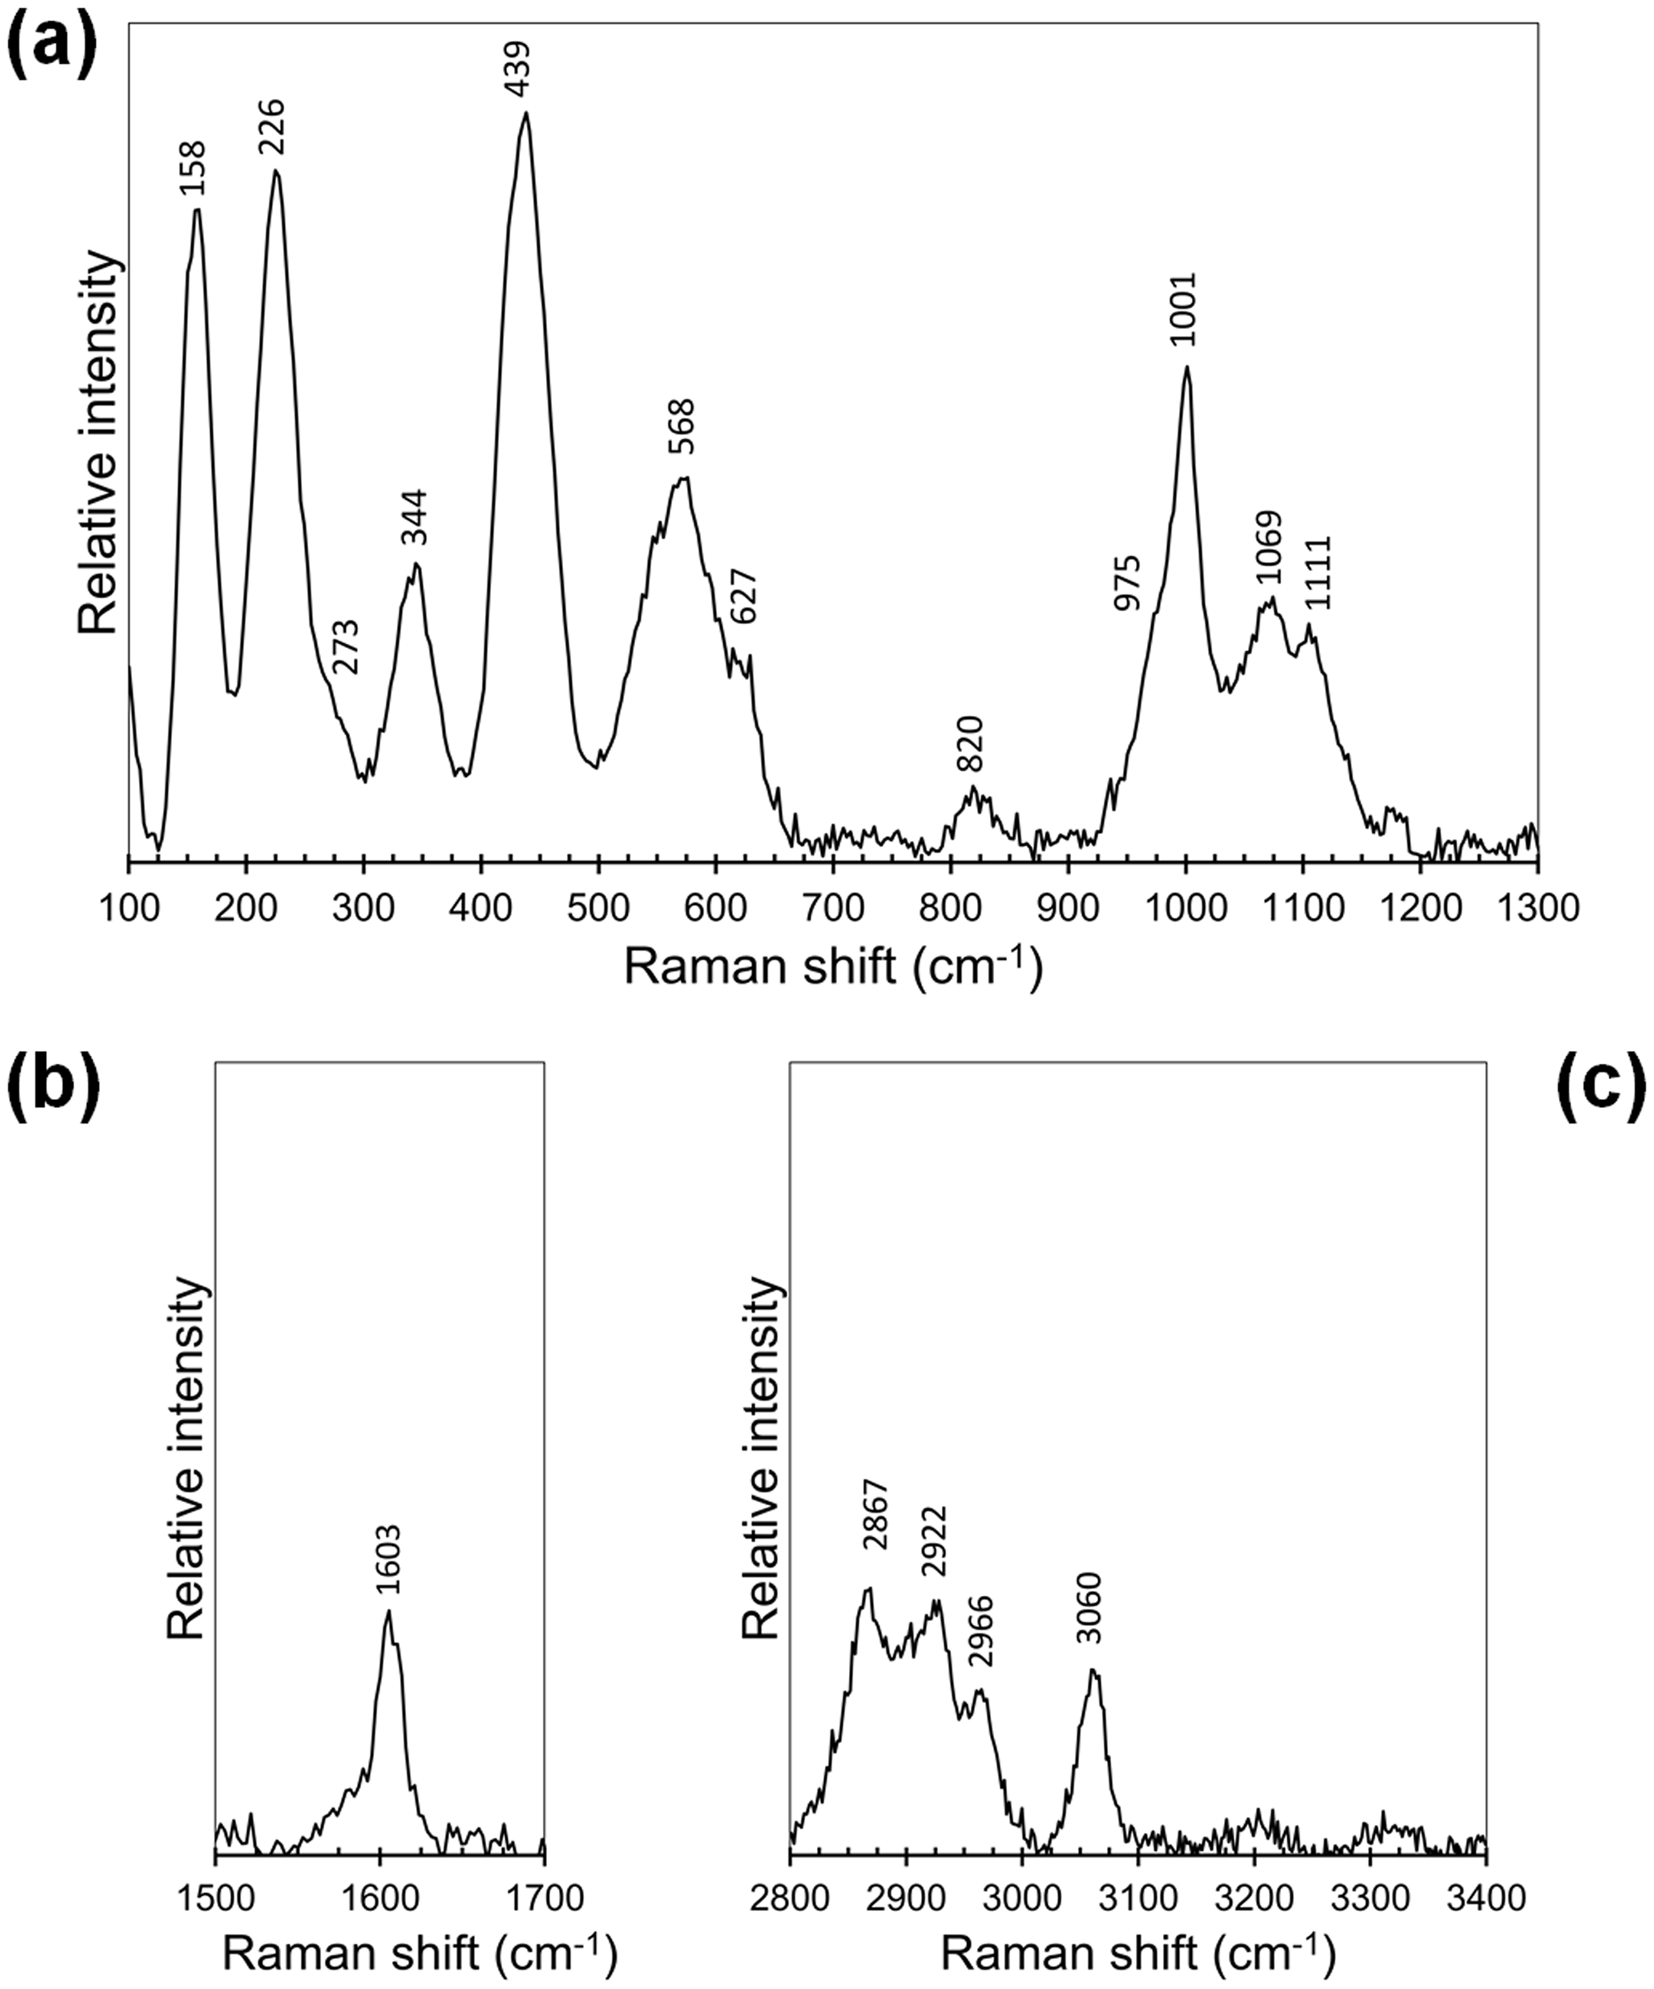
Fig. 2. Raman spectrum of kintoreite from the Tripi mine in the region (a) between 100 and 1300 cm–1; (b) 1500–1700 cm–1; and (c) 2800–3400 cm–1.
In the region between 1500 and 1700 cm–1, a weak band at 1603 cm–1 was observed (Fig. 2b); Frost et al. (Reference Frost, Weier, Martens and Mills2006) reported a Raman band at 1595.6 cm–1, attributed to the occurrence of H2O groups. Indeed, this could be interpreted as due to the O–H–O bending of H2O groups. The Raman spectrum of the studied material in the region between 2800 and 3400 cm–1 is different from that reported by Frost et al. (Reference Frost, Weier, Martens and Mills2006). In fact they observed a broad band related to the convolution of three components at 2967.8, 3224.6, and 3391.1 cm–1. On the contrary, in kintoreite from the Tripi mine (Fig. 2c). four weak bands were observed, three of them forming a relatively broad band between 2800 and 3000 cm–1, and the fourth one occurring as a relatively sharp band at 3060 cm–1.
Crystal-chemistry of kintoreite from the Tripi mine
Kintoreite is isotypic with other alunite-supergroup minerals, a series of phases having the general formula DG3(TO4)2(OH,H2O)6 (Stoffregen et al., Reference Stoffregen, Alpers, Jambor, Alpers, Jambor and Nordstrom2000); in the sample studied, D = Pb2+, G = (Fe,Al)3+ and T = (P5+ and S6+). The crystal structure is characterised by sheets of corner-sharing (Fe,Al)ϕ6 [ϕ = O2– and (OH)–] octahedra parallel to (0001) and decorated on both sides by (P,S)ϕ4 tetrahedra. Lead atoms are hosted within cavities occurring between the octahedral sheets (Fig. 3).
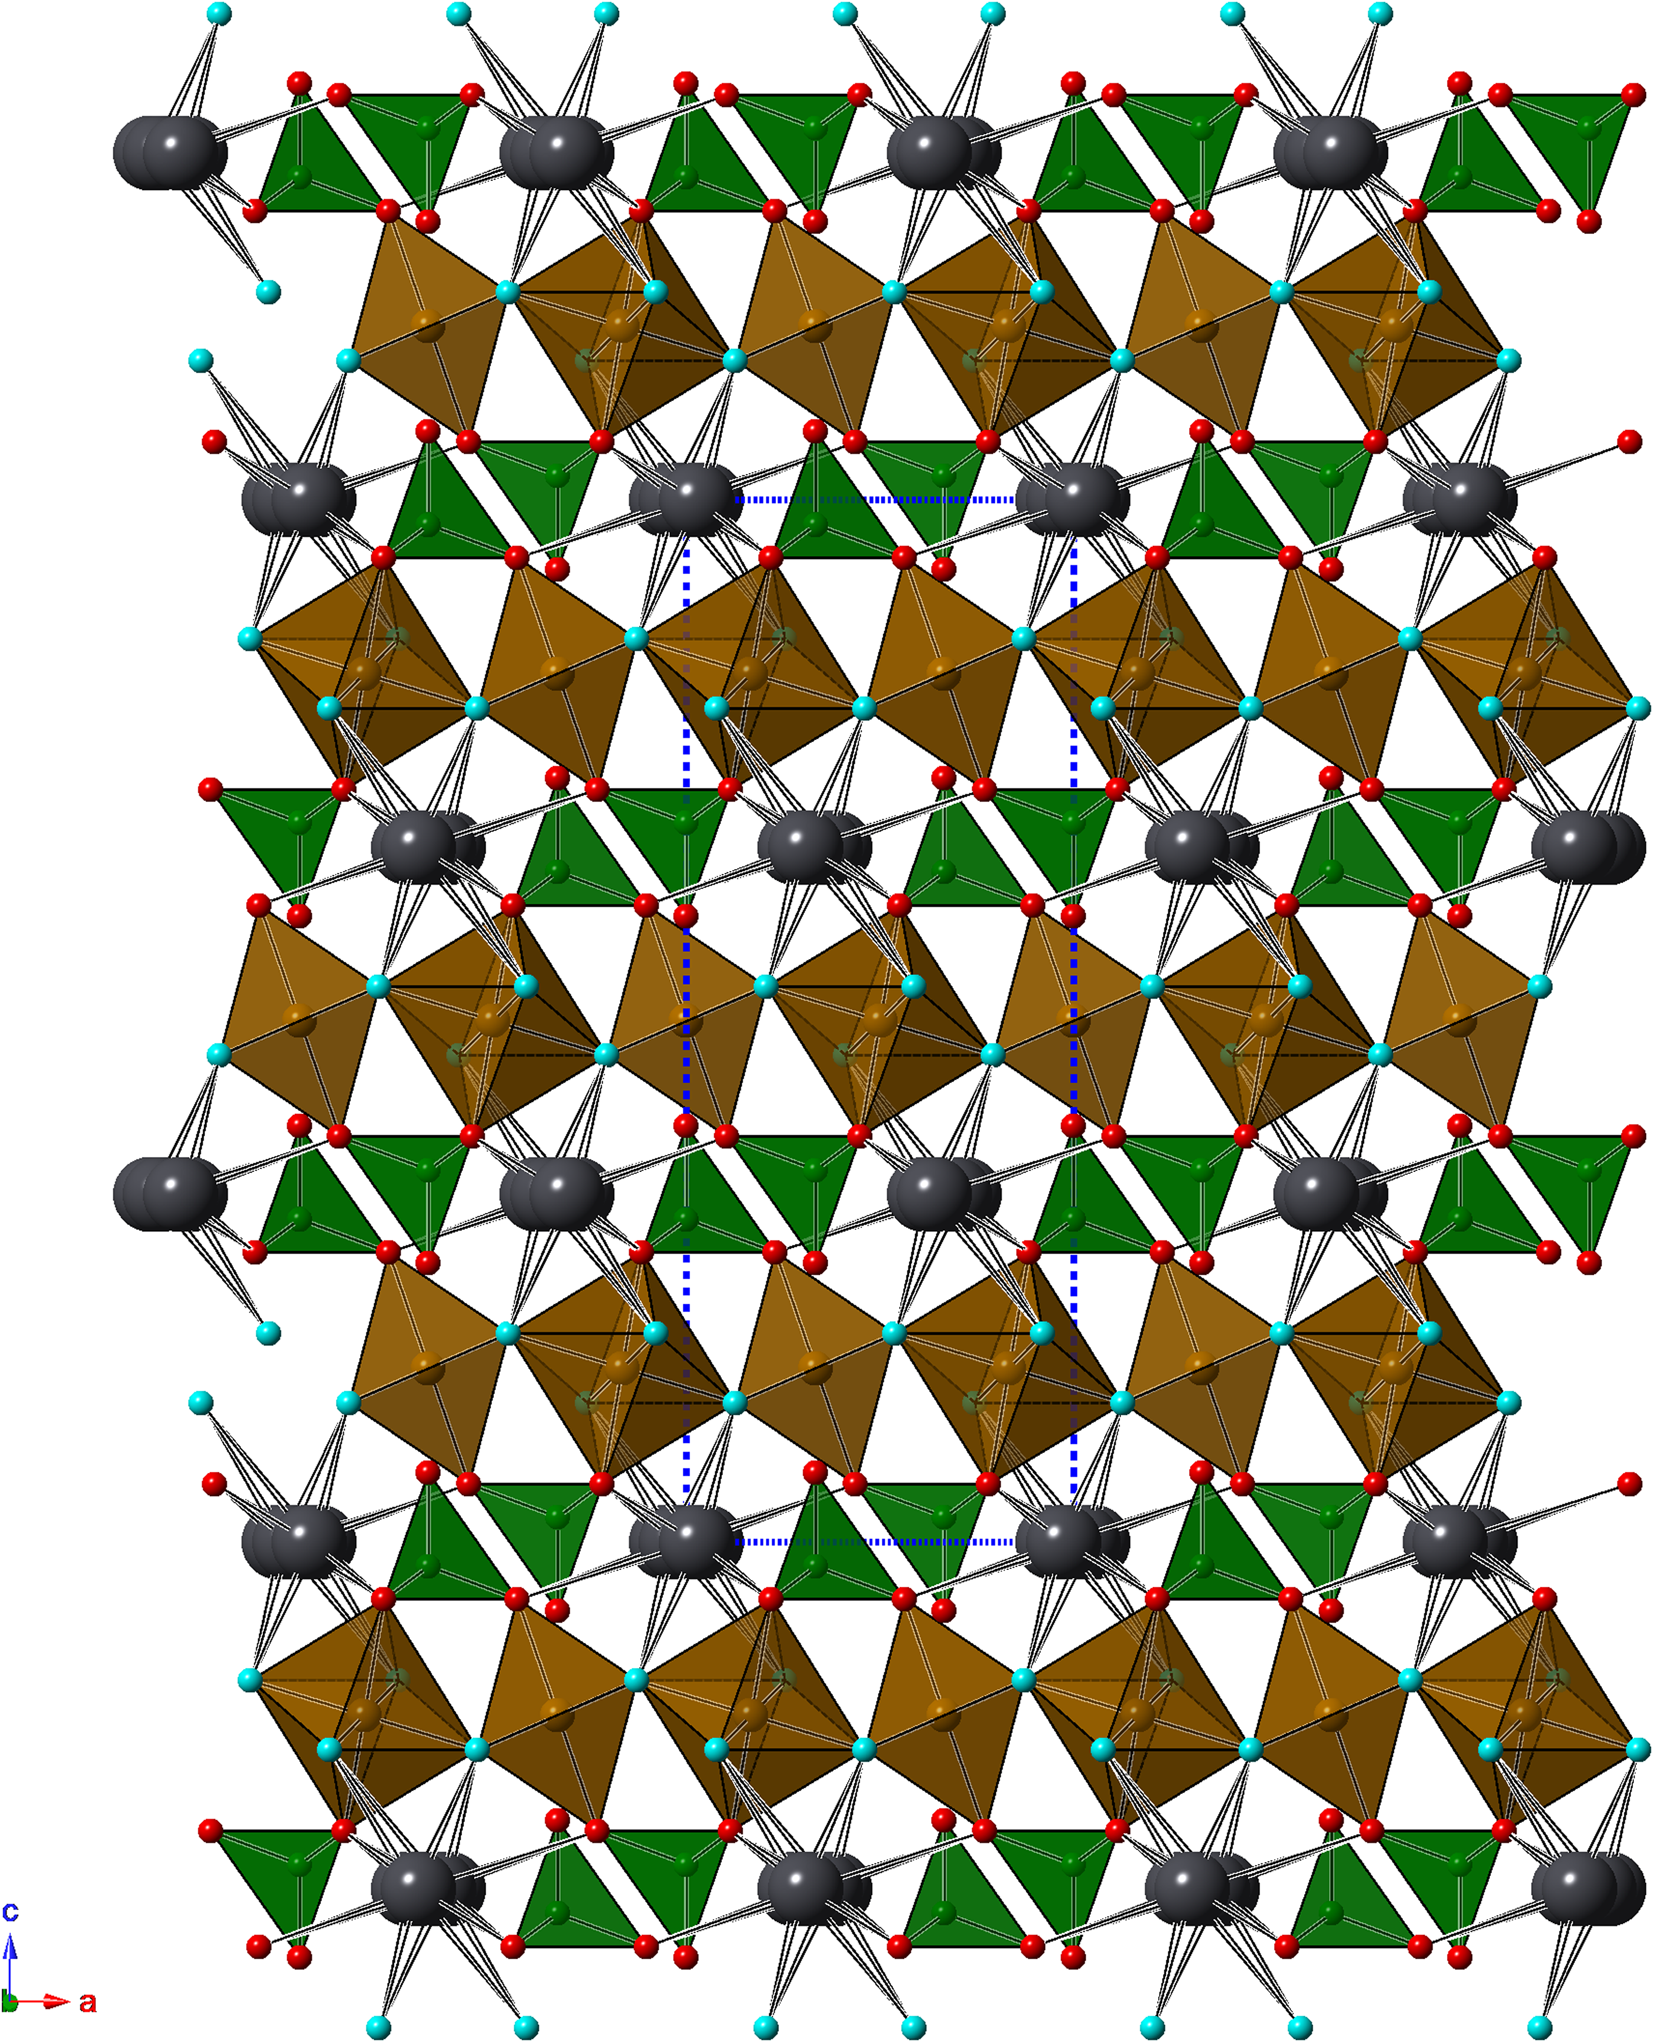
Fig. 3. Crystal structure of kintoreite as seen down b. Iron-centred and P-centred polyhedra are shown in brown and green, respectively. Large dark grey circles are Pb atoms, whereas O sites are shown as red circles. The (OH)-bearing O(3) site is shown as light blue circles. Hydrogen atoms are not shown. The unit-cell is shown as blue dotted lines.
Cation sites
Lead is hosted in a distorted icosahedron and is displaced from the origin, being distributed in a ring-like structure in the (0001) plane at the 18h position. In hinsdalite, PbAl3(PO4)(SO4)(OH)6, and plumbogummite, Pb occurs at the 18f position (Kolitsch et al., Reference Kolitsch, Tiekink, Slade, Taylor and Pring1999), as in the refinement of kintoreite reported by Grey et al. (Reference Grey, Mumme, Mills, Birch and Wilson2009). On the contrary, Kharisun et al. (Reference Kharisun and Bevan1997) proposed a model where Pb is located on a 36i position. Moreover, this element is located at the origin in corkite, PbFe3(PO4)(SO4)(OH)6, and osarizawaite, Pb(Al2Cu2+)(SO4)2(OH)6, but with anomalously large displacement parameters (Giuseppetti and Tadini, Reference Giuseppetti and Tadini1980, Reference Giuseppetti and Tadini1987). The distorted twelve-fold coordination shown by Pb in kintoreite from the Tripi mine is characterised by six short bonds (Pb–ϕ distance shorter than 2.80 Å) and six longer ones. This distortion is probably due to the activity of the 6s 2 lone-pair of Pb2+. The average <Pb–ϕ> distance is 2.833 Å, to be compared with 2.842 Å and 2.846 Å for kintoreite studied by Kharisun et al. (Reference Kharisun and Bevan1997) and Grey et al. (Reference Grey, Mumme, Mills, Birch and Wilson2009), respectively. These values can be compared with those observed in other Pb-bearing alunite-supergroup minerals, e.g. 2.79 Å in hinsdalite and plumbogummite (Kolitsch et al., Reference Kolitsch, Tiekink, Slade, Taylor and Pring1999), 2.823 Å in corkite (Giuseppetti and Tadini, Reference Giuseppetti and Tadini1987) and 2.858 Å in beudantite (Szymański, Reference Szymański1988). In these phases, the <Pb–O(2)> distances are longer than the <Pb–O(3)>, e.g. 2.87 vs. 2.80 Å in beudantite (Szymański, Reference Szymański1988), 2.92 vs. 2.73 Å in corkite (Giuseppetti and Tadini, Reference Giuseppetti and Tadini1987) and 2.82 vs. 2.78 Å in gallobeudantite (Jambor et al., Reference Jambor, Owens, Grice and Feinglos1996). In kintoreite from the Tripi mine, these values are 2.90 and 2.77 Å, respectively, to be compared with those given by Kharisun et al. (Reference Kharisun and Bevan1997) and Grey et al. (Reference Grey, Mumme, Mills, Birch and Wilson2009), i.e. 2.92 vs. 2.79 Å and 2.92 vs. 2.77 Å, respectively. The bond-valence sum at the Pb site is 2.09 valence units (vu), in agreement with the theoretical value.
Iron, replaced partially by Al and a minor vacancy, is the main G constituent and is hosted in a quite regular octahedron, formed by four equatorial O(3) sites and two apical O(2) sites. Average <G–ϕ> distance is 1.972 Å, shorter than those reported by Kharisun et al. (Reference Kharisun and Bevan1997) and Grey et al. (Reference Grey, Mumme, Mills, Birch and Wilson2009), i.e. 2.011 Å in both structural models, owing to the extensive Al-to-Fe3+ replacement. Using the ionic radii proposed by Shannon (Reference Shannon1976), the observed average bond distance would correspond to the Fe site occupancy (Fe0.70Al0.30). This would correspond to the site population (Fe2.10Al0.90), to be compared with (Fe1.89Al0.97□0.14) and (Fe2.21Al0.53□0.26) for the dark and bright domains, respectively. The discrepancy between electron microprobe data and calculated site population is probably due to the unaccounted occurrence of a vacancy. Refined site scattering at the Fe site is 63.2 electrons per formula unit (epfu), to be compared with 61.8 epfu calculated for the dark domain and 64.4 epfu for the brighter ones. The observed value is intermediate between these two values. The bond-valence sum at the Fe site was calculated on the basis of the site occupancy (Fe0.68Al0.32) refined from single-crystal X-ray diffraction data and it corresponds to 2.90 vu.
Phosphorus and minor S are tetrahedrally coordinated, with an average <T–ϕ> distance of 1.526 Å. This distance is shorter than that reported by Kharisun et al. (Reference Kharisun and Bevan1997), i.e. 1.563 Å, related to the partial substitution of P5+ by the larger As5+ cation. In ‘pure’ kintoreite studied by Grey et al. (Reference Grey, Mumme, Mills, Birch and Wilson2009), the corresponding distance is 1.537 Å, in agreement with the grand <P–ϕ> distance given by Huminicki and Hawthorne (Reference Huminicki, Hawthorne, Kohn, Rakovan and Hughes2002). In the sample from the Tripi mine, P is replaced partially by S. On the basis of the observed average distance, using the ideal distances reported by Huminicki and Hawthorne (Reference Huminicki, Hawthorne, Kohn, Rakovan and Hughes2002) and Hawthorne et al. (Reference Hawthorne, Krivovichev, Burns, Alpers, Jambor and Nordstrom2000) for <P–ϕ> and <S–ϕ>, respectively, the site occupancy (P0.83S0.17) for the P site can be proposed. In comparison those observed in the dark and bright domains are (P0.785S0.215) and (P0.755S0.245), respectively. The bond-valence sum, calculated assuming the site occupancy (P0.78S0.22), is 5.15 vu, in accord with the partial replacement of P5+ by S6+. In kintoreite, P and S are disordered, as observed in other mixed (P,S) phases belonging to the alunite supergroup, e.g. woodhouseite, CaAl3(PO4)(SO4)(OH)6 (Kato, Reference Kato1977), svanbergite, SrAl3(PO4)(SO4)(OH)6 (Kato and Miura, Reference Kato and Miura1977) and hinsdalite (Kolitsch et al., Reference Kolitsch, Tiekink, Slade, Taylor and Pring1999). The ordering of P and S in corkite reported by Giuseppetti and Tadini (Reference Giuseppetti and Tadini1987) is considered questionable (e.g. Bayliss et al., Reference Bayliss, Kolitsch, Nickel and Pring2010).
Anion sites and H bonds in kintoreite
Three anion sites occur in the crystal structure of kintoreite, i.e. O(1), O(2) and O(3).
O(1) is bonded to (P,S) only, with a relatively short distance of 1.510 Å. Its bond-valence sum indicates a significant underbonding, 1.34 vu. O(2) is corner-shared between one (P,S)-centred tetrahedron and an (Fe,Al)-centred octahedron. Moreover, it is bonded to disordered Pb atoms. Its bond-valence sum ranges between 1.81 and 2.02 vu, in relation to the different Pb ordered positions. O(3) is shared between two (Fe,Al)-centred octahedra and one disordered Pb atom. Its bond-valence sum ranges between 1.10 and 1.26 vu. The difference-Fourier map revealed an H atom at 0.97(5) Å from O(3) and forming an O(3)–H(1)⋅⋅⋅O(1) H bond with O(1)⋅⋅⋅O(3) distance of 2.814(9) Å and an angle of 179(17)°. Using the relations proposed by Ferraris and Ivaldi (Reference Ferraris and Ivaldi1988), a bond strength of 0.18 vu can be calculated for this H bond. In this way, the bond-valence sum at O(3), that acts as a donor, ranges between 0.92 and 1.08 vu, whereas O(1), acceptor of three H bonds, increases its bond-valence sum up to 1.88 vu. However, as stressed by Cooper and Hawthorne (Reference Cooper and Hawthorne2012), O(1) should have a mixed occupancy [O0.5(OH)0.5] in alunite-supergroup minerals having the general formula D2+G3+3(T5+O4)(T5+O3OH)(OH)6, as in kintoreite (e.g. Grey et al., Reference Grey, Mumme, Mills, Birch and Wilson2009). In agreement with Cooper and Hawthorne (Reference Cooper and Hawthorne2012), when O(1) is occupied by O2–, then it is the acceptor of H bonds from three symmetry-related OH groups hosted at O(3) and one weak H bond from an OH group hosted at opposing O(1) apices of a Tϕ4 group; on the contrary, when O(1) is an OH group, then it cannot be acceptor of the three H bonds from O(3). In this case, following Cooper and Hawthorne (Reference Cooper and Hawthorne2012), it can be hypothesised that the H bonds are accepted by the O2– atoms hosted at the O(2) sites, located at the base of the Tϕ4 groups. The H atom bonded to O(1) was not located. The O(1)⋅⋅⋅O(1) distance is ~3.38 Å, corresponding to a very weak H bond, having a bond strength of 0.09 vu. Also the O(3)⋅⋅⋅O(2) distance is long, i.e. ~3.38 Å. The O(3)–H(1)⋅⋅⋅O(2) angle, ≈121°, is very small, close to the lower limit of observed O–H⋅⋅⋅O bonds and indicative of a very weak bond (Brown, Reference Brown1976). These values can be compared with those given by Cooper and Hawthorne (Reference Cooper and Hawthorne2012) for philipsbornite–hidalgoite, i.e. O(3)⋅⋅⋅O(2) = 3.54 Å and O(3)–H(1)⋅⋅⋅O(2) = 116°. The proposed H-bonding is shown in Fig. 4.
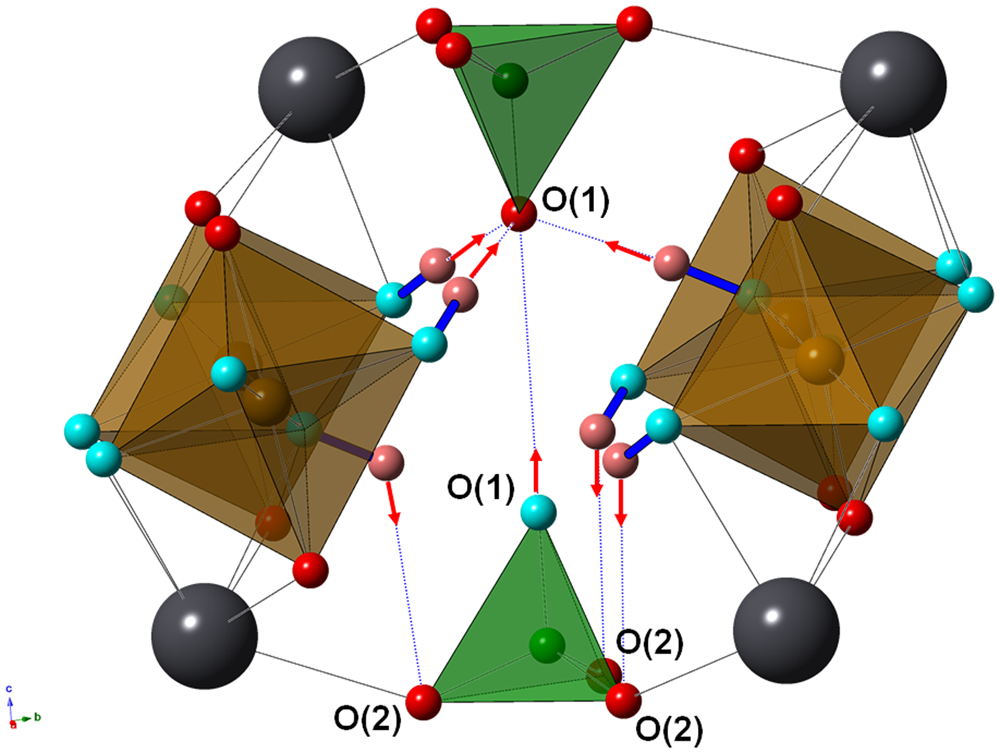
Fig. 4. Fragment of the crystal structure of kintoreite showing the H bonding involving O(3) (light blue) and O(1) (light blue and red if donor or acceptor of H bonds, respectively) sites. Red arrows indicate the H bonds. Same symbols as in Fig. 3. Hydrogen atoms are shown as pink circles.
Micro-Raman spectroscopy reveals the occurrence of possible H–O–H bending modes in kintoreite, thus supporting the presence of H2O groups. Although H2O groups may be the result of the protonation of (OH)– groups, as suggested by Szymański (Reference Szymański1985), a more reliable hypothesis is that the occurrence of H2O is related to the presence of octahedral vacancies. Their occurrence has been suggested by previous investigators (e.g. Jambor and Dutrizac, Reference Jambor and Dutrizac1983; Szymański, Reference Szymański1985) and they seem to be coupled with the protonation of equatorial H2O groups of octahedral sites, as described by Nielsen et al. (Reference Nielsen, Majzlan, Phillips, Ziliox and Grey2007).
Variation of unit-cell parameters
Unit-cell parameters of alunite-supergroup minerals are sensitive to the complex homo- and heterovalent substitutions accepted by their crystal structure.
Pring et al. (Reference Pring, Birch, Dawe, Taylor, Deliens and Walenta1995) reported the following unit-cell parameters for type kintoreite: a = 7.325(1), c = 16.900(3) Å and V = 785.3(5) Å3. This type material showed significant As and S replacing P, along with minor CO3 groups. The compositionally similar sample studied by Kharisun et al. (Reference Kharisun and Bevan1997) gave similar values: a = 7.3310(7), c = 16.885(2) Å and V = 785.9(2) Å3. Pure kintoreite (i.e. with negligible substitution of P by S and no other octahedral cations than Fe3+) has unit-cell parameters a = 7.2963(5), c = 16.8491(5) Å and V = 776.8 Å3 (Grey et al., Reference Grey, Mumme, Mills, Birch and Wilson2009). Other unit-cell parameters for kintoreite available in literature are those reported by Pauliš et al. (Reference Pauliš, Toegel and Jebavá2012) for a sample with minor Cu2+ as octahedral cation and As replacing P [a = 7.290(1), c = 16.8654(1) Å and V = 776.2(2) Å3], and by Števko et al. (Reference Števko, Sejkora and Malíková2016), who reported the unit-cell parameters for a specimen showing a partial replacement of Fe3+ by Al (0.34 apfu), Cu2+ (0.14 apfu), and minor vacancy (0.04 apfu), with P replaced by Si (0.16 apfu), S (0.02 apfu) and As (0.01) [a = 7.286(8), c = 16.883(5) Å and V = 776(1) Å3]. Hatert and Lefèvre (Reference Hatert and Lefèvre2004) reported the unit-cell parameters for kintoreite from the Stavelot massif, Belgium, showing a very long c parameter, i.e. 17.08(2) Å. No quantitative chemical data are available.
The sample from the Tripi mine has an exceptionally small unit-cell volume, i.e. 759.8(3) Å3, with a = 7.2191(10) and c = 16.834(3) Å. Assuming the unit-cell parameters of the specimen studied by Grey et al. (Reference Grey, Mumme, Mills, Birch and Wilson2009) as a reference for ideal kintoreite, the specimen from the Tripi mine has Δa = –1.1%, Δc = –0.1% and ΔV = –2.2%. As discussed by other authors (e.g. Stoffregen et al., Reference Stoffregen, Alpers, Jambor, Alpers, Jambor and Nordstrom2000), the a unit-cell parameter is affected mainly by the Fe3+–Al substitution, whereas variations of the unit-cell parameter c are largely related to substitution at the twelve-fold coordinated site. Consequently, the contraction of the Tripi mine sample is probably due to the high Al content of the material studied, supporting the existence of a substitutional series with the Al-isotype plumbogummite.
Conclusions
Kintoreite from the Tripi mine represents the first well-characterised Italian occurrence of this uncommon member of the alunite supergroup. Using a multi-analytical approach (electron microprobe analysis, single-crystal X-ray diffraction, and micro-Raman spectroscopy), the crystal chemical features of this mineral species were determined, detailing the H-bond system and suggesting the occurrence of H2O groups, probably due to the presence of an octahedral vacancy. In this way, the plasticity of the alunite structure to accommodate several substitutions is further confirmed. This is particularly important as kintoreite is able to host PTE such as Pb. Indeed, in the Alì area, high Pb content of geogenic origin in soils has been reported by Cosenza et al. (Reference Cosenza, Lima, Ayuso, Foley, Albanese, Messina and De Vivo2015).
Notwithstanding the current lack of mineralogical studies aiming at constraining the mineralogy of secondary assemblages from the Peloritani Mountains, it is very likely that alunite-supergroup minerals may play a central role in determining the fate of PTE in this former mining district. The finding and characterisation of kintoreite could represent a first step in assessing the environmental role of these phases in this sector of northeastern Sicily.
Acknowledgements
K. Gariboldi is acknowledged for her assistance during the SEM study. The University Centrum for Applied Geosciences (UCAG) is thanked for the access to the ‘Eugen F. Stumpfl’ electron microprobe laboratory. This research was supported financially by the Ministero dell'Istruzione, Università e Ricerca through the project PRIN 2017 ‘TEOREM – deciphering geological processes using Terrestrial and Extraterrestrial ORE Minerals’, prot. 2017AK8C32. Comments of Peter Leverett and two anonymous reviewers helped us in improving the paper.
The Authors are delighted to contribute to the thematic issue honouring Prof. Peter A. Williams. We believe that the complex crystal chemistry of kintoreite and its environmental significance reflects well the main interest that Pete has had during his scientific activity.
Supplementary material
To view supplementary material for this article, please visit https://doi.org/10.1180/mgm.2021.85


