


Introduction
Engaged people can help others, especially in moments of crisis, and they can start volunteering. Non-profit organizations (NPOs), which already have the necessary structures to coordinate volunteers, also become active. Volunteers can thus contribute to their efforts in formal structures. In addition to formal volunteering at NPOs, people also participate in informal volunteering to assist wider networks of family, friends, and neighborhoods. Both formal and informal volunteering provide a chance to deliver specific qualities and quantities of services to satisfy particular needs.
Volunteering contributes to social and economic development, as well as improving individual and community well-being (Kim et al., Reference Kim, Fredline and Cuskelly2018). Volunteers are often the backbone of community organizations and nonprofit entities, providing essential services and support that may not be feasible otherwise. These people bring diverse skills, experiences, and perspectives that can help address social and economic issues, foster social cohesion, and strengthen community networks.
Moreover, volunteers themselves benefit from volunteering, which offers opportunities to develop new skills, build social connections, and gain valuable work experience that can increase employability (Grönlund, Reference Grönlund2011). The availability, capacity, and willingness to volunteer are strongly connected to human and social capital (Wilson, Reference Wilson2000).
Despite the evidence of positive effects of volunteering, few people are engaged. Moreover, there are also differences in involvement in formal and informal volunteering. Some studies confirm competition between the two types of volunteering (Pettigrew et al., Reference Pettigrew, Jongenelis, Newton, Warburton and Jackson2017), while others confirm the supportive character of both (Simonson, Reference Simonson2017). Thus, this inconclusiveness in research findings, underlined by the scarcity of volunteering in Central Europe, leads us to aim to fill this research gap by answering the research questions:
(1) Do volunteers dedicate their time to both formal and informal volunteering, or do these two types of volunteering compete? (2) Are different influences of human capital and social capital on both formal and informal volunteering through resources needed to be invested in volunteering?
By answering these questions, we contribute to theoretical knowledge about whether the various forms of volunteering require different types of resources.
For our study, we selected Visegrad countries in Central Europe (Czechia, Hungary, Poland, and Slovakia). These countries provide an excellent opportunity to study the relationship between formal and informal volunteering because of the developing nature of their young civil societies after the communist era. These countries faced social and economic transitions and began to rebuild civil society three decades ago. This process was not straightforward and was influenced by national and international political events, trust in societies, and economic development (see, Potuček, Reference Potuček1999, for a political discussion about competing streams in shaping civil society in Czechia in the 1990s; or Schreier, Reference Schreier2015, for a comprehensive description of the development of civil society, including volunteering, in all four Visegrad countries).
The current statistics show that among EU countries, the Visegrad countries are below the average level of volunteering in Europe (CAF, 2012, 2024). The low numbers in volunteering contrast with the need for engagement in volunteering and raise the question of why people do not volunteer on a greater scale. It is possible that people contribute more through informal volunteering than formal volunteering, although they do not report it, as they consider it to be normal behavior. For example, Shandra (Reference Shandra2017) noted that people with disabilities have the capacity to volunteer, but they do not obtain information from NPOs to join their volunteering programs. Moreover, informal volunteering is easy to begin (Pettigrew et al., Reference Pettigrew, Jongenelis, Jackson and Newton2019). The relative scarcity of volunteering in Visegrad countries enables us to easily compare whether the two types of volunteering compete for engaged people.
The remainder of the article is organized as follows. After the introduction, we define formal and informal volunteering in Sect. 2. This section also covers the specifics of volunteering and the role of human and social capital in volunteering. In Sect. 3, we present the method of data collection and processing via structural equation modeling (SEM). Section 4 includes the results and discussion, highlighting the importance of trust for social capital and volunteering. Moreover, this section describes the strong positive relationship between the two types of volunteering. The final section concludes.
Literature Review
Formal and Informal Volunteering
Volunteering is an emotional and value-based activity (Haski-Leventhal & Bargal, Reference Haski-Leventhal and Bargal2008, p. 97), and activities performed by volunteers are quite spontaneous, helping to make the world a better place (Musick & Wilson, Reference Musick and Wilson2003). Volunteering represents “any activity when time is given freely to benefit another person, group or cause” (Wilson, Reference Wilson2000, p. 215) and takes two forms: formal and informal. While formal volunteering involves “…serving in a formal nonprofit group or volunteer program of a larger parent organization that sponsors or directs the individual’s volunteer action” (Smith et al., Reference Einolf, Prouteau, Nezhina, Ibrayeva, Smith, Stebbins and Grotz2016, p. 1396), informal volunteering is performed independently of any formal organization, often within community, family, or social networks (Smith et al., Reference Smith, Stebbins and Grotz2016, p. 1396).
The literature has revealed similarities and differences between formal and informal volunteering. Regarding similarities, both forms not only enrich civil society and the lives of the volunteers themselves but are also important complements to those activities the state cannot cover with its resources. Additionally, volunteering can be considered an investment in human capital (Meier & Stutzer, Reference Meier and Stutzer2008) and is connected with social capital in society (Putnam, Reference Putnam2000; Wilson & Musick, Reference Wilson and Musick1999).
Both forms of volunteering lead to community development and provide opportunities for personal growth and development for volunteers, who often choose their form of volunteering according to their life goals, relationships and community spirit, life values, and life satisfaction and needs (Meier & Stutzer, Reference Meier and Stutzer2008). Thus, some of the motives for both informal and formal volunteering are similar (Einolf et al., Reference Einolf, Prouteau, Nezhina, Ibrayeva, Smith, Stebbins and Grotz2016, p. 223).
On the other hand, there are also differences between formal and informal volunteering. People differ in motivation to volunteer, in the levels of volunteer commitment and involvement. Moreover, other social factors play a role. Compared with informal volunteering, which is more spontaneous and usually involves close persons, formal volunteering is associated with higher costs and can involve individuals outside one’s immediate circle (Mitani, Reference Mitani2014).
Formal volunteering may be associated with greater professionalization and specialization of volunteering activities and the potential for a greater impact on society, whereas informal volunteering is associated with a greater degree of personal satisfaction and the creation of strong social relationships because of strong emotional ties (Haski-Leventhal & Bargal, Reference Haski-Leventhal and Bargal2008, p. 97) and usually does not require any special skills or training. Formal volunteering is organized through various organizations and is mainly a “long-term planned, prosocial behavior that benefits strangers and occurs within an organizational setting” (Penner, 2002, p. 448), and volunteers are involved in organizations. Volunteers’ social roles or identities play a crucial role in informal volunteering rather than the type of activities they carry out (Nencini et al., Reference Nencini, Romaioli and Meneghini2016, p. 223).
A wave of informal, spontaneous volunteering often occurs in response to crises, such as natural disasters, pandemics (Trautwein et al., Reference Trautwein, Liberatore, Lindenmeier and von Schnurbein2020) or other emergencies (Whittaker et al., Reference Whittaker, McLennan and Handmer2015).
To sum up the differences between formal and informal volunteering, while formal volunteering has clearly defined goals and objectives and a measurable impact on the development of an organization and volunteers, it benefits both volunteers and the organization (Wu et al., Reference Wu, Li and Khoo2016). Informal volunteering is spontaneous and focused on helping the community at a specific time of need (Einolf et al., Reference Einolf, Prouteau, Nezhina, Ibrayeva, Smith, Stebbins and Grotz2016, pp. 224–225). Does this mean that formal volunteering is less flexible in meeting community needs than informal volunteering, and that both types of volunteering compete with each other?
The comparison of the similarities and differences between formal and informal volunteering poses an interesting question. If two forms are similar, then they should compete—i.e., persons who volunteer formally are not involved in informal volunteering and vice versa. However, if this is not the case, there are more important aspects of the motivation to volunteer, and volunteers should engage in both types of volunteering simultaneously. Thus, we investigated the following research questions: (1) Do volunteers dedicate their time to both formal and informal volunteering, or do these two types of volunteering compete? (2) Are different influences of human capital and social capital on both formal and informal volunteering through resources needed to be invested in volunteering?
Specifics of Volunteering in Central Europe
Volunteering was primarily spontaneous, mainly informal, at the beginning of the 1990s in Central Europe, usually involving neighborhood assistance, but it was growing (Soltes & Gavurova, Reference Soltes and Gavurova2016; Voicu & Voicu, Reference Voicu and Voicu2009). It was associated with activism (often political or environmental). The greatest development in informal volunteering occurred during the first wave of the COVID-19 pandemic in the spring of 2020 (sewing face masks, delivering medicines and food to elderly individuals (e.g., in Poland by Nowakowska & Pozzi, Reference Nowakowska and Pozzi2024) and recently during the Russian occupation of Ukraine (providing spontaneous aid to Ukrainian refugees and to people in Ukraine) (Mishchuk & Vlasenko, Reference Mishchuk and Vlasenko2023; Sengupta et al., Reference Sengupta, Verghese and Rys2023).
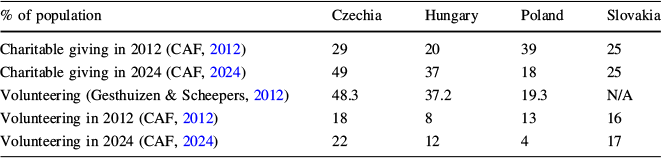
The development of philanthropic activities and volunteering significantly changed during the last two decades too. There are three characteristic features of the development of volunteering in Central Europe. The first is that in Poland, there has been a decline in the rate of volunteering in the adult population over the last decade (with respect to any philanthropic activities; see Table 1). The second feature relates to the differences between countries. Czechia has long held a high position in this region compared with its neighbors with respect to philanthropic activities.
Table 1 Development of philanthropic activities in Central Europe

|
% of population |
Czechia |
Hungary |
Poland |
Slovakia |
|---|---|---|---|---|
|
Charitable giving in 2012 (CAF, 2012) |
29 |
20 |
39 |
25 |
|
Charitable giving in 2024 (CAF, 2024) |
49 |
37 |
18 |
25 |
|
Volunteering (Gesthuizen & Scheepers, Reference Gesthuizen and Scheepers2012) |
48.3 |
37.2 |
19.3 |
N/A |
|
Volunteering in 2012 (CAF, 2012) |
18 |
8 |
13 |
16 |
|
Volunteering in 2024 (CAF, 2024) |
22 |
12 |
4 |
17 |
Source: Charities Aid Foundation (CAF, 2012, 2024), Gesthuizen and Scheepers (Reference Gesthuizen and Scheepers2012)
Third, the data show that a fraction of the Visegrad countries' population volunteers compared with the U.S. or Western European population; for example, in the U.S., 28% of the population volunteered in 2001 (Sundeen et al., Reference Sundeen, Raskoff and Garcia2007), and in Switzerland, 38.9% of the population volunteered in 2019 (Lamprecht et al., Reference Lamprecht, Fischer and Stamm2020).
Human and Social Capital in (In)formal Volunteering
The literature review clearly revealed that human capital and social capital influence volunteering.
Both human capital and social capital are studied in the fields of philanthropy and volunteering, and human capital impacts volunteering rates (Day & Devlin, Reference Day and Devlin1998; Forbes & Zampelli, Reference Forbes and Zampelli2014; Wilson, Reference Wilson2000). The basic human capital characteristics that influence the willingness to volunteer include education, religion, health, and financial status. Similarly, social capital is connected with networks and social contacts, trust, and the identification of solutions for social problems (Putnam, Reference Putnam2000). Thus, in our research, we tested whether there are different influences of human capital and social capital on both formal and informal volunteering through resources needed to be invested in volunteering.
Human Capital and Volunteering
Human capital is an important condition for volunteers to volunteer effectively. The availability of resources such as knowledge, skills, and jobs (Brown & Ferris, Reference Brown and Ferris2007; Hager & Brudney, Reference Hager and Brudney2011; Haski-Leventhal et al., Reference Haski-Leventhal, Meijs, Lockstone-Binney, Holmes and Oppenheimer2018; Perpék, Reference Perpék2012) increases the likelihood of becoming a volunteer (Chambré, Reference Chambré2020; Einolf & Yung, Reference Einolf and Yung2018). This occurs not only because of the supply of resources from volunteers, including education (Forbes & Zampelli, Reference Forbes and Zampelli2014), but also because of training from organizations utilizing volunteers (Studer & von Schnurbein, Reference Studer and von Schnurbein2013). Moreover, people with greater human capital are also more often asked to volunteer by NPOs (Helms & McKenzie, Reference Helms and McKenzie2013; Musick & Wilson, Reference Musick and Wilson2008, p. 293), as they are accessible through various channels (Piatak et al., Reference Piatak, Dietz and McKeever2019). Nevertheless, as Shandra (Reference Shandra2017) noted, people with disabilities volunteer with the same intensity as people without disabilities do. The only difference is that organizations do not ask people with disabilities to volunteer.
Among the components of human capital, educational attainment is among the most important (Helms & McKenzie, Reference Helms and McKenzie2013). Education is a source of social ties and civic values, which are among the determinants of volunteering (Oesterle et al., Reference Oesterle, Kirkpatrick Johnson and Mortimer2004). People who are more educated have greater self-confidence in their abilities; low self-confidence is one of the barriers to volunteering (Lasby, Reference Lasby2004; Son & Wilson, Reference Son and Wilson2012). Research in 17 OECD countries revealed that more educated groups perform a larger share of volunteer work; however, cognitive competence and job status amplify the importance of education for volunteering (Gesthuizen & Scheepers, Reference Gesthuizen and Scheepers2012).
The other components of human capital, such as employment status or ethnicity, influence the likelihood of volunteering (Sundeen et al., Reference Sundeen, Raskoff and Garcia2007) through social contacts. Unemployed individuals or those with part-time jobs have a lower level of volunteering because of their social status. For these individuals, it is unacceptable to engage in unpaid work if one does not have a paid job (Taniguchi, Reference Taniguchi2006). Moreover, communities without social infrastructure and relationships are more threatened by crises and experience decreased volunteering rates (Lim & Laurence, Reference Lim and Laurence2015). The resource theory (Wilson, Reference Wilson2000) confirms inequality in volunteering (Hustinx et al., Reference Hustinx, Grubb, Rameder and Shachar2022; Seabe & Burger, Reference Seabe and Burger2022). The resource theory is based on social interactions, when people satisfy their needs in social interactions and relationships provide the means by which individuals can obtain needed resources from others (Foa et. al, Reference Foa, Converse, Törnblom and Foa1993).
Social Capital and Volunteering
Social capital relates to trust and norms within a society. Trust in people and institutions is a cornerstone of social capital (Putnam, Reference Putnam1993, Reference Putnam2000), correlates with generosity (Chambré, Reference Chambré2020; Kneidinger, Reference Kneidinger2010, p. 25), and enhances the willingness to volunteer (Schnurbein, Reference Schnurbein2013). According to Potluka et al. (Reference Potluka, Kalman, Musiałkowska, Idczak, Kerley, Liddle and Dunning2018) trust is lacking in the countries in question. It is especially visible in crises like COVID-19 pandemics when trust in other people, even the relatives and close friends about information about the vaccination was non-existent (see, Muthová and Svidroňová, Reference Muthová, Murray Svidroňová, Hays, Hayden and Polišenská2023, p. 71).
Moreover, social capital is often understood as networks, trust, and norms. Thus, a distinction is needed in the structural and cultural parts of social capital (Westle & Gabriel, 2008, p. 22). Through socialization, people engage with other people, including by volunteering and participating in other prosocial activities (Brown & Ferris, Reference Brown and Ferris2007; Dang et al., Reference Dang, Seemann, Lindenmeier and Saliterer2022; Lim & Laurence, Reference Lim and Laurence2015; Putnam, Reference Putnam2000; Ramaekers et al., Reference Ramaekers, Verbakel and Kraaykamp2022; Perpék, Reference Perpék2012). From this perspective, socialization is related to identity creation, following the values of social groups and social networks. Together, these factors create a sense of belonging to a community and support internal motivation to volunteer (Grönlund, Reference Grönlund2011) and external moderators through demand from NPOs and other organizations (Rotolo & Wilson, Reference Rotolo and Wilson2012). Moreover, people who are socialized and have prosocial attitudes and norms are more likely to engage in volunteering (Dang et al., Reference Dang, Seemann, Lindenmeier and Saliterer2022; Shantz et al., Reference Shantz, Saksida and Alfes2014).
Communities with more social capital and trust are more resilient and have greater ability to cope with challenging situations (Hollenstein, Reference Hollenstein2013, p. 46; Putnam, Reference Putnam1993, Reference Putnam2000). For example, people are more engaged if they feel attached to a place and identify themselves with the place (Dang et al., Reference Dang, Seemann, Lindenmeier and Saliterer2022), as well as participate in other social activities such as religious activities. Nevertheless, research on places and volunteering is inconclusive. On the one hand, people living in suburban and rural areas are slightly more likely to volunteer than those living in urban areas are, regardless of age (Musick & Wilson, Reference Musick and Wilson2008). On the other hand, dependence between place of living in rural in comparison to urban areas has not been reported (Dury et al., Reference Dury, Willems, De Witte, De Donder, Buffel and Verte2016; Hooghe & Botterman, Reference Hooghe and Botterman2012), or even the opposite has been noted (Musick & Wilson, Reference Musick and Wilson2008). Moreover, the social composition of the population plays a role: volunteering rates are lower in low-income rural areas (Hussein & Manthorpe, Reference Hussein and Manthorpe2014) and increase as the affluence of the municipality increases (Dury et al., Reference Dury, Willems, De Witte, De Donder, Buffel and Verte2016).
The family represents a specific way of socialization and social capital creation. Although it could be expected that the presence of children reduces the willingness to volunteer, while socialization with other parents leads to the opposite result. Owing to the activities of schoolchildren, the level of volunteerism of parents is relatively high. For individuals caring for children under six years of age, the impact of the presence of children on their willingness to volunteer is neutral; higher demands on time are eliminated with the positive effects of institutional involvement (Einolf, Reference Einolf2011). However, these conclusions are not universally valid, and it is necessary to consider the influence of society and religion; for example, the participation rate of women is lower, and childcare reduces this rate more significantly (Wang & Han, Reference Wang and Han2022). On average, women spend more time volunteering than men do (Einolf, Reference Einolf2011; Taniguchi, Reference Taniguchi2006), and women are more inclined toward informal volunteering (Helms & McKenzie, Reference Helms and McKenzie2013). However, the amount of time spent working and caring for family members has a significant influence on voluntary engagement. Taking care of elderly parents or working full-time jobs has a strong negative effect on women’s volunteer activities (Taniguchi, Reference Taniguchi2006). The gender-specific division of labor in society determines this role as women take the role of those who care for family members (von Rosenbladt, Reference von Rosenbladt2000). However, numerous studies have already shown that the influence of gender cannot be observed separately but rather in connection with other factors (Einolf, Reference Einolf2011).
Data and Methods
Data
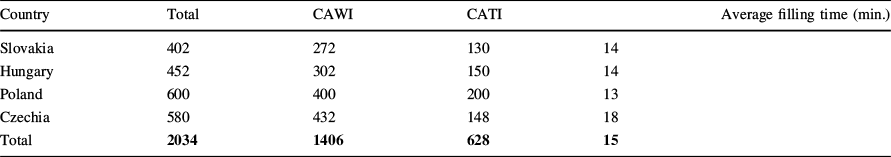
We used the data from a survey carried out in October and November 2023, which was conducted on a representative sample of 2,034 respondents from the Visegrad countries. The survey was conducted as an online questionnaire. The number of respondents was distributed according to the size of each country (region) to maintain the possibility of comparing results across countries (regions). In total, 2,034 responses were obtained (see descriptive statistics in Table 2).
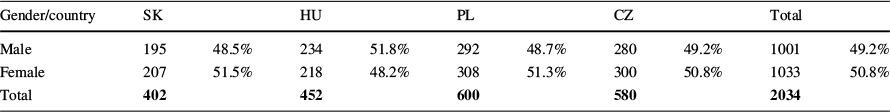
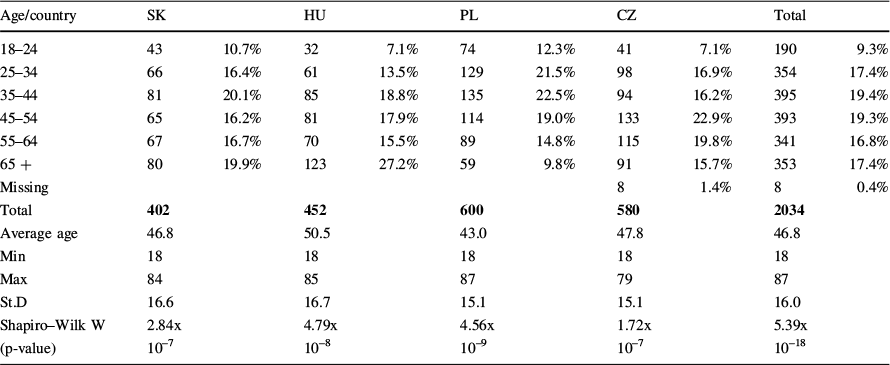
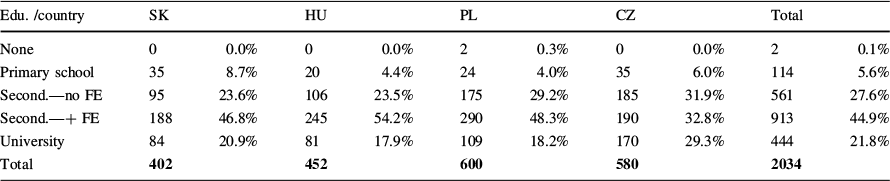
The data collection process employed a combination of computer-assisted web interviewing (CAWI) and computer-assisted telephone interviewing (CATI) methods. It enabled collecting data also from people with low access to internet. The data were collected from a statistically representative sample of the population above 18 years of age in each participating country. Representativeness was ensured by applying sociodemographic quotas for gender, age, education level, and type of housing.
The analysis was performed with 1,971 responses, with 69 out of 2,034 responses excluded due to listwise deletion of missing values. This constituted approximately 3.4% of the dataset, so the impact on the results was minimal. When other methods were used to handle missing values ("pairwise" and "imputed means"), the result of the performed model was slightly worse than that with listwise deletion of missing values, so we decided on a listwise deletion. The full version of the questionnaire and basic statistics are available at https://business.vscht.cz/1133-motivation-for-volunteering.
Methods
The SEM method best suited the needs and characteristics of this research. It estimates relationships between latent and observed variables in a model when the relationships among them are indirect (Table 2).
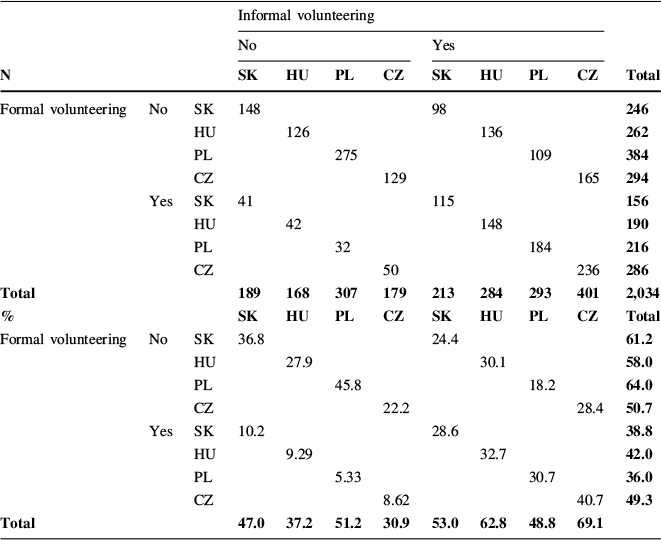
Table 2 Descriptive statistics of both types of volunteering
|
Informal volunteering |
|||||||||||
|---|---|---|---|---|---|---|---|---|---|---|---|
|
No |
Yes |
||||||||||
|
N |
SK |
HU |
PL |
CZ |
SK |
HU |
PL |
CZ |
Total |
||
|
Formal volunteering |
No |
SK |
148 |
98 |
246 |
||||||
|
HU |
126 |
136 |
262 |
||||||||
|
PL |
275 |
109 |
384 |
||||||||
|
CZ |
129 |
165 |
294 |
||||||||
|
Yes |
SK |
41 |
115 |
156 |
|||||||
|
HU |
42 |
148 |
190 |
||||||||
|
PL |
32 |
184 |
216 |
||||||||
|
CZ |
50 |
236 |
286 |
||||||||
|
Total |
189 |
168 |
307 |
179 |
213 |
284 |
293 |
401 |
2,034 |
||
|
% |
SK |
HU |
PL |
CZ |
SK |
HU |
PL |
CZ |
Total |
||
|
Formal volunteering |
No |
SK |
36.8 |
24.4 |
61.2 |
||||||
|
HU |
27.9 |
30.1 |
58.0 |
||||||||
|
PL |
45.8 |
18.2 |
64.0 |
||||||||
|
CZ |
22.2 |
28.4 |
50.7 |
||||||||
|
Yes |
SK |
10.2 |
28.6 |
38.8 |
|||||||
|
HU |
9.29 |
32.7 |
42.0 |
||||||||
|
PL |
5.33 |
30.7 |
36.0 |
||||||||
|
CZ |
8.62 |
40.7 |
49.3 |
||||||||
|
Total |
47.0 |
37.2 |
51.2 |
30.9 |
53.0 |
62.8 |
48.8 |
69.1 |
|||
Source: Authors’ calculations based on the survey, in the whole sample of 2,034 respondents, there were these categories of responses: no formal and no informal volunteering: 678 (33.3%), yes–no: 165 (8.1%), no-yes: 508 (24.9%), yes-yes: 683 (33.6%)
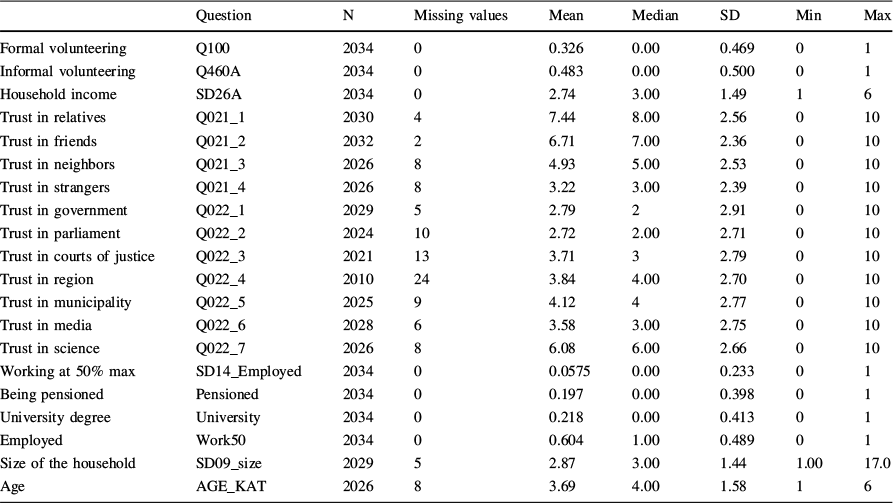
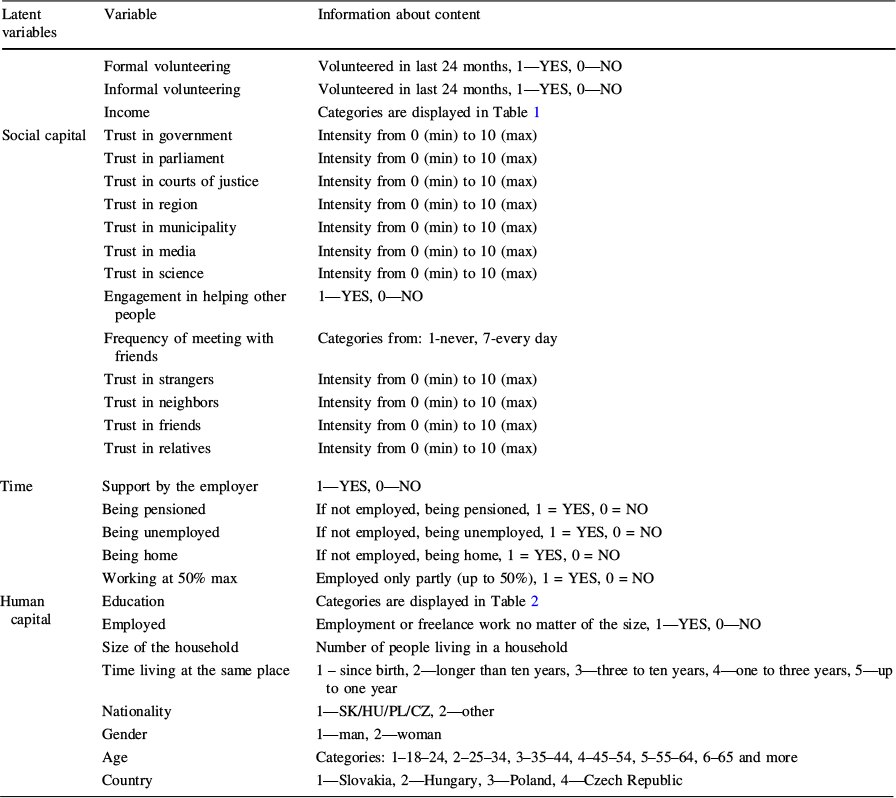
We created reflective latent variables for human capital, social capital, time availability and income level. The descriptive statistics are displayed in Annex 1, and the initial configuration of the constructs is detailed in Annex 2, while the composition following model optimization is outlined in Table 3. Additionally, we integrated two single-item variables, represented as rectangles, into the model: engagement in formal volunteering and engagement in informal volunteering.
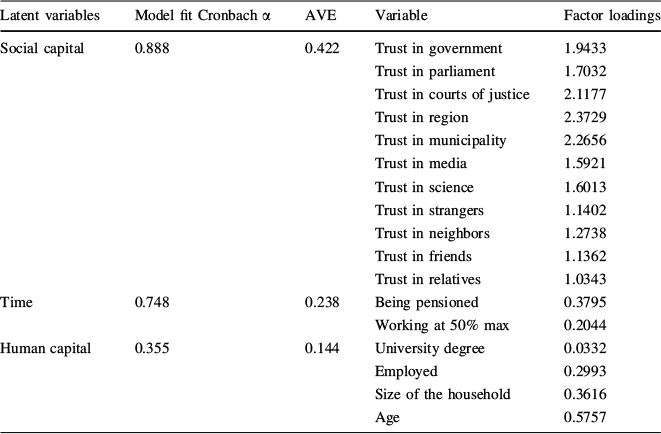
Table 3 Composition of the model
|
Latent variables |
Model fit Cronbach α |
AVE |
Variable |
Factor loadings |
|---|---|---|---|---|
|
Social capital |
0.888 |
0.422 |
Trust in government |
1.9433 |
|
Trust in parliament |
1.7032 |
|||
|
Trust in courts of justice |
2.1177 |
|||
|
Trust in region |
2.3729 |
|||
|
Trust in municipality |
2.2656 |
|||
|
Trust in media |
1.5921 |
|||
|
Trust in science |
1.6013 |
|||
|
Trust in strangers |
1.1402 |
|||
|
Trust in neighbors |
1.2738 |
|||
|
Trust in friends |
1.1362 |
|||
|
Trust in relatives |
1.0343 |
|||
|
Time |
0.748 |
0.238 |
Being pensioned |
0.3795 |
|
Working at 50% max |
0.2044 |
|||
|
Human capital |
0.355 |
0.144 |
University degree |
0.0332 |
|
Employed |
0.2993 |
|||
|
Size of the household |
0.3616 |
|||
|
Age |
0.5757 |
Confirmatory Factor Analysis
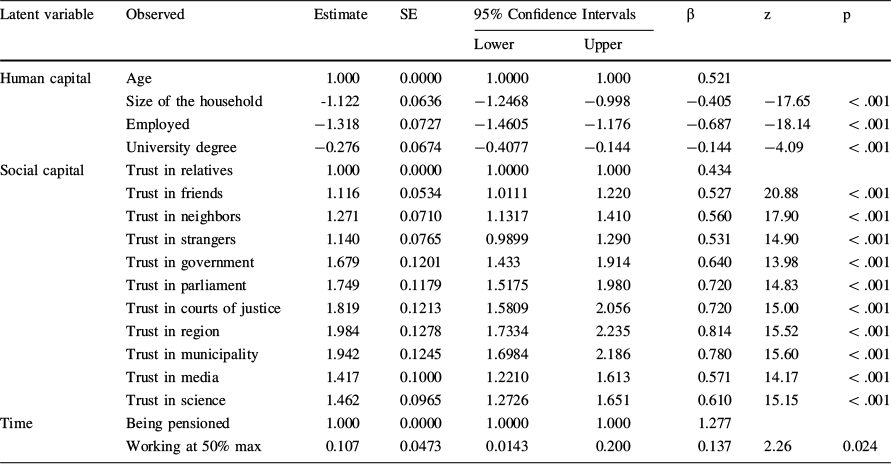
We performed the analysis as described below. The survey dataset was provided in Microsoft (MS) Excel tables. We prepared the data set and exported it to Jamovi statistical software (version 2.4.11). We selected the variables related to the research questions and the models tested, cleaned them and computed/transformed some of them (for more details, see Table 3). As several people were involved in data collection, it was necessary to check and align the scale for each variable (Table 4).
Table 4 Estimates of the measurement model

|
Latent variable |
Observed |
Estimate |
SE |
95% Confidence Intervals |
β |
z |
p |
|
|---|---|---|---|---|---|---|---|---|
|
Lower |
Upper |
|||||||
|
Human capital |
Age |
1.000 |
0.0000 |
1.0000 |
1.000 |
0.521 |
||
|
Size of the household |
-1.122 |
0.0636 |
−1.2468 |
−0.998 |
−0.405 |
−17.65 |
< .001 |
|
|
Employed |
−1.318 |
0.0727 |
−1.4605 |
−1.176 |
−0.687 |
−18.14 |
< .001 |
|
|
University degree |
−0.276 |
0.0674 |
−0.4077 |
−0.144 |
−0.144 |
−4.09 |
< .001 |
|
|
Social capital |
Trust in relatives |
1.000 |
0.0000 |
1.0000 |
1.000 |
0.434 |
||
|
Trust in friends |
1.116 |
0.0534 |
1.0111 |
1.220 |
0.527 |
20.88 |
< .001 |
|
|
Trust in neighbors |
1.271 |
0.0710 |
1.1317 |
1.410 |
0.560 |
17.90 |
< .001 |
|
|
Trust in strangers |
1.140 |
0.0765 |
0.9899 |
1.290 |
0.531 |
14.90 |
< .001 |
|
|
Trust in government |
1.679 |
0.1201 |
1.433 |
1.914 |
0.640 |
13.98 |
< .001 |
|
|
Trust in parliament |
1.749 |
0.1179 |
1.5175 |
1.980 |
0.720 |
14.83 |
< .001 |
|
|
Trust in courts of justice |
1.819 |
0.1213 |
1.5809 |
2.056 |
0.720 |
15.00 |
< .001 |
|
|
Trust in region |
1.984 |
0.1278 |
1.7334 |
2.235 |
0.814 |
15.52 |
< .001 |
|
|
Trust in municipality |
1.942 |
0.1245 |
1.6984 |
2.186 |
0.780 |
15.60 |
< .001 |
|
|
Trust in media |
1.417 |
0.1000 |
1.2210 |
1.613 |
0.571 |
14.17 |
< .001 |
|
|
Trust in science |
1.462 |
0.0965 |
1.2726 |
1.651 |
0.610 |
15.15 |
< .001 |
|
|
Time |
Being pensioned |
1.000 |
0.0000 |
1.0000 |
1.000 |
1.277 |
||
|
Working at 50% max |
0.107 |
0.0473 |
0.0143 |
0.200 |
0.137 |
2.26 |
0.024 |
|
We conducted a normality test (Shapiro–Wilk), which indicated that the data deviated from normality. This justified our decision to use a modeling method designed for non-normal distributions, ensuring the robustness and validity of our findings.
Afterward, we performed confirmatory factor analysis (CFA) on the constructed latent variables, namely, income level, social capital, time and human capital, via the factor module from the Jamovi library. Based on the results of the CFA and related reliability analysis, we excluded variables from each construct to optimize Cronbach’s alpha (see Table 3). However, for human capital, we kept the variable ‘university education’, although Cronbach’s alpha was lower. We did so because education is an important component of human capital. We transformed the original variable ‘education level’, which had several categories, into the variable ‘university degree’, reflecting whether the respondent had a university degree.
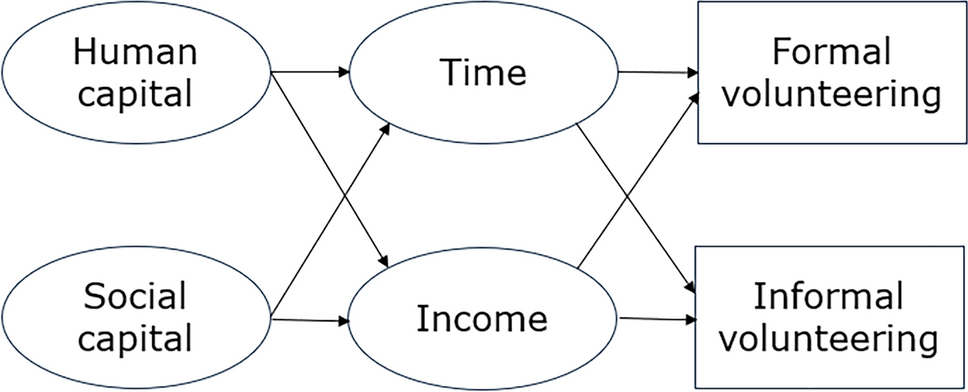
Finally, we performed diagonally weighted least squares-structural equation modeling (DLWS-SEM) via the SEM module with Lavaan syntax. DWLS is suitable for this type of data due to the high prevalence of categorical/ordinal variables and that it is robust to violations of normality. For optimization, we correlated (as suggested by modification indices in SEM library of Jamovi) formal volunteering and informal volunteering for the last 24 months (see the description of the relationships in Fig. 1).

Fig. 1 Tested model
We constructed reflective latent variables for human capital, social capital, time availability, and income. Human capital is comprised of household size, age, university degree, and employment status as theoretically discussed in Sect. 2.3. Social capital is composed of eleven indicators of trust (e.g., trust in government, trust in friends, trust in science, again, theoretically discussed in Sect. 2.3). For the latent variable of time availability, we use pension status and part-time employment. The last latent variable, income, is a single-item construct based on the income of the household. The composition of these latent constructs, following optimization, can be seen in Table 3 (we also provide the descriptive statistics about the variables in our sample in Annex 1, and the initial version of the model in Annex 2). Additionally, we include two single variables in the models, which concern whether individuals engage in formal or informal volunteering (Fig. 2).
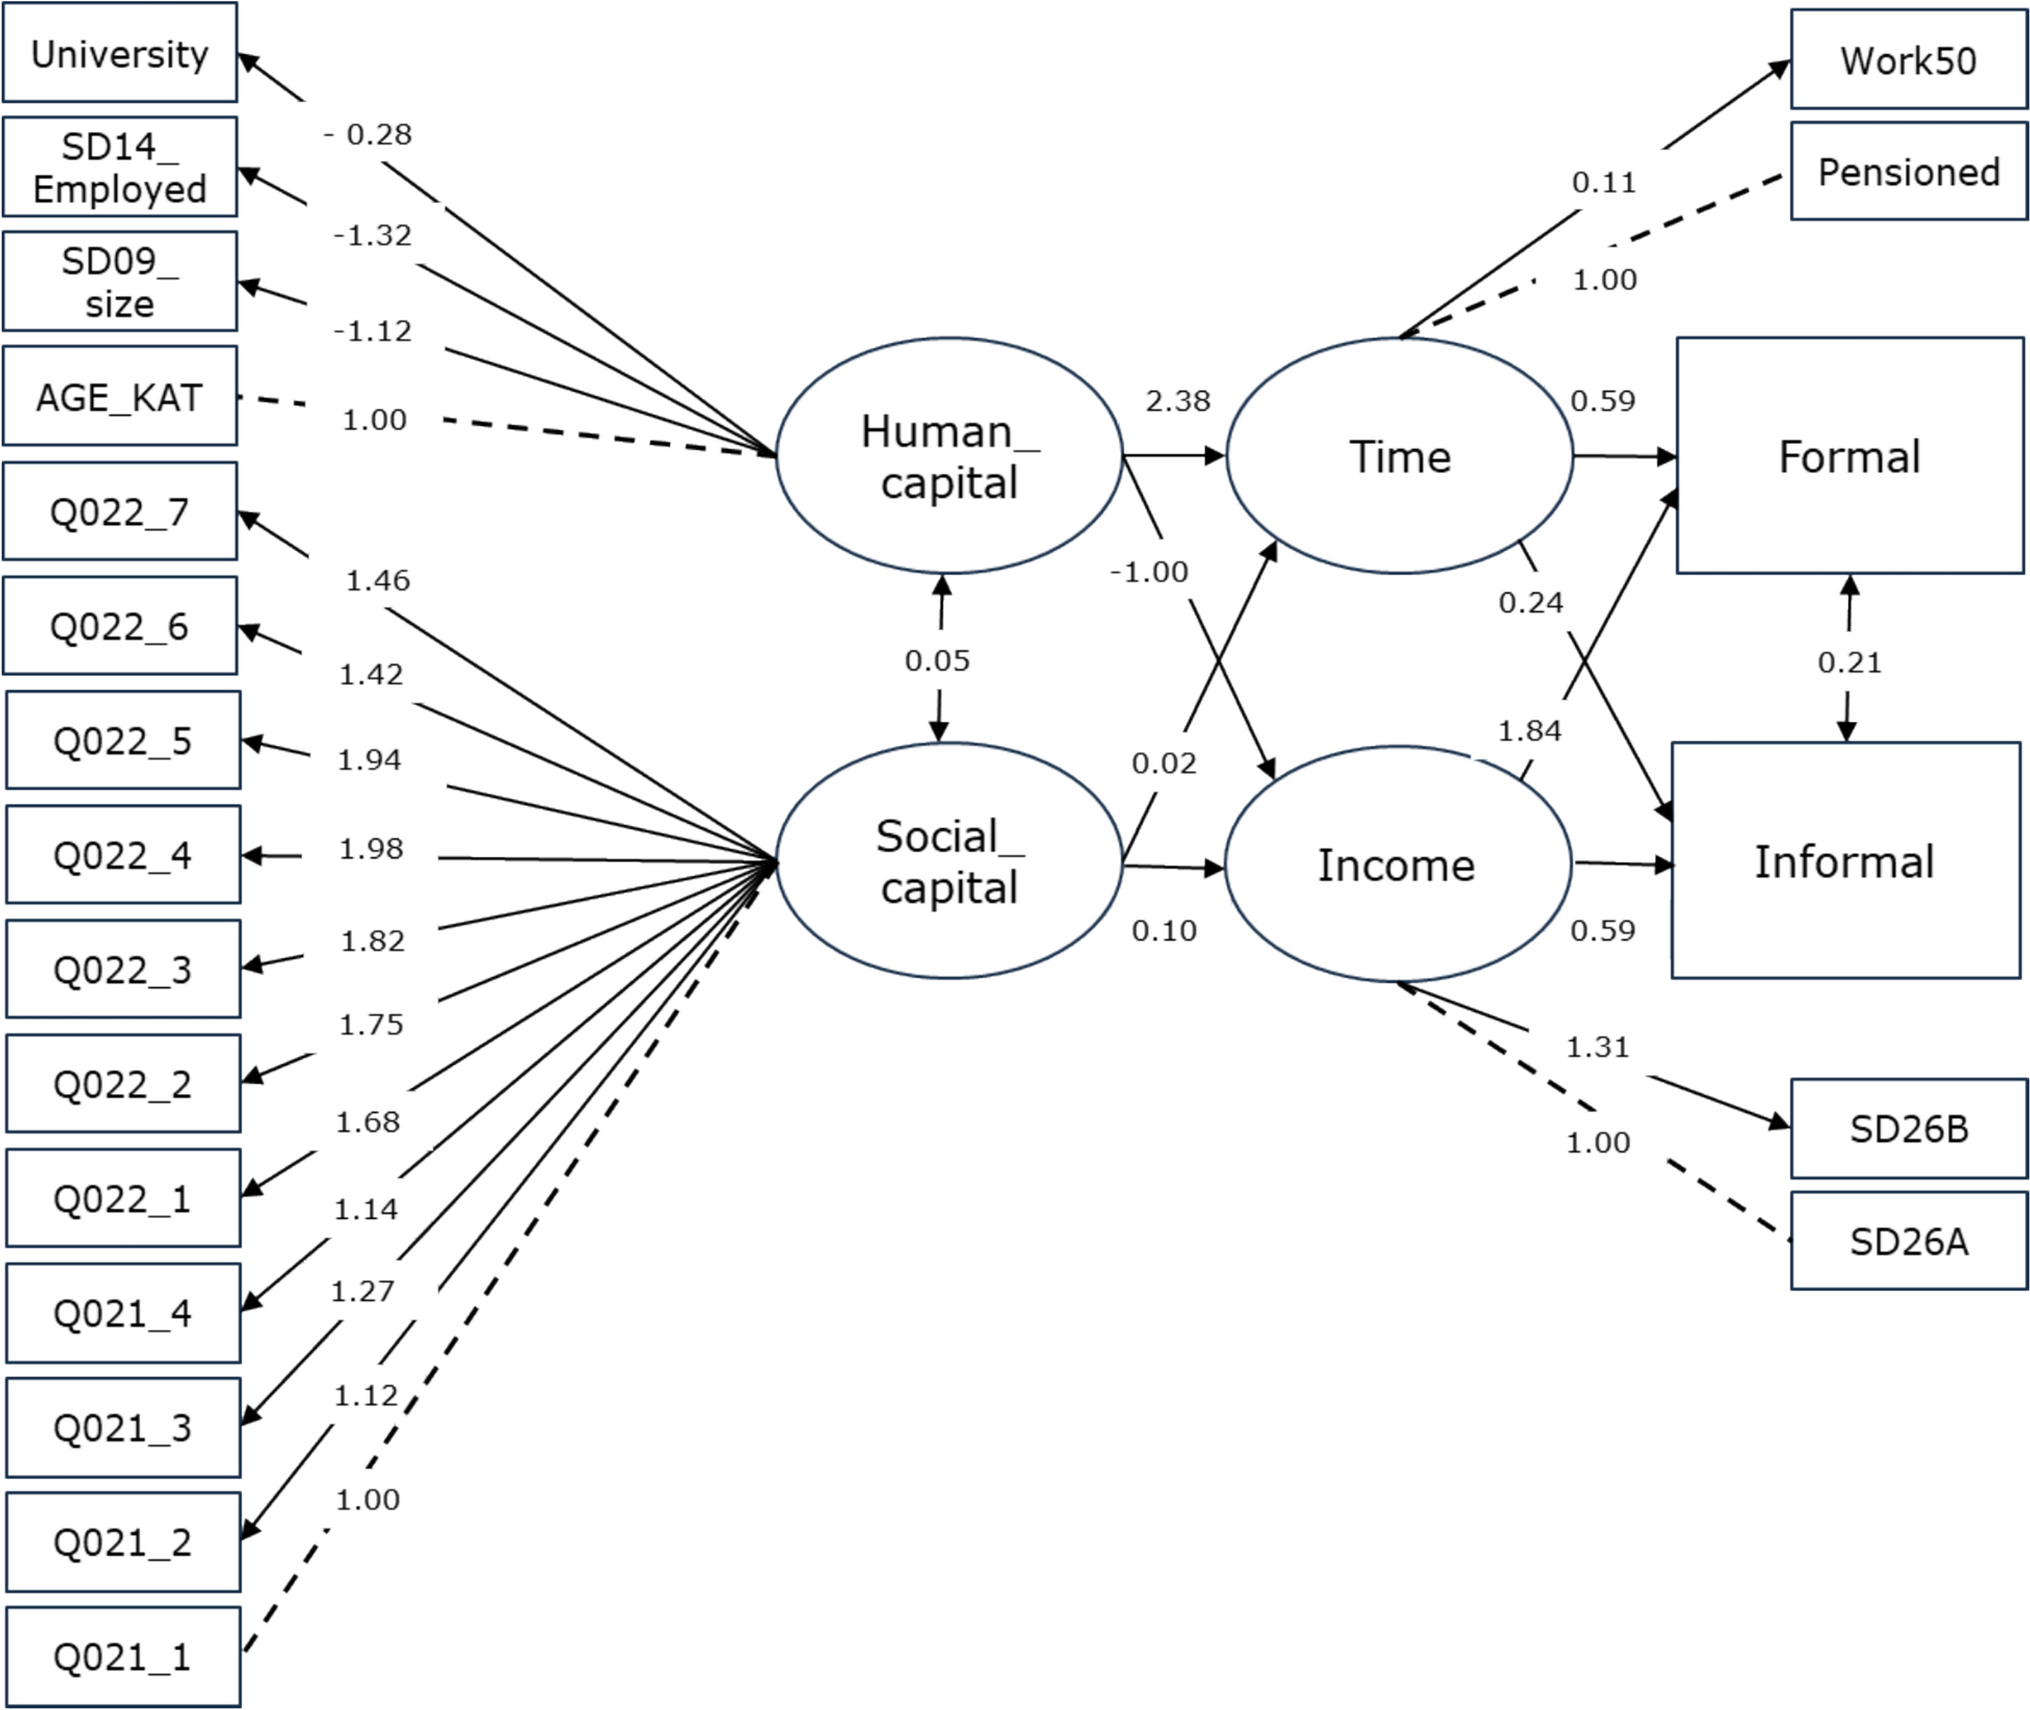
Fig. 2 Results of the SEM model. Notice: See the information about variables used in Annex 1
Results and Discussion
The basic statistics of the data sample show that two-thirds of the population in the Visegrad countries were currently engaged in or had previously participated as volunteers (see Table 2). From this perspective, it is also evident that it is easier for people to engage as informal volunteers, as this form of volunteering requires less preparation and can be more spontaneous (Trautwein et al., Reference Trautwein, Liberatore, Lindenmeier and von Schnurbein2020; Whittaker et al., Reference Whittaker, McLennan and Handmer2015), either in normal life or in emergencies.
We also see differences in engagement across countries in our sample. Czechia is at the forefront in terms of the share of people who engage in both types of volunteering (40.7%), while in other countries this proportion is around 30%. Central European countries are more stratified in terms of people who do not engage at all. Czechia is again at the forefront with only 22.2% of respondents not involved anywhere, followed by Hungary (27.9%), Slovakia (36.8%), and Poland (45.8%).
Moreover, the direct likelihood of volunteering for an organization and informal volunteering was positively correlated and statistically significant (0.573, p-value: 0.000). Thus, preconditions for volunteering affect both types of volunteering.
Results of the SEM
The whole model fit was good; the comparative fit index (CFI) (= 0.872) was still less than 0.9 even after the latent variables were optimized, and the root mean square error of approximation (RMSEA) value (= 0.079) was quite high. The ratio of χ2 and df was > 3 (specifically > 13, p-value < 0.001), indicating a poor model fit.
Discussion
Human and Social Capital in Forming Preconditions for Volunteering
There were two main aspects contributing to social capital and human capital in our model. When constructing the latent variables (see Table 3 for details), trust in social capital emerged as an important factor. However, it involves not only trust in people but also in institutions (similarly to Kneidinger, Reference Kneidinger2010) in terms of the overall variety of understanding of the term “trust”. This finding is noteworthy because trust is generally low in Visegrad countries compared to other countries in Western Europe (Potluka et al., Reference Potluka, Kalman, Musiałkowska, Idczak, Kerley, Liddle and Dunning2018). Nevertheless, this finding confirms the role of trust in the composition of social capital, as discussed by Putnam (Reference Putnam1993, Reference Putnam2000), regardless of the overall level of trust in a given society. However, the results also indicate that social capital is shaped more by trust in various types of institutions than by trust in individual people or groups. It concerns trust in local and regional governments, which was the most influential in our sample. When comparing the cumulative values of trust in people versus trust in institutions and analyzing their relationship to the age of respondents, we found that trust in people correlates more strongly with age (0.110, p-value 0.000) than trust in institutions to age (0.055, p-value 0.003). This finding aligns with the notion that older individuals tend to be more skeptical of institutions. This skepticism may stem from the legacy of the communist regime (Potluka et al., Reference Potluka, Kalman, Musiałkowska, Idczak, Kerley, Liddle and Dunning2018), during which there was widespread distrust of institutions due to the significant power distance (see, for example, the discussion about trust and power distance in Kaasa & Andriani, Reference Kaasa and Andriani2022), or it may result from disappointment with developments over the past 30 years.
In the case of human capital, experience appeared to be a strong factor, as increased age (used as a proxy for work experience) increases people’s human capital and employability (Grönlund, Reference Grönlund2011), because older individuals had more time to collect experience or learn. The size of household follows as the second highest factor loading and reflects the importance of social contacts for volunteering (Brown & Ferris, Reference Brown and Ferris2007; Dang et al., Reference Dang, Seemann, Lindenmeier and Saliterer2022; Lim & Laurence, Reference Lim and Laurence2015; Putnam, Reference Putnam2000; Ramaekers et al., Reference Ramaekers, Verbakel and Kraaykamp2022), while university education is the least related to the construct of human capital in our model (similarly to Potluka & von Schnurbein, Reference Potluka and von Schnurbein2025).
Availability of Time and Income
Although human capital is taken as an important precondition for volunteering, it also has limiting aspects. Busy people have less time to volunteer. Thus, in our models, it appeared that those having part-time jobs or already retired have time to volunteer. It is in compliance with findings of (Haski-Leventhal et al., Reference Haski-Leventhal, Meijs, Lockstone-Binney, Holmes and Oppenheimer2018; Sundeen et al., Reference Sundeen, Raskoff and Garcia2007).
In case of income, both individual and household income play a positive role, though the income of the households is more important. It only underlines the importance of economies of scale in larger families or households. Again, our findings are in compliance with the previous research (e.g., Potluka & von Schnurbein, Reference Potluka and von Schnurbein2025).
Effects on Volunteering
When the impacts of the availability of financial resources and time on both types of volunteering were compared, resources were a more significant factor than the availability of time in influencing engagement. With fewer financial resources, the likelihood of volunteering declines faster than with less available time. This finding is in accordance with previous research, as unemployed people do not accept unpaid work (Taniguchi, Reference Taniguchi2006), and in less wealthy communities, there is a lack of infrastructure for volunteering (Lim & Laurence, Reference Lim and Laurence2015). These results also confirm the resource theory application in volunteering (Hustinx et al., Reference Hustinx, Grubb, Rameder and Shachar2022; Seabe & Burger, Reference Seabe and Burger2022; Wilson, Reference Wilson2000).
Moreover, socioeconomic resources were more strongly related to formal volunteering than to informal volunteering (Mitani, Reference Mitani2014). This confirms that it is easier to start informal volunteering and therefore even people with fewer resources can do it (Pettigrew et al., Reference Pettigrew, Jongenelis, Jackson and Newton2019). On the other hand, it underlines the usual approach of organizations to recruiting volunteers, where these organizations focus on better-off people with the assumption that they have more resources available and therefore are more likely to provide some (Shandra, Reference Shandra2017).
Although we identified strong ties between formal and informal volunteering, some of the volunteer population invests time in only one type of engagement. Pettigrew et al. (Reference Pettigrew, Jongenelis, Jackson and Newton2019) explain this difference with respect to the concern, especially among informal volunteers, that if they were formally involved in an organization, they would have less time to devote to their informal volunteering for people whom they know better.
A similar effect to that observed for financial resources is also seen with time as a resource available for volunteering. As the availability of time increases, participation in formal volunteering rises more quickly than in informal volunteering. Conversely, when time is limited, people tend to leave formal volunteering more rapidly than informal volunteering. This underscores the importance of time as a crucial resource for volunteering. When people are occupied with job duties or family care, their availability to volunteer becomes limited (Taniguchi, Reference Taniguchi2006). Indeed, time constraints are among the most frequently mentioned obstacles to volunteering (Haski-Leventhal et al., Reference Haski-Leventhal, Meijs, Lockstone-Binney, Holmes and Oppenheimer2018; Sundeen et al., Reference Sundeen, Raskoff and Garcia2007).
As our model indicates, individuals with more available time are more likely to be engaged in volunteering, particularly retired people (Einolf & Yung, Reference Einolf and Yung2018). Additionally, these individuals often have more work experience. Furthermore, those working up to 50% of their time also have time available for volunteering (Seabe & Burger, Reference Seabe and Burger2022). However, for unemployed individuals, the model does not show increased participation, suggesting that factors other than time availability play a role.
The two forms of volunteering (formal and informal) are complementary rather than substitutive. Our study confirms that individuals who engage in one type of volunteering are likely to participate in the other form as well (similarly as conclusion by Simonson, Reference Simonson2017). Differences in engagement may be influenced by who people spend their time with (Taniguchi, Reference Taniguchi2011) and the other responsibilities they perceive (Pettigrew et al., Reference Pettigrew, Jongenelis, Jackson and Newton2019). This relationship could be an important factor in addressing societal challenges where volunteering is valuable support to the services provided by the public sector, such as care for older people. Individuals can leverage the knowledge and skills gained in one type of volunteering to enhance their contributions to the other. For example, volunteers involved in care for older people may receive formal training from organizations, which they can then apply in informal settings, thereby enriching both types of volunteering experiences.
Conclusions
In our research, we aimed to explore whether informal and formal volunteering compete for the same pool of engaged individuals and to identify the sociodemographic characteristics that influence simultaneous involvement in both forms of volunteering through the lenses of human and social capital, and availability of resources as wealth and time.
The study contributes to our theoretical knowledge of volunteering in three main aspects. First, we confirmed the positive link between formal and informal volunteering. If people engage in one form of volunteering, the likelihood of their engagement in the other form increases. Thus, the two forms of volunteering do not compete but rather complement each other. Our survey shows that informal and formal volunteering complement each other, which is of great importance for both volunteers and voluntary organizations. Volunteers, if they acquire greater competencies for volunteering during formally organized volunteering (especially through training), then use these competencies in informal volunteering after leaving the volunteer organization. The costs spent on formal volunteering are not lost, but on the contrary, they help to develop the informal civic sector. At the same time, often informal, spontaneous volunteering leads to a greater interest in citizens' volunteering, and often these volunteers continue in organizations as part of formal volunteering.
This conclusion has implications in relation to resource theory. It allows volunteers to be engaged where barriers to engagement are lower and then to be used where there are inequalities in volunteering and barriers to engagement.
Second, our findings indicate that income level has a stronger influence on both formal and informal volunteering than the availability of time. This suggests that financial resources play a critical role in enabling or constraining access to volunteering opportunities, highlighting a potential inequality in volunteer participation based on economic status, confirming resource theory in volunteering. The disparity in wealth and income could therefore be a significant barrier, limiting the ability of lower-income individuals to engage in volunteering activities.
Third, formal volunteering appears to be more sensitive to fluctuations in the availability of both financial resources and time among potential volunteers. This observation aligns with existing theoretical frameworks, which suggest that formal volunteering requires a higher level of commitment, including the need for specific knowledge, skills, and resources, as well as a psychological commitment to the organization. This explains why individuals often begin with informal volunteering before transitioning to formal roles within organizations. The perceived demands and responsibilities associated with formal volunteering can be a deterrent for those with limited resources or time, making informal volunteering a more accessible entry point.
Overall, our research highlights the complementary nature of formal and informal volunteering, the significant role of financial resources in volunteer engagement, and the varying demands associated with different types of volunteering. These insights contribute to a deeper understanding of how to better support and encourage volunteerism across different segments of the population, particularly in contexts, where demand for services is high and where volunteer contributions are increasingly vital.
We are aware of the limitations of our study. First, the analysis was based on a survey. Thus, people report their perceptions, not actual actions. This can especially influence reporting about informal volunteering, as people connect volunteering with formal engagement in NPOs, whereas informal volunteering is not recognized as volunteering, especially in wider families. Second, our dataset concerns Czechia, Hungary, Poland, and Slovakia, countries with a specific historical communist legacy and transition development that began approximately thirty years ago. In all included countries, the level of trust in other people in society is lower than that in Western European countries and also community life is not as developed as in Western Europe. Thus, future research should explore this avenue and test whether formal and informal volunteering fulfill the characteristics of complements also in other countries.
Funding
Open access funding provided by University of Basel.
Declarations
Conflict of interest
We confirm that this manuscript has not been published elsewhere and is not under consideration by another journal. All authors have approved the manuscript and agree with submission to Voluntas: International Journal of Voluntary and Nonprofit Organizations. We have read and have abided by the statement of ethical standards for manuscripts submitted to Voluntas: International Journal of Voluntary and Nonprofit Organizations. The authors have no conflicts of interest to declare.
Annex 1 Descriptive Statistics
|
Question |
N |
Missing values |
Mean |
Median |
SD |
Min |
Max |
|
|---|---|---|---|---|---|---|---|---|
|
Formal volunteering |
Q100 |
2034 |
0 |
0.326 |
0.00 |
0.469 |
0 |
1 |
|
Informal volunteering |
Q460A |
2034 |
0 |
0.483 |
0.00 |
0.500 |
0 |
1 |
|
Household income |
SD26A |
2034 |
0 |
2.74 |
3.00 |
1.49 |
1 |
6 |
|
Trust in relatives |
Q021_1 |
2030 |
4 |
7.44 |
8.00 |
2.56 |
0 |
10 |
|
Trust in friends |
Q021_2 |
2032 |
2 |
6.71 |
7.00 |
2.36 |
0 |
10 |
|
Trust in neighbors |
Q021_3 |
2026 |
8 |
4.93 |
5.00 |
2.53 |
0 |
10 |
|
Trust in strangers |
Q021_4 |
2026 |
8 |
3.22 |
3.00 |
2.39 |
0 |
10 |
|
Trust in government |
Q022_1 |
2029 |
5 |
2.79 |
2 |
2.91 |
0 |
10 |
|
Trust in parliament |
Q022_2 |
2024 |
10 |
2.72 |
2.00 |
2.71 |
0 |
10 |
|
Trust in courts of justice |
Q022_3 |
2021 |
13 |
3.71 |
3 |
2.79 |
0 |
10 |
|
Trust in region |
Q022_4 |
2010 |
24 |
3.84 |
4.00 |
2.70 |
0 |
10 |
|
Trust in municipality |
Q022_5 |
2025 |
9 |
4.12 |
4 |
2.77 |
0 |
10 |
|
Trust in media |
Q022_6 |
2028 |
6 |
3.58 |
3.00 |
2.75 |
0 |
10 |
|
Trust in science |
Q022_7 |
2026 |
8 |
6.08 |
6.00 |
2.66 |
0 |
10 |
|
Working at 50% max |
SD14_Employed |
2034 |
0 |
0.0575 |
0.00 |
0.233 |
0 |
1 |
|
Being pensioned |
Pensioned |
2034 |
0 |
0.197 |
0.00 |
0.398 |
0 |
1 |
|
University degree |
University |
2034 |
0 |
0.218 |
0.00 |
0.413 |
0 |
1 |
|
Employed |
Work50 |
2034 |
0 |
0.604 |
1.00 |
0.489 |
0 |
1 |
|
Size of the household |
SD09_size |
2029 |
5 |
2.87 |
3.00 |
1.44 |
1.00 |
17.0 |
|
Age |
AGE_KAT |
2026 |
8 |
3.69 |
4.00 |
1.58 |
1 |
6 |
Annex 2 Variables Considered in the Full Model (Before Confirmatory Factor Analysis)
|
Latent variables |
Variable |
Information about content |
|---|---|---|
|
Formal volunteering |
Volunteered in last 24 months, 1—YES, 0—NO |
|
|
Informal volunteering |
Volunteered in last 24 months, 1—YES, 0—NO |
|
|
Income |
Categories are displayed in Table 1 |
|
|
Social capital |
Trust in government |
Intensity from 0 (min) to 10 (max) |
|
Trust in parliament |
Intensity from 0 (min) to 10 (max) |
|
|
Trust in courts of justice |
Intensity from 0 (min) to 10 (max) |
|
|
Trust in region |
Intensity from 0 (min) to 10 (max) |
|
|
Trust in municipality |
Intensity from 0 (min) to 10 (max) |
|
|
Trust in media |
Intensity from 0 (min) to 10 (max) |
|
|
Trust in science |
Intensity from 0 (min) to 10 (max) |
|
|
Engagement in helping other people |
1—YES, 0—NO |
|
|
Frequency of meeting with friends |
Categories from: 1-never, 7-every day |
|
|
Trust in strangers |
Intensity from 0 (min) to 10 (max) |
|
|
Trust in neighbors |
Intensity from 0 (min) to 10 (max) |
|
|
Trust in friends |
Intensity from 0 (min) to 10 (max) |
|
|
Trust in relatives |
Intensity from 0 (min) to 10 (max) |
|
|
Time |
Support by the employer |
1—YES, 0—NO |
|
Being pensioned |
If not employed, being pensioned, 1 = YES, 0 = NO |
|
|
Being unemployed |
If not employed, being unemployed, 1 = YES, 0 = NO |
|
|
Being home |
If not employed, being home, 1 = YES, 0 = NO |
|
|
Working at 50% max |
Employed only partly (up to 50%), 1 = YES, 0 = NO |
|
|
Human capital |
Education |
Categories are displayed in Table 2 |
|
Employed |
Employment or freelance work no matter of the size, 1—YES, 0—NO |
|
|
Size of the household |
Number of people living in a household |
|
|
Time living at the same place |
1 – since birth, 2—longer than ten years, 3—three to ten years, 4—one to three years, 5—up to one year |
|
|
Nationality |
1—SK/HU/PL/CZ, 2—other |
|
|
Gender |
1—man, 2—woman |
|
|
Age |
Categories: 1–18–24, 2–25–34, 3–35–44, 4–45–54, 5–55–64, 6–65 and more |
|
|
Country |
1—Slovakia, 2—Hungary, 3—Poland, 4—Czech Republic |
Sociodemographic data of the survey
Numbers of Respondents and Types of Surveys.
|
Country |
Total |
CAWI |
CATI |
Average filling time (min.) |
|
|---|---|---|---|---|---|
|
Slovakia |
402 |
272 |
130 |
14 |
|
|
Hungary |
452 |
302 |
150 |
14 |
|
|
Poland |
600 |
400 |
200 |
13 |
|
|
Czechia |
580 |
432 |
148 |
18 |
|
|
Total |
2034 |
1406 |
628 |
15 |
|
Numbers of Respondents in V4 Countries—Structure by Gender.
|
Gender/country |
SK |
HU |
PL |
CZ |
Total |
|||||
|---|---|---|---|---|---|---|---|---|---|---|
|
Male |
195 |
48.5% |
234 |
51.8% |
292 |
48.7% |
280 |
49.2% |
1001 |
49.2% |
|
Female |
207 |
51.5% |
218 |
48.2% |
308 |
51.3% |
300 |
50.8% |
1033 |
50.8% |
|
Total |
402 |
452 |
600 |
580 |
2034 |
Numbers of Respondents in V4 Countries – Structure by Age.
|
Age/country |
SK |
HU |
PL |
CZ |
Total |
|||||
|---|---|---|---|---|---|---|---|---|---|---|
|
18–24 |
43 |
10.7% |
32 |
7.1% |
74 |
12.3% |
41 |
7.1% |
190 |
9.3% |
|
25–34 |
66 |
16.4% |
61 |
13.5% |
129 |
21.5% |
98 |
16.9% |
354 |
17.4% |
|
35–44 |
81 |
20.1% |
85 |
18.8% |
135 |
22.5% |
94 |
16.2% |
395 |
19.4% |
|
45–54 |
65 |
16.2% |
81 |
17.9% |
114 |
19.0% |
133 |
22.9% |
393 |
19.3% |
|
55–64 |
67 |
16.7% |
70 |
15.5% |
89 |
14.8% |
115 |
19.8% |
341 |
16.8% |
|
65 + |
80 |
19.9% |
123 |
27.2% |
59 |
9.8% |
91 |
15.7% |
353 |
17.4% |
|
Missing |
8 |
1.4% |
8 |
0.4% |
||||||
|
Total |
402 |
452 |
600 |
580 |
2034 |
|||||
|
Average age |
46.8 |
50.5 |
43.0 |
47.8 |
46.8 |
|||||
|
Min |
18 |
18 |
18 |
18 |
18 |
|||||
|
Max |
84 |
85 |
87 |
79 |
87 |
|||||
|
St.D |
16.6 |
16.7 |
15.1 |
15.1 |
16.0 |
|||||
|
Shapiro–Wilk W (p-value) |
2.84x 10⁻⁷ |
4.79x 10⁻⁸ |
4.56x 10⁻⁹ |
1.72x 10⁻⁷ |
5.39x 10⁻¹⁸ |
Numbers of Respondents in V4 Countries – Structure by Education.
|
Edu. /country |
SK |
HU |
PL |
CZ |
Total |
|||||
|---|---|---|---|---|---|---|---|---|---|---|
|
None |
0 |
0.0% |
0 |
0.0% |
2 |
0.3% |
0 |
0.0% |
2 |
0.1% |
|
Primary school |
35 |
8.7% |
20 |
4.4% |
24 |
4.0% |
35 |
6.0% |
114 |
5.6% |
|
Second.—no FE |
95 |
23.6% |
106 |
23.5% |
175 |
29.2% |
185 |
31.9% |
561 |
27.6% |
|
Second.—+ FE |
188 |
46.8% |
245 |
54.2% |
290 |
48.3% |
190 |
32.8% |
913 |
44.9% |
|
University |
84 |
20.9% |
81 |
17.9% |
109 |
18.2% |
170 |
29.3% |
444 |
21.8% |
|
Total |
402 |
452 |
600 |
580 |
2034 |


 Open access