
Of all the physical sciences, meteorology depends more than any other on frequent, accurate and worldwide measurements. Every day, millions of weather measurements are made by people and automated sensors across the globe, on land, over the oceans, in the upper reaches of the atmosphere and from space, providing the raw data essential to supercomputer-based weather forecasting models that are vital to modern economies. Meteorology (and its statistical cousin, climatology) is one of the few sciences where both amateurs and professionals make significant contributions.
Society ‘measures the weather’ for many different reasons: as well as input to weather and climate forecasts, it is a vital part of aviation safety, critical in detecting and quantifying climate change, keeping tabs on typhoons and hurricanes, monitoring the ebb and flow of pollutants and arctic ice, and hundreds of other applications of enormous benefit to the community. Accurate surface measurements provide essential ‘ground truth’ to the broad-brush data sweeps of remote sensing capabilities such as satellite and radar. Weather records are made in every country and region in the world – from the hottest deserts to the coldest ice sheets in Antarctica, from densely populated city centres to the most remote mountaintops. The latter category includes a network of six automatic weather stations (AWS) on Mt Everest (Figure 1.1), from Phortse at 3810 m (about 640 hPa) and Base Camp at 5315 m (about 530 hPa), to the highest weather station on Earth at Everest’s Bishop Rock, 8810 m above mean sea level (about 340 hPa), just below the summit at 8849 m [Reference Matthews1,Reference Wilkinson2,3].
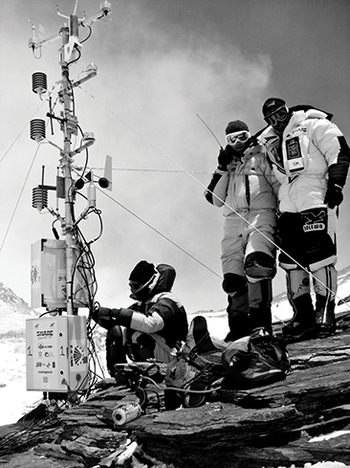
Figure 1.1 Installing one of the world’s highest weather stations, the ‘Balcony Station’ at 8430 m above sea level on the south col of Mt Everest, just below the summit at 8849 m.
For many, professionals and amateurs alike, measuring the weather is also an absorbing long-term interest, guaranteed to deliver something different every day of every year. Records kept by individuals and organisations alike assist in the scientific analysis of all types of weather phenomena, and can become a permanent part of a nation’s weather record.
About this book
This book has been written with four main audiences in mind:
Professional users, including local or state authorities and other statutory bodies
Weather enthusiasts and amateur meteorologists
Schools, colleges and universities
Weather-dependent outdoor activity professions and organisations.
The aim of this book is to provide useful, independent and practical guidance on most aspects of weather observing, with emphasis on instrumental observations. Throughout, the information and standards set out in this volume are based upon the authority and guidance of the Geneva-based World Meteorological Organization’s (WMO) latest Guide to Meteorological Instruments and Methods of Observation publication, otherwise known as the WMO CIMO guide (CIMO being the Commission for Instruments and Methods of Observation) [4]. By necessity in its role as a global reference and being written for a professional, specialised audience, the CIMO guide is very detailed and often highly technical. In contrast, this book is intended as the ‘everyday CIMO guide’, with content sufficiently detailed for most purposes, but where individual topics can be referenced quickly and easily back to WMO standards and guidelines as necessary. The focus of this new edition is primarily on the selection and use of modern electronic instruments and automatic weather stations (AWS), although sections on the history and use of ‘traditional’ instruments within the twenty-first-century context have been retained where appropriate.
Professional users
There are many ‘professional’ users who need reliable and accurate weather information, whether at a single site or from multiple locations, whose needs can be served by one or more properly sited AWS. Typical users include local or state authorities managing road maintenance (including winter gritting or snow clearance), landfill management, airport or airfield weather systems, environmental monitoring as part of civil engineering projects, outdoor field study centres and many more. For professional users requiring environmental records, perhaps as part of new statutory requirements, this handbook provides independent guidance on choice of systems, siting of sensors and suggestions on data collection and handling processes. The information gathered needs to be both manageable and relevant, while meeting both the appropriate standards of measurement and exposure and budget restrictions. It also includes advice on how to document the site and instruments in use (and any changes over time), to minimise possible future downstream technical or legal challenges relating to the records made.
Weather enthusiasts and amateur meteorologists
For individuals who are new to the fascinating science of measuring the weather, this book is intended to help guide your choice of what may be your first item or items of weather-measuring equipment. It explains the important things to look out for, what can be measured within particular budgets, how best to site your instruments, and how to start collecting and sharing data. Whether your site and equipment is basic and sheltered, or extensive and well exposed, this book provides help to improve the quality and comparability of your observations to attain, or even surpass, the standards set out by the World Meteorological Organization.
For those who already have experience of weather observing and who already own a basic AWS and are looking to add additional sensors or upgrade to a more capable system, or those who are considering upgrading an AWS to complement or replace existing ‘traditional’ instrumentation (particularly ‘legacy’ mercury thermometers and barometers), this book provides assistance and suggestions on choosing and siting appropriate equipment. It is also a practical day-to-day observing reference handbook to help get the most out of your instruments and your interest.
Schools, colleges and universities
The installation of automated weather-monitoring equipment offers the chance to include weather observations at all levels within the educational curriculum, from early schooldays to post-doctoral levels. Weather measurements are often made more relevant and interesting to the student by virtue of the readings being made at the school or college site, particularly where both real-time and archived records can be made easily available. From elementary school to university, the observations can be used immediately (especially so in an interesting spell of weather, such as a heatwave or flood event) or in a variety of curricular activities such as numeracy, IT, telecommunications, climate change as considered within the school curriculum, severe weather awareness training and alarms, office software packages (particularly spreadsheets), statistics and website design, in addition to conventional science, geography, and mathematics courses. There are dozens of websites giving examples of the installation and use of school weather stations: this book provides independent assistance on choosing and siting suitable systems and making best use of the data collected.
Many of those who have gone on to study meteorology further, and became professional meteorologists, picked up the ‘weather observing’ bug at school (including the author). The importance of encouraging curious young minds to observe and take an active and enquiring interest in their physical environment on a day-to-day basis, and the ‘bigger picture’ of global climate change with its risks and consequences, cannot be underestimated.
Weather-dependent outdoor activity professions and organisations
Many organisations or clubs need site-specific weather information; for example, field study centres, yacht clubs, gliding or parachuting clubs and private aviation airfields, as well as windsurfers and microlight pilots. In some cases, particularly microlight and gliding clubs, members may live a considerable distance from the main club operations and value the opportunity to be able to view live weather conditions at the site on a club website before making a decision on whether to travel to the club that day. Farmers and other professions largely at the mercy of the weather also need accurate and timely weather information, perhaps from more than one site within a local area. Many such organisations or businesses may not have previously considered their own weather station or monitoring network as being cost-effective. Today, respectable quality weather data in real time is available from inexpensive, easily maintained and robust systems. Modern electronic weather stations connected to the Internet can provide local or distant-reading output facilities quickly, cheaply and reliably; this book outlines what is available and where to site the instruments for best results.
Topics covered
Although the main focus of this book is on electronic instruments, current ‘traditional’ or legacy weather instruments – largely non-digital – and their development are also covered in this handbook. Many of these are being replaced, or indeed have already been, by their digital equivalents. Some still have an important part to play, not least in providing continuity with existing and historical records, but in many countries automated systems now supply the majority of meteorological measurements. This trend has been greatly accelerated by statutory restrictions on the manufacture and sale of mercury-based instruments, such as traditional thermometers and barometers, under UN Environment Programme regulations following the Minamata Convention, signed by 128 countries in 2013 and which came into force in 2020 [Reference Burt5]. Mercury is a powerful toxin, and while (understandably) both legal and WMO advice is to eliminate completely the use of mercury-based instruments, a very few exceptions may be sanctioned at long-period sites where a period of a few years of overlap records are beneficial to assess the consistency and homogeneity of the ‘new’ instrumentation alongside traditional methods. With such ‘replacement’ situations becoming more the norm, this book provides suggestions on how best to minimise the discontinuity of record that may happen when such changes are introduced – although in all cases the network administrator (such as NOAA in the United States, the Bureau of Meteorology in Australia or the Met Office in the United Kingdom) should also be consulted at the earliest opportunity.
This book covers a wide range of weather station systems, sensors and associated technology, from $100 (US) to upwards of $2,000 (nominal price guidelines correct at the time of going to press). It does not cover homemade instruments or remote-reading sensors lacking any means of logging (such as wireless temperature and humidity displays), nor does it cover in detail professional systems costing thousands of dollars upwards (for which more specific presales advice should be sought from the manufacturer). It covers land- and surface-based systems only. Sensors and logging equipment for aircraft, drones or buoys have very different characteristics and are outside the scope of this book.
Geographical coverage
As previously stated, this book covers equipment, standards and measurement methods for surface meteorological observations as set out by the World Meteorological Organization (WMO), based in Geneva, Switzerland [4]. The details of some measurements and methods differ slightly from country to country, and where applicable this book provides specifics relevant particularly within the United States, the United Kingdom and the Republic of Ireland. The majority of the book is also relevant outside these geographies, but readers in other regions should check the availability of products and the detail of country-specific equipment, specifications and siting recommendations with their national meteorological service prior to implementation. Details of, and links to, the world’s national weather services are available on the WMO website at https://community.wmo.int/members.
Abbreviations, references, footnotes and further reading
Abbreviations and technical terms are kept to a minimum: where used, they are defined at first use and indexed. The most frequently used abbreviations are listed at the front of the book for easy reference. References and suggestions for further reading are included towards the end of the book for readers who may wish to delve further into these topics. Specific references are indicated within the text by a number within square brackets (thus [Reference Fiebrich9]) and are listed in numerical order at the end of the book. Footnotes are indicated by symbols (thus * †) with the appropriate text appearing at the foot of the page on which the footnote appears.
A number of sample and template spreadsheets referred to within the book are available online at www.measuringtheweather.net. These are referenced to the appropriate point in the text and are available for free download. They can then be customised to your specific requirements.
Units
Meteorology is necessarily an international science, and consistent units are required for information exchange and understanding. In this book WMO recommendations for units are used in preference, with bracketed alternatives where necessary; for instance, wind speeds can be expressed in metres per second (m/s), knots (kn), miles per hour (mph) or kilometres per hour (kph), depending upon the country and requirement. Conversions between different units are given in Appendix 6.
Automatic weather stations
In this book an automatic weather station (AWS) is defined as any system which creates and archives a digital (computer-readable) record of one or more weather ‘elements’, such as air temperature, precipitation, sunshine, wind speed or other parameters.
In its simplest form, an AWS can be a single sensor integrated with a small, inexpensive electronic data recorder (a ‘datalogger’ or simply ‘logger’), which may simply be a memory chip within a circuit board, device or console. Loggers that can record only one input signal, or ‘channel’, are therefore ‘single-channel loggers’; those that can handle two or more are ‘multi-channel’. Most such systems can be left exposed as a complete package, including the logger within a suitable enclosure, perhaps for several months in a remote location, before the recorded data are retrieved. The most advanced AWSs (Figure 1.2) are completely automated remote multi-element, single-site observing systems built around a sophisticated (user-)programmable datalogger, requiring only the minimum of human attention and maintenance, self-powered by a solar cell array or wind turbine and communicating observations at regular intervals over a telecommunications system to a collecting centre. Telecommunications may be via satellite in remote areas.
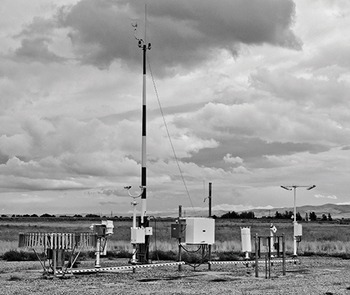
Figure 1.2 The US National Weather Service Automated Surface Observing System (ASOS) sensor package located at Pocatello, Idaho (42.917°N, 112.567°W, 1356 m above MSL, WMO station no. 72578). From left to right, the instruments shown are – heated tipping-bucket raingauge (TBR) within wind shield: aspirated temperature and humidity sensors: present weather sensor: 10 m wind mast with heated ultrasonic wind sensor: data collection panel (big box): laser ceilometers: freezing precipitation sensor (little tilted box), and finally the visibility sensor. See also www.weather.gov/asos.
Most of the world’s meteorological services are increasingly adopting such systems to replace costly human observers. But even with today’s most sophisticated technology and sensors, human observers are still required for many weather observing tasks; AWSs are still very poor at telling the difference between rain and wet snow, nor can they report shallow fog just starting to form across the low-lying parts of an airfield or see distant lightning flashes on the horizon warning of an approaching thunderstorm. Human weather observers will continue to be required for a long while to come!
The makers of the observations
Fascination with the changes in day-to-day weather is nothing new, although weather records were by necessity purely descriptive until the invention of meteorological instruments in the mid-seventeenth century [Reference Middleton6]. Probably the oldest known weather diary in the Western world is that of Englishman William Merle, who kept notes on the weather in Oxford and in north Lincolnshire from 1337 to 1344 [Reference Lawrence7, Reference Meaden8]. In North America, the earliest surviving systematic weather records are those made by Rev. John Campanius Holm, a Lutheran minister originally from Sweden, who made observations at Fort Christina in New Sweden (near present-day Wilmington, Delaware) in 1644–45 [Reference Fiebrich9]. (Today, the prestigious National Oceanic and Atmospheric Administration NOAA John Campanius Holm Award is given for outstanding accomplishments in the field of cooperative meteorological observations.)
During the Renaissance, the invention of instruments to measure the temperature and pressure of the atmosphere, and later other elements, made it possible to track the changes in weather conditions more accurately, and more consistently, between different observers and locations. Galileo invented the air thermoscope around 1600; Santorio added a scale to make it a thermometer in 1612. The first liquid-in-glass thermometer (in a form we would recognise today) was invented by Ferdinand II, the Grand Duke of Tuscany, in 1646, while Evangelista Torricelli invented the mercury barometer in 1644.
Surprisingly perhaps, what we would now call multi-element automated weather stations began to appear very early in the history of meteorological instruments. Sir Christopher Wren (1632–1723) is best known today as the architect of London’s St Paul’s Cathedral, but in his early career he was a noted astronomer and mathematician [Reference Tinniswood10,Reference Bennett11,Reference Tinniswood12], a founding member of the Royal Society in London in 1660 [Reference Gribbin13], and a prolific instrument designer. Together with Robert Hooke (1635–1703) he designed and built many weather instruments, including Hooke’s sophisticated mechanical ‘weather clock’ in the 1670s [Reference Mills14] (see Box, Wren and Hooke: the first automated weather station, 1678). The earliest surviving rainfall records in the British Isles were made by Richard Towneley at Towneley Hall near Burnley, Lancashire, in northern England from January 1677 [Reference Folland and Wales-Smith15]; the raingauge used was based upon Wren’s 1662/63 design of the tipping-bucket type. Modern varieties of Wren’s instrument are used to measure rainfall at hundreds of thousands of locations across the globe today (see Chapter 6, Measuring precipitation).
Wren and Hooke: the first automated weather station, 1678
Christopher Wren’s long friendship and professional collaboration with Robert Hooke spawned many designs for instruments to ‘measure the weather’. Wren is acknowledged as the inventor – around 1662/3 [Reference Biswas16] – of the tipping-bucket mechanism for measuring rainfall, the principle of which is still used in today’s instruments. Hooke was a polymath with a superb ability for translating ideas into practical working devices [Reference Mills14, Reference Inwood17, Reference Bennett18], and he built many weather instruments, including what can only have been the first automated weather station, as the following extract from the Royal Society Journal Book (JBO/6), dated 5 December 1678, shows:
Mr Hook[e] produced a part of his new weather Clock which he had been preparing which was to keep an Account of all the Changes of weather which should happen, namely the Quarters and points in which the wind should blow 2ly the strength of the Wind in that Quarter. 3ly The heat and cold of the Air. 4ly The Gravity and Levity of the Air. 5ly the Dryness and moisture of the Air. 6ly The Quantity of Rain that should fall. 7ly The Quantity of Snow or Hail that shall fall in the winter. 8ly the times of the shining of the Sun. This he was desired to proceed with all to finish he hoped to doe within a month or six weeks.
As materials and methods evolved, meteorological instruments became more practical, robust, reliable and cheaper, and thus were used more widely, carried to the New World on the ships of the European superpowers of the day. The once ubiquitous Six’s maximum-minimum thermometer was invented by James Six in 1782 [Reference Austin and McConnell19], and although these instruments ceased to be used for accurate climate recording over 150 years ago, they can still be found today in many a gardener’s greenhouse (Figure 1.3). In the early nineteenth century one of the first amateur meteorologists, apothecary Luke Howard of London, popularly known as ‘the inventor of clouds’ [Reference Hamblyn20], owned a magnificent – and very expensive – ‘clock-barometer’, or mercury barograph [Reference Blench21]. Records from this instrument survive today; a very similar instrument, made for Great Britain’s King George III in 1763–65 by Alexander Cumming (c. 1732–1814), remains in the Royal Collection [22].
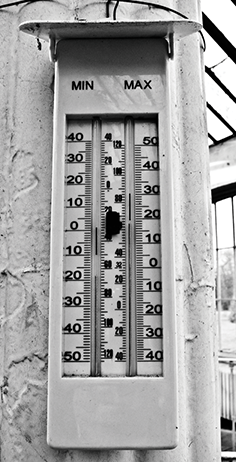
Figure 1.3 A Six’s maximum-minimum thermometer; this formerly in the Temperate House at Kew Gardens in west London.
Weather instruments benefited from the enormous technological and manufacturing advances made between the late eighteenth and late nineteenth centuries. Many of today’s instruments date from this period (see timescale in Figure 1.4) [Reference Middleton23] including the Stevenson screen (see Box, The lighthouse Stevensons). As late as the first decade of the current century, a meteorological observer from the late nineteenth century would have found little difficulty in making a standard observation in almost any weather station in the world, but as traditional instruments are rapidly superseded by newer electronic equipment, our time-traveller would today find it increasingly difficult even to recognise many instruments.
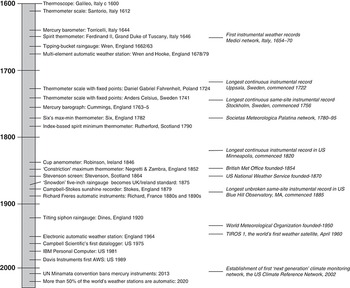
Figure 1.4 Four-hundred-year timeline showing key dates in the development of meteorological instruments and weather recording.
Recording meteorological instruments continued to be developed and improved during the eighteenth and nineteenth centuries, but while many ingenious designs were invented, almost all relied upon mechanical components and thus were, to a greater or lesser degree, subject to friction. They were also often extremely expensive (many were made to order or in very small numbers), and difficult to maintain in good working order when exposed to the elements. For these reasons few were made – and even fewer have survived, even in museums.
The lighthouse Stevensons
Thomas Stevenson (1818–Reference Thorne87) was a marine engineer; a member of the famous Stevenson engineering dynasty which built most of Scotland’s lighthouses [Reference Bathurst24, Reference Morrison-Low25], and the father of Robert Louis Stevenson (1850–94), author of Treasure Island (1881), Kidnapped (1886) and The Strange Case of Dr Jekyll and Mr Hyde (1886). In a brief note in the Journal of the Scottish Meteorological Society in 1864 [Reference Stevenson26] he described the form of thermometer shelter which still bears his name – a white-painted double-louvred box which protected the thermometers inside from rainfall, sunshine and infrared radiation from Earth and sky. At the time there were dozens of proposed designs for thermometer screens, some of which had been in use for a decade or more [Reference Middleton23]. It was only a series of painstaking trials undertaken by the Reverend Charles Griffith at Strathfield Turgiss rectory in Hampshire, England, in the late 1860s and early 1870s [Reference Burt27], comparing air temperatures measured in Stevenson’s screen with other models (Figure 1.5a), that eventually led to its adoption (with only minor amendments to the original design) as the preferred method for taking air temperature measurements by the Royal Meteorological Society in 1884 [28]. The de facto British standard spread rapidly to the rest of Britain’s empire and then to the rest of the world (Figure 1.5) as the enclosure was simple, easy to make locally, robust and gave good protection from the tropics to the poles. The basic principles – a white, louvred, roofed enclosure – remain common to many thousands of thermometer screens in daily use throughout the world today (Figure 1.6). Today, the original wooden construction has increasingly been superseded by low-maintenance plastic variants, as described in more detail in Chapter 5, Measuring the temperature of the air.
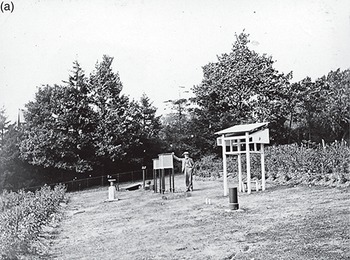
(a) This photograph was taken at Berkhamsted, Hertfordshire, England, on 29 July 1896, and shows two Stevenson screens (centre of picture) adjacent to a much larger modified Glaisher stand (an earlier and more open pattern of thermometer screen). The observer is Edward Mawley, President of the Royal Meteorological Society 1896–98.
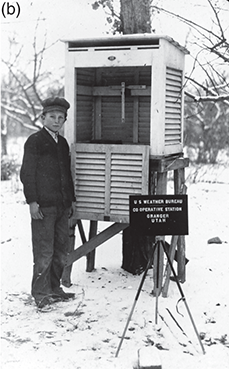
(b) Cotton Region Shelter (see Chapter 5) and young observer at US Weather Bureau observing site at Granger, Utah, c. 1930.
Figure 1.5 Early models of thermometer screen.
(b) Stevenson-type thermometer screen on the seafront at Cannes in the south of France.
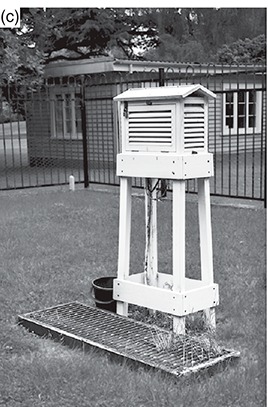
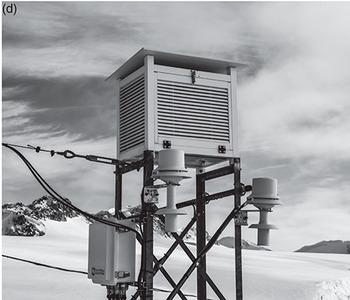
Figure 1.6 Stevenson-type thermometer screens in use on three continents and in the south polar regions.
The end of the nineteenth century saw the advent of relatively inexpensive, mass-produced, single-element mechanical recording instruments using clock-driven paper charts, such as the barograph and thermograph (Figure 1.7), and, later, various forms of automated rainfall recorders. These instruments revolutionised automated weather recording [Reference Multhauf29]. As a result, for over a century ‘automatic’ weather records were obtained by tedious and time-consuming manual analysis of paper-based records from these single-element instruments. Very few remain in regular use today, superseded by electronic systems much closer to Wren and Hooke’s original concept of the ‘weather clock’ – namely, a single mechanism to record multiple sensors – one which was 350 years ahead of its time.
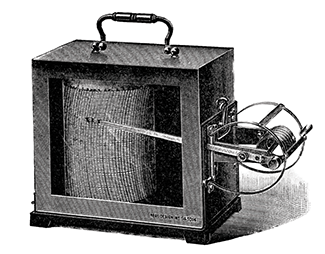
Figure 1.7 A thermograph from the London makers Short & Mason, 1913.
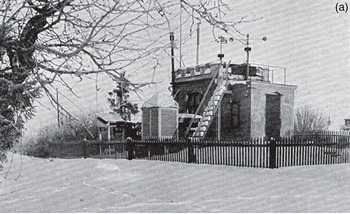
The modern AWS, consisting essentially of an electronic logging system connected to a variety of electrical sensors, began to take form in the early 1960s (Figure 1.8 [Reference Strangeways and Smith30]). It was the advent of cheap computing power, advances in data storage and telecommunications and the reduction in size and power requirements of electronic components resulting from the personal computer revolution during the 1980s that enabled the economies of scale needed for prices to fall sharply. One of today’s mid-range ‘personal’ AWS would have cost tens of thousands of dollars in the mid-1980s. Today, automatic high-quality, multi-element, remote wireless data display and logging are available for less than the price of a new clock-driven thermograph, with enormous additional benefits in data reliability, accuracy and precision.
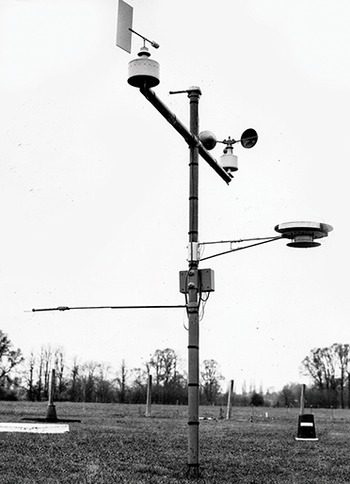
Figure 1.8 An early prototype automatic weather station at the then Institute of Hydrology in Wallingford, England, in the late 1960s.
The longest-running weather observations in the world
The earliest versions of many ‘traditional’ meteorological instruments were invented in Europe in the seventeenth or eighteenth century – the mercury barometer, mercury thermometer and various instruments to measure rainfall all made their first appearance in recognisably modern form around this time, and people began to keep instrumental weather records. At first these were individual efforts, experimental and sporadic, rarely lasting for more than a few years in any one place, and of course with widely differing standards of exposure, accuracy and (not least) units. The earliest surviving instrumental weather records are from the Medici network, based in Florence, Italy, covering the period 1654 to 1670. Thanks to tremendous historical detective work, these early records have since been recovered and made available for modern analysis [Reference Camuffo and Bertolin31]. We also have daily observations of a mercury barometer in Pisa, Italy, in 1657–58 [Reference Camuffo, Bertolin, Jones, Cornes and Garnier32], and for 1694 there are sufficient surviving barometric pressure records across Europe for outline daily synoptic weather maps to be prepared. An almost complete daily pressure record has been assembled for locations in Paris back to 1670, and for London since 1692 [Reference Cornes33, Reference Cornes34] with a few gaps back to Robert Hooke’s diaries starting in 1672.
In the early eighteenth century, regular and systematic weather records commenced in various places in Europe, often as part of the observational routine at astronomical observatories. Many of these observatories are still in existence, and at a few locations continuous weather observations have been made in much the same location for 200 years or more. Although most long-period records have been made in towns or cities, and as a result individual temperature records have been affected by urban growth and urban warming to a greater or lesser extent, the observations are still the most detailed and comprehensive records we have for ongoing evidence of climate change since the seventeenth century.
The longest temperature record in the world: 1659 to date
In 1953, the British climatologist Gordon Manley (1902–Reference Burt80) published his first paper on what became known as the Central England Temperature (CET) series in the Royal Meteorological Society’s Quarterly Journal [Reference Manley35]. Manley’s extensive and painstaking research assembled scattered early instrumental temperature records and descriptive weather diaries to produce a chronology of mean monthly temperatures covering the period 1698 to 1952 representative of a roughly triangular area of England enclosed by Lancashire, London and Bristol. A second, longer paper in 1974 [Reference Manley36] extended the series back to 1659 – about the time the earliest thermometers appeared in England – and brought it up-to-date. Other records that had come to light in the intervening 20 years also allowed for corrections or improved estimates to the existing series. Since Manley’s death the series has been kept up to date by the Hadley Centre, part of the UK Met Office, and today the series forms the longest instrumental record of temperature in the world. A similar monthly rainfall record, the ‘England and Wales Precipitation’ series, extends back to 1766 [37].
Early English temperature records are sufficiently numerous that an expanded daily temperature series back to 1778 has been assembled [Reference Parker, Legg and Folland38]. Daily ‘maximum’ and ‘minimum’ CET are also available back to 1878; since 1974 the data have been adjusted slightly to allow for urban warming.
Centennial sites
Manley’s work pieced together many disparate records to produce a figure representative of a region rather than a single location. There are other long composite series of temperature, rainfall and/or pressure records representative of other cities or regions in Europe extending back to the eighteenth century, but there are a perhaps surprising number of locations where instrumental weather records are still made today in the same location, or very nearly so, where continuous observations commenced at least 100 years ago. The World Meteorological Organization’s Centennial Observing Stations programme [39] was established in 2017 to identify and recognise these important observing locations. To qualify, the national meteorological service of the country concerned nominates site(s) meeting a number of criteria, chief amongst which are a period of record of not less than 100 years (with a minimum 90 per cent record availability), and which continues to date. Moves or relocations of the weather station over the period considered must have been minor and without significant impact on the homogeneity of the data series considered (which could be temperature, sunshine, rainfall and so on, or a combination of other elements), and in addition the data series themselves, together with information relating to the site and instruments, must be made available for scientific research. At the time of going to press, 291 stations have been recognised in this manner, although it remains a pity that the station records themselves, or links thereto, are not yet available through this useful WMO initiative.
The following paragraphs identify and briefly discuss some of the best-documented long records in Europe, North America and in Asia and the Pacific region. Details of the site and records therefrom have been taken from published work and/or the WMO Centennial Stations listings.
Europe
Locations of the sites listed in this section are shown in Figure 1.9.
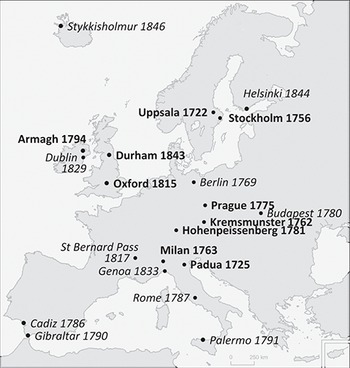
Figure 1.9 The locations of some of the longest-running meteorological records in Europe – see text for sources.
Uppsala, Sweden – 1722 to date
59.847°N, 17.635°E, 25 m above sea level
The oldest mostly continuous same-site meteorological records in the world are those from Uppsala, Sweden, about 65 km (40 miles) north of Stockholm, where records commenced in 1722 [Reference Bergström and Moberg40]. The earliest meteorological observations in the Nordic countries were initiated around 1720 by the Society of Science in Uppsala, when Professor Erik Burman started the observations there, assisted by the young Anders Celsius (1701–Reference Böhm44), who took over responsibility for the records in 1729.
The oldest surviving observatory journal dates from the year 1722, although there are some gaps in the Uppsala record until 1773. Before 1751 a variety of thermometer scales were used, amongst them of course Celsius’ own thermometer with the first Celsius scale, and this very fact of the record enabled researchers to check the calibration and consistency of the early records. Celsius’ own observatory, the Celsiushuset, still stands in central Uppsala. In September 1853, the observation site was moved to a then newly built astronomical observatory situated in open fields outside the town, about 1 km north-west of the original site (Figure 1.10a). Further changes of site took place in October 1865, June 1952 and August 1959, all within a few hundred metres of each other, as the original rural site had become increasingly urbanised as Uppsala expanded over the years (its population today is around 150,000). In August 1959 the observing site moved to the Department of Meteorology at Uppsala University, and in January 1998 a further move took place 1.4 km further south to ‘Geocentrum’ at the university’s Department of Earth Sciences. Today the observations are made hourly using a Campbell Scientific AWS (Figure 1.10b). In September 2022, an international symposium was held at Uppsala University to celebrate the completion of 300 years of records [Reference Burt41]. In this long record, the extremes of temperature to date have been –39.5 °C in January 1875, and 37.4 °C in July 1933.
(a) The instruments in Observatory Park, where measurements were made 1853–1952 (Uppsala University).
(b) The current site at Uppsala University Geocentrum.
Figure 1.10 Weather records have been made in Uppsala, Sweden, since 1722.
Padova (Padua), Italy – 1725 to date
45.402°N, 11.869°E, 20 m above sea level
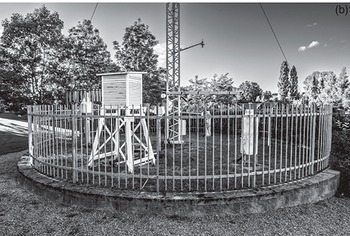
Meteorological observations commenced as part of the astronomical observational routine in Padova (Padua) in northern Italy in 1725 [Reference Cocheo and Camuffo42]. Until 1767, observations were made by various individual observers in their own dwellings within the town, but from 1768 to 1962 the records were kept at the Specola complex in the centre of Padua (Figure 1.11). Today, the records are maintained at the nearby Botanical Gardens.
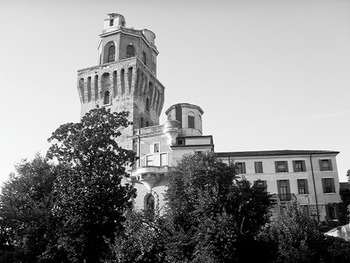
Figure 1.11 The Specola complex in Padua, Italy, where weather observations commenced in 1768.
The temperature record has been carefully reconstructed and homogenised, taking account of multiple instruments, calibrations, observers, observing sites and practices, making this the oldest record in southern Europe.
Stockholm, Sweden – 1756 to date
59.342°N, 18.055°E, 38 m above sea level
Weather observations began at the old astronomical observatory in Stockholm in 1754. Complete daily mean series of air temperature and barometric pressure have been reconstructed from the original observational data for the period 1756 to date [39, Reference Moberg and Bergström43]. In 2006 the observatory completed 250 years of records, the longest unbroken same-site observation series in the world.
The first observer was the secretary of the Royal Swedish Academy of Sciences, the astronomer and statistician Pehr Wilhelm Wargentin (1717–Reference Leeper, Rennie and Palecki83). He lived on the second floor in the then newly built observatory and placed his thermometer outside one of his windows. Wargentin is a well-known figure in Swedish scientific history as the father of Swedish population statistics, and also for his studies of Jupiter’s moons. When the observatory was renovated and extended in 1875, the thermometer was moved to a metal cage outside a window on the first floor. The current observation site, dating from 1960, lies only a few metres from the building (Figure 1.12).
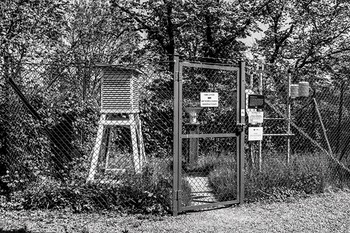
Figure 1.12 The current weather station at Stockholm Observatory.
Since 1901, the highest temperature observed has been 35.4 °C (on 6 August 1975), the lowest −28.2 °C (on 25 January 1942). Less rigorous early records show 36 °C on 3 July 1811 and −32 °C on 20 January 1814.
Kremsmünster, Austria – 1762 to date
48.05°N, 14.13°E, 389 m above sea level
Kremsmünster Abbey is a Benedictine monastery founded in 777. Much of the present vast complex, one of the largest in Austria, was rebuilt from the middle of the seventeenth century, including an astronomical observatory completed in 1750. A near-continuous series of daily meteorological observations exists at the site from 1762; this was one of the first sites to be awarded WMO Centennial Station status in 2017. The earliest records were made in an unheated tower open to the air, but today’s observations are made by an AWS in standard fashion within the abbey’s grounds. For an eight-year period, temperature records were restarted in the original exposure in order to provide comparisons between old and new records [Reference Böhm44]. This reference also includes details of many other long-period sites within the Alpine region of central Europe, including details of multi-site records in Basel and Geneva (Switzerland) from 1760, and from Turin (Italy) also from 1760.
Milan, Italy – 1763 to date
45.471°N, 9.189°E, 121 m above sea level
The Astronomical Observatory of Brera (OAB) in Milan was founded in 1762, and daily meteorological observations have been made here since 1763. It is the oldest scientific institution in Milan, and remains one of the top astronomical research institutes in the world.
Although observations have always been made at the observatory, many changes of instruments, station location and observation methods over the years render the original observations series far from consistent. Fortunately, detailed metadata (records of the instruments and their exposure) were kept. A meticulous research programme conducted at the University of Milan [Reference Maugeri, Buffoni and Chlistovsky45, Reference Maugeri46] re-examined all of the original records to produce a complete and homogeneous daily series of maximum, mean, and minimum temperatures, and daily mean barometric pressures, covering the period from 1763 to date. The site became a WMO Centennial Station in June 2021.
Prague, Czechia – 1775 to date
50.086°N, 14.416°E, 191 m above sea level
Regular meteorological observations commenced in the vast Baroque complex of the former Jesuit College in Prague’s Old Town, the Clementinum (or Klementinum), in 1752, although there are breaks in the record until 1775; the daily records are unbroken since January 1784 [47, 48]. Observations continue at the same site (now the Czech National Library) today, in much the same surroundings as they were more than 250 years ago, with observations made at the ‘Mannheim hours’ of 0700, 1400 and 2100 local time (see below).
Two thermometer screens are in use, similar to the original eighteenth-century models rather than today’s standards – a louvred screen located on the first floor of the north side of the south annex and another on the flat roof of the east annex. Rainfall amounts and sunshine duration are also measured here (Figure 1.13). Although measurements at his site were and still are influenced by a number of factors (such as the location of the measuring instruments within the complex, and its position in the centre of Prague), for modern science, they represent a unique and extremely valuable source of information on central European weather and climate conditions during modern history.
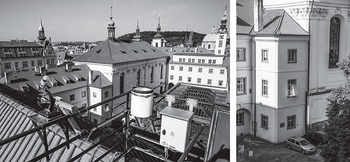
Figure 1.13 Meteorological instruments in the Prague Clementinum, where records have been kept since 1752.
Since 1775, the temperature extremes at the site have been 37.8 °C (on 27 July 1983) and −27.6 °C (on 1 March 1785).
Hohenpeissenberg, Germany – 1781 to date
47.801°N, 11.010°E, 977 m above sea level
Hohenpeissenberg is the oldest mountain observatory in the world, and possesses one of the longest reliable observational records of any location [49, 50]. It is located about 80 km south-west of Munich at an altitude of just under 1000 m (Figure 1.14) and has an interesting and varied history. It was one of the first sites accepted into the WMO Centennial Stations initiative in 2017.
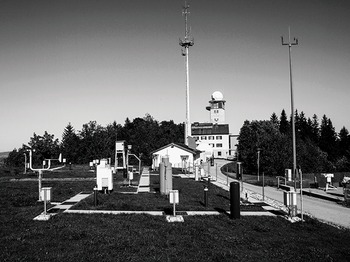
Figure 1.14 The current meteorological instrument site at Hohenpeissenberg Observatory in southern Germany: meteorological observations have been made here without significant interruption since January 1781.
Meteorological observations were first made here in 1758/59, but regular and uninterrupted records started on 1 January 1781 as one of the stations in the Societas Meteorologica Palatina observation network, established by the Meteorological Society of the Palatinate with the support and funding of Karl Theodor, Elector of the Palatinate. This was the world’s second international climate observation network (Florence’s Medici Network in 1654–70 was the first): it consisted of 39 stations extending from eastern America to the Ural Mountains, and from Greenland to the Mediterranean [Reference Pappert51]. The Societas Meteorologica Palatina established standardised instruments, observing procedures and observation times (the so-called Mannheim hours of 0700, 1400 and 2100) for the first time. (Observations made at the Mannheim hours are still used for today’s climatological records at Hohenpeissenberg.) Augustinian monks from the nearby Rottenbuch monastery made the observations; Hoher Peissenberg was a place of pilgrimage and a subsidiary convent.
The Palatinate came under occupation in 1792, during the Austrian-French war. This brought an end to the Societas Meteorologica Palatina, although fortunately the Augustinian Canons decided to continue the meteorological observations. Following secularisation in 1803, the Bavarian Academy of Sciences assumed responsibility for the station and appointed the parish priest of Hohenpeissenberg as the responsible observer. In 1838, the observatory came under the responsibility of the Royal Observatory of Munich, and in 1878 part of the Bavarian State Weather Service. In 1934, the Meteorological Service of the Third Reich assumed responsibility for the site, which was expanded into a main weather observation location in late 1937, commencing synoptic observations. In 1940, the station was relocated a short distance from the existing monastery buildings into newly built premises on the western side of the mountain. In the closing days of the Second World War, southern Bavaria came under attack from the Allied armies. Observations at Hohenpeissenberg were interrupted by artillery fire on 28 April 1945, and had to cease altogether on 2 May because of the danger to the observers, but were restarted on 14 May. On 1 April 1946, the station was incorporated into the network of the newly founded West German state weather service, the Deutscher Wetterdienst (DWD), and in March 1950 the site was formally upgraded to that of a meteorological observatory.
The range of instrumentation and observing routines has expanded considerably since. Records of atmospheric ozone commenced in 1967, a weather radar was installed in 1968, later upgraded to Doppler capabilities, and observations of trace atmospheric gases commenced. In 1994, the observatory became a part of WMO’s Global Atmosphere Watch (GAW) programme.
Armagh Observatory, Northern Ireland – 1794 to date
54.353°N, 6.650°W, 62 m above sea level
The astronomical observatory at Armagh, built in 1790, is the oldest scientific institution in Northern Ireland [Reference Bennett52]. Intermittent observations of the weather have been made on this site since 1784, prior to the building of the observatory: more systematic daily observations of temperature and barometric pressure commenced in December 1794. Although there are some gaps in the early years, and numerous changes of instrument and site around the observatory, the records are largely complete from 1833 to the present day. They represent the longest series of continuous weather records in Ireland. All of the records, including both current observations and scanned copies of the original manuscript records, are available on the observatory website www.armagh.space/weather and have been extensively documented [Reference Butler53, Reference Butler and García-Suárez54, Reference Butler and Hoskin55]. Armagh Observatory was declared a WMO Centennial Station in 2018, Figure 1.15 [39].
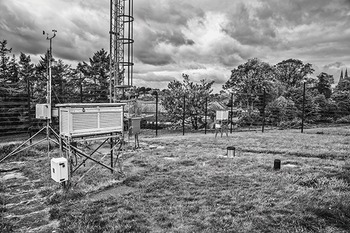
Figure 1.15 Armagh Observatory in Northern Ireland; meteorological observations began here in December 1794.
The site lies approximately 1 km north-east of the centre of the ancient city of Armagh, at the top of a drumlin (a small hill moulded by glacial action) in an estate of natural woodland and parkland of some 7 ha. The observatory is still largely surrounded by countryside similar to that which has existed since its foundation. The population of Armagh has increased relatively little in 200 years (2022: 14,590) and so the observatory suffers from little or no urban micro-climatic effects.
The third director of the observatory, Thomas Romney Robinson, appointed in 1832, made many experiments in other fields of science. One of his most enduring interests was the study of meteorology and in particular the measurement of wind speed. He invented the cup anemometer (see Chapter 9, Measuring wind speed and direction), a device that is still widely used throughout the world. An original Robinson anemometer can still be seen in operation on the roof of the Observatory.
The Radcliffe Meteorological Station, Oxford, England – 1813 to date
51.761°N, 1.264°W, 63 m above sea level
The University of Oxford is the oldest university in the English-speaking world, founded in 1249: the Radcliffe Observatory was established as part of the university in 1772. John Radcliffe (1652–1714) was a British physician who bequeathed property to various charitable causes, including St Bartholomew’s Hospital in London and University College, Oxford [Reference Guest56]. Several landmark buildings in Oxford, including the Radcliffe Camera, the Radcliffe Infirmary (now the John Radcliffe Hospital) and the Radcliffe Observatory, were named after him. The observatory site, situated in the walled garden of Green Templeton College in Woodstock Road adjacent to the old observatory building, possesses the longest same-site series of temperature and rainfall records in the British Isles (Figure 1.16). Irregular observations of air temperatures, barometric pressure and rainfall amounts exist from 1760, before the founding of the Observatory itself; a daily air temperature record is unbroken from November 1813, and daily rainfall from January 1828. The records have recently been extensively documented in book form [Reference Burt and Burt57]. Amongst other records, a unique near-200 year detailed record of thunderstorm occurrence continues today [Reference Burt58].
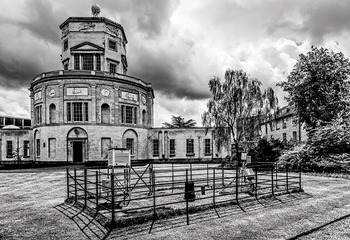
Figure 1.16 The Radcliffe Meteorological Station, Oxford, England. Meteorological observations have been made here since 1772; an unbroken daily temperature series exists from November 1813, and rainfall from January 1828.
Dr Thomas Hornsby, then Savilian Professor of Astronomy at the university, approached the Radcliffe Trustees with a request for funds for the erection and equipping of an astronomical observatory in 1768. Building began in 1772, although it was not completed until 1794. The central feature of the building is the octagonal tower, 33 metres high, an adaptation of the Tower of the Winds at Athens. It is widely acknowledged as one of the most beautiful buildings in Oxford.
Initially, observations of air temperature (from thermometers mounted on the north wall of the observatory) were made three times daily to determine atmospheric refraction effects on star positions. From 1849, meteorological observations were made in their own right; thermometers were exposed in a thermometer screen at ground level on the north lawn within the observatory’s walled garden.
Air temperatures, rainfall and sunshine records are measured today at the same place, and in very much the same way, as they have been since 1879. Since July 1935 the station has been known as ‘The Radcliffe Meteorological Station, Oxford’. In 1978 the site became part of what is today Green Templeton College, with the university’s School of Geography and the Environment responsible for the daily observations. A university decree guarantees the continuation of the observations ‘as long as they are deemed to be of scientific value’ [Reference Burt and Burt57, Reference Wallace59]. The Radcliffe site became a WMO Centennial site in 2020.
Since daily maximum and minimum temperatures were first recorded in 1815, the extremes at the Radcliffe Meteorological Station, Oxford, have been 38.1 °C on 19 July 2022 and −17.8 °C on 24 December 1860. The full daily series of temperature, precipitation and sunshine records are available on the Oxford University School of Geography website at www.geog.ox.ac.uk/research/climate/rms/.
Durham University Observatory, England – 1843 to date
54.768°N, 1.584°W, 102 m above sea level
Meteorological records began at the Durham University Observatory in 1841, although the earliest surviving logbook dates from July 1843. As at Oxford, the observations were originally made as part of the astronomical routine of the observatory; astronomical records ceased at the outset of World War II in 1939. The long series of records were fortunately rediscovered by Gordon Manley [Reference Manley60], the first professor of Geography at Durham in 1928, and developed into the longest series of temperature and pressure observations in north-east England. Manual observations were discontinued in October 1999, since when observations have been made by a Met Office AWS (Figure 1.17). The full history of the meteorological records at Durham have been published [Reference Burt and Burt61] and the entire twice-daily observation series is available on the Durham University website at https://durhamweather.webspace.durham.ac.uk. Durham University Observatory became a WMO Centennial site in 2023.
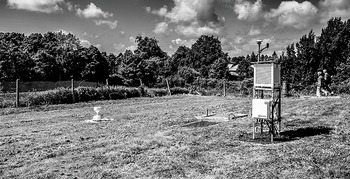
Figure 1.17 The Durham University Observatory AWS. Meteorological observations have been made at this site since 1843.
Since daily maximum and minimum temperatures were first recorded in 1843, the extremes at the Durham University Observatory have been 36.9 °C on 19 July 2022 and −18.0 °C on 8 February 1895.
The oldest weather records in North America
The earliest known instrumental weather records within today’s United States began in Cambridge, Massachusetts, in 1715 and in Boston, Massachusetts, a decade later [Reference Fiebrich9]. Morning and afternoon temperature observations survive from Philadelphia, Pennsylvania, from 1731 to 1732. Dr John Lining kept daily records of temperature, barometric pressure and rainfall in Charleston, South Carolina, between 1737 and 1753, to investigate relationships between weather and illness; these records were continued until 1759 by another doctor, Lionel Chambers. Early records include those of two presidents – George Washington (1732–99, first president 1789–97) kept a detailed weather diary at Mount Vernon, Virginia, in the late 1700s, while Thomas Jefferson (1743–1826, third president 1801–09) kept an almost continuous daily record of weather conditions from 1776–1816, mostly at Williamsburg and Monticello in Virginia. Washington’s entries were diary-style, whereas Jefferson usually noted temperatures more systematically at numerous times during the day [Reference Fiebrich9].
The earliest record on the National Centers for Environmental Information (NCEI) database is that for Nottingham in Prince George’s County, Maryland, with records from August 1753 to December 1757. Morrisville in Pennsylvania has records from January 1790 to December 1859.
It was not until after the Surgeon-General of the United States issued an order in 1814 for each Army post surgeon to ‘keep a diary of the weather … noting everything of importance relating to the medical topography of his station’ that any form of systematic observations began to be made in America. The Smithsonian Institution ran its own network of weather reporting sites between 1849 and 1874. Many additional weather observing sites were established at or shortly after the foundation of the US Weather Bureau in 1870, but it was not until the adoption of a uniform plan of observations in 1895 and the printing of monthly climate reports from 1896 that standardisation across the different networks was finally secured.
Probably the longest continuous current records for any US city are those for Chapel Hill in North Carolina and for Minneapolis, Minnesota, both of which extend back to 1820. In Minneapolis, records commenced at Fort Snelling in 1820 [62] and continue today at Minneapolis-St Paul International Airport (since 1938). There are many hundreds of records extending back to 1872 or earlier (although many have moved from one site to another within the town or city within the period of record), including those for San Francisco (1850 for precipitation and 1870 for temperature) and Des Moines, Iowa (1865). The longest single-site records in the United States are those from Central Park, New York (1869), and from Blue Hill Observatory in Massachusetts (1885), which are covered in more detail below.
Many less-continuous and multi-site early records are known for Canada, sufficient to prepare a near-unbroken daily temperature series for the St Lawrence valley in Quebec as far back as 1798 [Reference Slonosky63, Reference Slonosky64]. The oldest continuous record still in existence from the Environment Canada historical data website https://climate.weather.gc.ca/historical_data/search_historic_data_e.html is for Cornwall, Ontario, where the record is almost unbroken from 1887; the longest Canadian record on the WMO Centennial Stations listing is from Ottawa, dating from 1889 [39].
Central Park, New York – 1869 to date
40.779°N, 73.969°W, 40 m above sea level
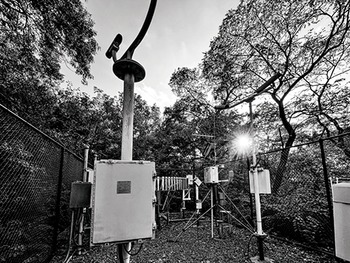
The longest records made in the United States on (almost) the same site are those for Central Park in New York, where Dr Daniel Draper began keeping records in December 1868. Originally observations were made at the Arsenal Building on 5th Avenue (between 63rd and 64th Streets), but since January 1920 they have been made at Belvedere Castle, Transverse Road (near 79th and 81st Streets) [65]. The distance between the two sites is just less than 1500 metres (0.9 miles), although the record is generally regarded as being fairly homogeneous. The equipment has been automated since the late 1980s (Figure 1.18).

Blue Hill Meteorological Observatory, Massachusetts – 1885 to date
42.212°N, 71.114°W, 193 m above sea level
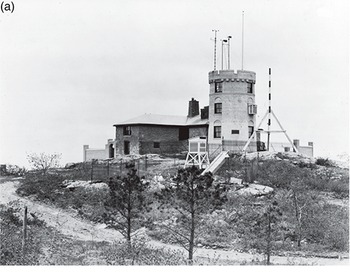
The Blue Hill Meteorological Observatory is located at the top of a scenic range of hills 15 km (10 miles) south-south-west of Boston, Massachusetts (Figure 1.19), and describes itself as the ‘home of the longest climate record in the nation’ [66]. The observatory was founded in 1885 by Abbott Lawrence Rotch as a private scientific centre for the study and measurement of the atmosphere and was the site of many pioneering weather experiments and discoveries: the earliest kite soundings of the atmosphere in North America (1890s) and early development of the radiosonde (1930s) both took place here. The first weather observations were made here on 1 February 1885. They have remained unbroken, and on the same plot, ever since, the most homogeneous climate record in North America.
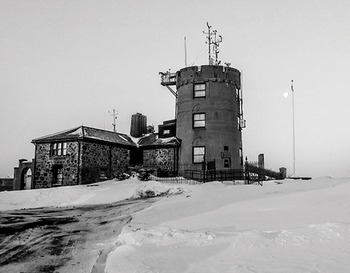
Figure 1.19 The Blue Hill Meteorological Observatory, Massachusetts. Observations commenced here on 1 February 1885 and continue to this day.
Construction of the observatory was started by Rotch in 1884 using his own private funds. The original structure consisted of a two-storey circular tower and an adjoining housing unit; extensions were added in 1889 and 1902. Native stone, gathered from the summit of the Great Blue Hill, was used for the buildings, while copper sheathing was used for roofing. The original stone tower was demolished in 1908 and a new reinforced three-storey late Gothic Revival concrete tower, 6 m wide and 10 m high and with a crenelated top, was constructed in its place. The site was declared a National Historic Landmark in 1989.
The observatory retains barometers and other instrumentation dating from the late nineteenth century – these instruments remain in use alongside modern instrumentation, preserving the accuracy and integrity of the long record period. Blue Hill is also unique in North America in possessing a long sunshine record made with the Campbell–Stokes sunshine recorder (see Chapter 11). The National Oceanic and Atmospheric Administration (NOAA) also operates automated remote-reading climate monitoring equipment at the site. The observatory was declared a WMO Centennial Observing Station in its first global listing in May 2017 [39].
Since records commenced in February 1885, the highest recorded temperature has been 38.3 °C (101 °F) on 10 August 1949, equalled on 2 August 1975, and the lowest −29.4 °C (−21 °F) on 9 February 1934. During the Great New England Hurricane of 1938, the observatory recorded one of the highest wind gusts yet recorded by surface instruments anywhere in the world – 186 mph (83 m/s, 162 knots).
South America
The oldest observation series known for South America is that for Quinta Normal in Chile, where records commenced in 1857, followed by two sites in Argentina, Santigo Del Estero Aero (1873) and San Luis Aero (1874) [39]. Further details of all other sites in South America with records commencing earlier than 1920 are available on the WMO Centennial Stations website [39].
Africa
The oldest continuous meteorological record in Africa is from Cape Agulhas in South Africa, where records commenced in 1855. Records began at two stations in Mauritius (Pamplemousses and Labourdonnais) in 1862, with another two sites (Beau Vallon Cour and Constance) dating from 1865. Observations on Tenerife, at the Santa Cruz de Tenerife site, also began in 1865. As with the sites in South America, further details of all other sites in Africa with records commencing earlier than 1920 are available on the WMO Centennial Stations website [39].
Asia
China has a wealth of documentary climate data, although instrumental records are scattered and short in length until the latter part of the nineteenth century [Reference Wang and De’er67, Reference Brönnimann68]. The earliest known measurements were made by Cunningham at Xiamen (Amoy) from October 1698 to January 1699, and a continuous record at Zhousan, Zhejiang Province between 1700 and 1702. A composite record from Beijing exists from 1724, including fragmentary records made there in 1743, followed by a longer series of air temperature, pressure, and rainfall made there by missionary Joseph Amiot between 1757 and 1762 [Reference Ren69]. The Russian observatory network also made measurements at their Consulate in Beijing from 1841. In India, records from Nungambakkam date from 1792; several other sites in India possess records dating back 150 years or more, including Mumbai (1841) and Thiruvananthapuram (1853). Two sites in Kazakhstan, Kazakhstan and Fort-Shevchenko, possess continuous records back to 1848. As with the sites in South America and Africa, further details of all other sites in Asia with records commencing earlier than 1920 are available on the WMO Centennial Stations website [39].
Hong Kong Observatory, China – 1884 to date
22.302°N, 114.174°E, 32 m above sea level
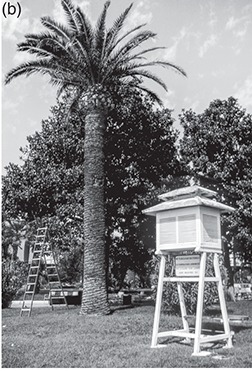
One of Asia’s oldest and most complete meteorological records is that from the Hong Kong Observatory in Kowloon, where observations began in 1884 and continue on the same site today (Figure 1.20). The Hong Kong Observatory was amongst the first sites to be awarded WMO Centennial Station status in May 2017, proudly recorded on a plaque on the Observatory’s front entrance. Today, in addition to maintaining the site’s long meteorological record, the original historic colonial-era buildings house a modern forecasting centre for the South China Sea providing, amongst many other services, commercial aviation forecasts and a public forecasting service for the 7.6 million residents of Hong Kong and the Pearl River Delta (including typhoon warnings and research programmes).
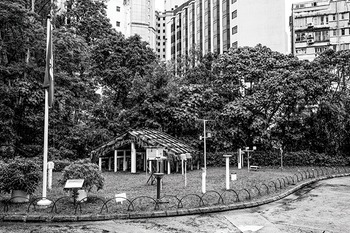
Figure 1.20 Hong Kong Observatory. The thatched screen has been in use since 1884; conventional Stevenson screen temperature measurements are made at the King’s Park site, not far from the main Observatory.
Australia and New Zealand
Australia’s first weather records were made at Dawes Point in Sydney Harbour, where observations of temperature, pressure, wind and cloud cover were made from September 1788 to December 1791, the first three years of British settlement in Australia. Other records survive for various sites in Sydney from the 1820s, prior to the start of observations in July 1858 at the historic Observatory Hill site (Figure 1.21) overlooking Sydney Harbour, where they continue today [Reference Ashcroft70].
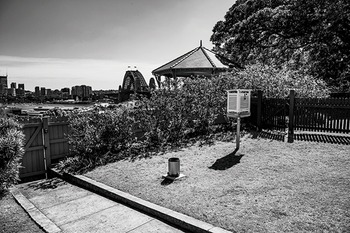
Figure 1.21 Meteorological instruments at the historic Sydney Observatory site.
The oldest Australian records on the WMO Centennial Stations listing [39] are those for Mt Boninyong in western Victoria (745 m altitude), where records began in 1856, and Wooltana Station (600 km north of Adelaide in South Australia) and Yamba, a coastal town in northern New South Wales: both sites’ records began in 1877. A single, homogenous daily temperature series for Adelaide (South Australia) has been published covering the period from 1859 to the present [Reference Ashcroft71], while a composite series exists for Perth in Western Australia from 1830 [Reference Gergis72].
New Zealand’s oldest weather records are from Hokitika, South Island, where records began in 1865. A site at Lincoln Broadfield, a few kilometres south-west of Christchurch in South Island, possesses records from 1881.
Times of change …
The way we measure weather has changed rapidly over the last two or three decades. As with any change, both opportunities and threats present themselves. Most meteorological observers brought up on mercury-in-glass thermometers and clock-driven autographic instruments with inky paper charts on clockwork drums have already retired. New sensors and measurement methods have evolved and are still evolving, some completely novel, and all offering improved ease of use, accuracy and cost-efficiency – although not always longevity. It should be remembered that many ‘traditional’ instruments, such as mercury thermometers or barometers, were brought to a high level of precision, reliability and ease of use over the course of almost 400 years, while the first modern prototype AWSs appeared only a few decades ago. As a result, ‘sensor and instrument churn’ is likely to be faster in the coming decades than it was over the last half-century. The retirement of mercury-based instruments mandated by the Minamata Convention [5] is already complete in many regions of the world: it is to be hoped that careful overlap periods using both ‘old and new’ methods of measurement were undertaken during the changeover to minimise risks to the homogeneity of the few genuinely long-period weather records we possess. Reliable and consistent long-period records are essential to provide an accurate assessment of past and present climate change, and to check the reliability of both past and future climate models. A carefully maintained weather record of 25 years is useful; one of 250 years many times more so. Only consistent long records can help answer questions such as ‘How is our climate changing?’ and ‘Are extremes of climate becoming more frequent?’
Why are instrumental and observing standards necessary?
Standards are needed in order to be able to compare observations between sites. Only by minimising or eliminating measurement differences owing to varying exposures, instrumentation or observing methods can your own observations be directly comparable with those from the next village, or the next continent, or the last century.
So-called traditional methods of measuring weather elements evolved in Europe and North America during the latter nineteenth century and throughout the twentieth. Careful intercomparisons between instruments, exposures and observation methods determined which provided the best combinations of ease of use, cost, accuracy and suitability for the climatic regime. Such intercomparisons have continued with the new generation of digital meteorological sensors whose output comes via a datalogger, such that we can now be sure that solid-state pressure sensors, for example, can provide data to the same or better levels of accuracy than mercury barometers more safely, more cheaply, more easily and without requiring a human observer (see Chapter 7, Measuring atmospheric pressure). Not all comparative overlap records have been so clear-cut, however: the replacement of other sensors has been more problematic, particularly sunshine (Chapter 11, Measuring sunshine and solar radiation), where new electronic sensors sometimes give very different results from traditional instruments. Ill-thought-out replacement schemes have irreparably damaged the climatological continuity of many long sunshine records.
As a result of the need to maintain some form of practical standardisation for purposes of comparison with other observations, each of Chapters 5–11 in this book, describing how to measure a particular element of the weather, starts with a short description of the currently accepted standard method or methods of making observations of that element, based upon World Meteorological Organization standards and guidelines as set out in the WMO CIMO guide [4]. The instruments, siting and observing practices involved in doing so are described, followed by methods of siting AWS sensors and adopting measurement and observing methods to obtain as nearly as possible ‘standard’ results. For most elements, ‘perfect’ (and unchanging) sites are hard to come by, and compromises in exposure or instrumentation may be required. Some compromises are permissible where effects on the readings obtained will be relatively small, and where these are known allowances can sometimes be made. Other compromises may render the records made largely meaningless, and they should therefore be avoided. Each chapter attempts to outline the permissible and the impossible in this regard.
This approach will benefit both first-time purchasers of such systems, who may have little or no prior knowledge of where, why or how to site their instruments to provide observations that can become genuinely useful beyond purely local recordkeeping, as well as those looking to expand existing weather measurements. Those looking to establish a new professional weather monitoring site from scratch will also find useful guidance on current best practices.
The future
It is very likely that many, if not most, of today’s standard methods of measuring weather will continue to evolve over the coming decades as improved technology and lower-cost measurement methods continue to be introduced. Some countries have established ‘fresh start’ weather measuring sites, equipped from the outset with modern electronic instruments, on good sites that offer both excellent exposures and a reasonable expectation of record continuity for decades or even centuries to come [Reference Diamond73, Reference Hubbard, Lin and Baker74, Reference Hubbard75]. Careful consideration today in choice and exposure of sensors, loggers and data archiving – all subjects covered in more detail in this book – will go a long way towards both ‘future-proofing’ and maximising the practical benefits of a well-sited AWS.
The first step is to list your specific requirements for weather measurements, then decide the best balance of budget and equipment to meet those requirements. How best to do this is set out in the following chapters.