Introduction
Endovascular thrombectomy (EVT) is strikingly efficacious for ischemic stroke caused by proximal intracranial large-vessel occlusion involving the anterior cerebral circulationReference Goyal, Demchuk and Menon1 and is recommended for eligible patients within 6 hours of stroke onset, or up to 24 hours in some cases.Reference Boulanger, Lindsay and Gubitz2 While several previous studies have reported the cost-effectiveness of EVT compared to standard care practices,Reference Xie, Lambrinos and Chan3–Reference Sevick, Ghali and Hill6 none fully reflect the population of ischemic stroke patients in Nova Scotia or the Atlantic provinces in Canada. The present study assesses the cost-effectiveness of the use of EVT ± tissue plasminogen activator (tPA) in treating ischemic stroke, caused by proximal intracranial large-vessel occlusion involving the anterior cerebral circulation, among patients in a real-world clinical setting. The research question was, from the perspective of a third-party payer, is EVT ± tPA cost-effective compared to standard care ± tPA at our centre? If found to be cost-effective, the results from our study will contribute to making a case for the scaling up of EVT treatment at the acute stroke unit of the Queen Elizabeth II Health Sciences Centre (QEII HSC) in Nova Scotia and elsewhere.
The economic evaluation was a cost-utility analysis. The analysis was in two stages. First, propensity score matching (PSM)Reference Abadie and Imbens7 and the augmented inverse probability weighted (AIPW) estimatorsReference Cattaneo, Drukker and Holland8 were used to estimate the differences in average quality-adjusted life years (QALYs) and costs – the incremental costs and QALYs – required for the cost-utility analysis. The second stage involved assessing cost-effectiveness using results from step 1, and conducting sensitivity analyses by varying the discount rates for costs and QALYs, varying the willingness-to-pay (WTP) thresholds, quantifying the sampling uncertainty using bootstrapping, and summarizing the results on cost-effectiveness planes and cost-effectiveness acceptability curves. We also highlight the financial implications of scaling-up EVT treatment at the center.
Methods
As an overview, economic evaluation involves comparing two or more alternative courses of action in terms of both costs and health outcomes to aid policy decisions.Reference Drummond, Sculpher, Claxton, Stoddart and Torrance9 An intervention that is effective and less costly, compared to an expensive and ineffective comparator, is preferred. If the intervention is effective but relatively costly, there is a trade-off between the increased health benefits and the additional costs associated with the intervention, and a WTP threshold, λ, serves as a benchmark for assessing cost-effectiveness.Reference Drummond, Sculpher, Claxton, Stoddart and Torrance9 We followed Achit et al. and Leal et al. in basing the economic evaluation on patient-level data without the use of decision analytic models.Reference Achit, Soudant and Hosseini10,Reference Leal, Ahrabian and Davies11 The study received approvals from the Nova Scotia Health Authority (NSHA) Research Ethics Board, after submitting a detailed study protocol with clearly defined research questions, reducing the possibility of data dredging.Reference Berger, Sox and Willke12,Reference Cox, Martin, Van Staa, Garbe, Siebert and Johnson13
Target Population, Setting, and Comparators
The target population was adults in Nova Scotia who had an ischemic stroke. The age of patients in the sample ranged from 39 to 91 years. The study was based on observational data. The data came from the prospective QEII HSC Acute Stroke Registry (ASR).Reference Phillips, Eskes, Gubitz and Queen Elizabeth14 The methods used for the clinical aspects of this study are described in detail elsewhere.Reference Hu, Virani and Christian15 Briefly, data extraction involved identifying, from the ASR, out-of-hospital stroke patients treated with EVT ± tPA after our participation in the Endovascular treatment for Small Core and Anterior circulation Proximal occlusion with Emphasis on minimizing computed tomography (CT) to recanalization times (ESCAPE) trial16 during the time interval February 1, 2013–January 31, 2017: these patients constitute the treatment group (EVT ± tPA). The controls were patients admitted before February 2013 who had standard care ± tPA but no EVT. These patients were followed up at 90 days poststroke. The sample size was 88 (treatment = 44, control = 44). See Table 1.
Table 1: Baseline characteristics

tPA = tissue plasminogen activator; EVT = endovascular thrombectomy.
Study Perspective, Time Horizon, and Discount Rate
The study was from the perspective of the Department of Health and Wellness in Nova Scotia. The time horizon was the remaining life expectancy of patients, given their age, gender, and survival after stroke. We followed the Canadian Agency for Drugs and Technologies in Health (CADTH) guidelines (4th edition)17 for the choice of discount rates for costs and health outcomes, using a 1.5% per annum discount rate for the reference case and 3% in a sensitivity analysis (non-reference case).
Choice of Health Outcome
The primary outcome was QALYs – derived in part, by combining health utility indexes that vary by modified Rankin Scale (mRS) score with the probability of survival after stroke and the remaining life expectancy of patients in the sample. We assumed that patients with better functional outcomes would have better QALYs than those who did not. Following Xie et al.,Reference Xie, Lambrinos and Chan3 we assumed that the long-term health outcomes of patients would depend on the degree of their handicap, as quantified by the mRS score at 90 days.Reference Xie, Lambrinos and Chan3 However, unlike Xie et al.,Reference Xie, Lambrinos and Chan3 we allowed for the probability of survival at 90 days poststroke to differ between the treatment groups, based on observations in the data. Health utility indexes that vary by mRS scores were obtained from Kim et al.Reference Bamford, Sandercock, Dennis, Burn and Warlow18 and matched with patients in the sample based on their mRS score at the 90-day follow-up – patients with an mRS score of 0–2 get a health utility index of 0.85, those with mRS scores 3–5 get a health utility index of 0.27, and those with mRS score of 6 at follow-up (or at discharge from the stroke unit) get a health utility index of 0.
QALYs at 90 days were estimated as:Reference Xie, Lambrinos and Chan3
where Qi represents the health utility index that differs by mRS score; p represents the probability that the patient was alive at 90 days poststroke, estimated from a logistic regression model using a binary variable that equals 1 if the mRS score at discharge from the stroke unit or during follow-up differs from 6 as the outcome variable. After 90 days, we assumed that there would be no change in utility indexes. Consequently, QALYs for the residual life expectancy after 90 days were calculated using the formula:Reference Sassi19
where e represents Napier’s constant; L represents the residual life expectancy; and r, the discount rate. Age–sex–province-specific life expectancy data for residents in Nova Scotia were obtained from Statistics Canada’s life tables. The overall QALY consists of the sum of QALYs from Equations (1) and (2). The sensitivity analysis involves using health utilities derived from Hong and Saver, who in their World Health Organization’s (WHO’s) Global Burden of Disease Project, reported disability weights for each level of the mRS.Reference Berger, Sox and Willke12 The disability weights were converted to health utility weights using the formula:Reference Sassi19
where Qi denotes the health utility index, and Di is the disability weight by mRS score. The QALYs were, again, generated using Equations (1) and (2).
We chose Kim et al.Reference Bamford, Sandercock, Dennis, Burn and Warlow18 and Hong and SaverReference Berger, Sox and Willke12 because they reported health utility indexes that vary by mRS scores instead of utility indexes that differ between the treatment groups. This way, differences in QALYs between the treatment groups will be driven by posttreatment differences in functional independence or lack of it.
Health Resources and Costs
Costs include transportation costs to our center, costs of tPA and EVT, inpatient hospital day cost at the stroke unit, and rehabilitation and long-term care costs. All costs were measured in 2017 dollars, and where appropriate, costs in different year values were inflated into 2017 dollars using consumer price indexes for Nova Scotia. All costs incurred beyond 1 year were discounted at 1.5% per annum in the reference case and 3% in the sensitivity analysis.17
Patients lose 1.9 million brain cells per minute after stroke, necessitating the need for rapid travel time for recanalization.20 Consequently, the analysis was based on the assumption that patients who live more than 50 km away from the QEII were transported there by air. The fees for transportation came from the Emergency Health Services (EHS) and the Department of Health and Wellness. For distances ≤50 km, we assumed ground ambulance transportation. The EHS ground ambulance service fee for medically essential transportation was $1132 (as of April 1, 2015). Based on expert opinion, this figure represents the actual cost to the province (without subsidy) for the provision of the service. For patients more than 50 km away, we assumed air transportation by helicopter at a fee of $10,300 per case.
The cost of tPA per person includes the one vial 100 mg of tPA and the service fee for a neurology consultation. The cost of EVT per person consists of the cost of supplies, the wages for a registered nurse, and a technician for the procedure; additional supplies, the costs of CT head with perfusion and CT Angio head and neck. Additional costs include neuroradiology fees for EVT, anesthesiologists’ fees for EVT work (sourced from Pain Management and Perioperative Medicine, Dalhousie University, see Table 2). The details of tPA and EVT-related costs were obtained from the QEII Department of Diagnostic Imaging. The average inpatient treatment costs were computed based on data from the NSHA – Acute Stroke Discharges, Central Zone for the years 2015 and 2016. The average acute care inpatient cost per day was $1488.
Table 2: Per-person treatment costs
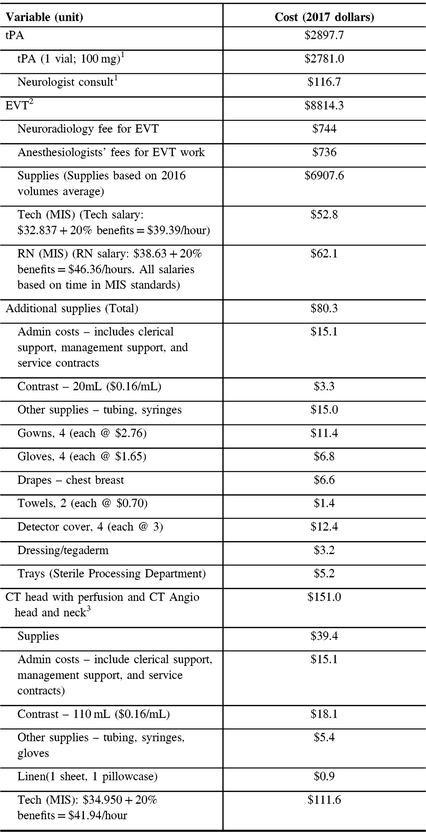
tPA = tissue plasminogen activator; EVT = endovascular thrombectomy; RN = registered nurse, CT = computed tomography; MIS = management information system.
1Source: National Physician Database, Canadian Institute for Health Information.
2,3Source: Interventional radiology, QEII HSC.
Data on the rehabilitation costs per day came from the Nova Scotia Rehabilitation and Arthritis Centre. The average rehabilitation cost per day was $766. For patients transferred from our care to another acute care unit, we assumed an annual cost of $41,200, multiplied by the remaining life expectancy to obtain the lifetime costs (5 years). For patients discharged to “other care,” we assumed a 1-year one-time cost of $11,047, which was the average cost of treating unspecified stroke, case mix group 028, for 60–79-year-old adults in Nova Scotia, as reported by Canadian Institute for Health Information.16 For patients discharged home with support, we assumed an annual cost of $36,050:21 this figure was consistent with the care plan to assist full-time family caregivers, estimated at $3004 per month, from the Nova Scotia’s Department of Wellness’ Homecare Fee Structure for 2015–2016.
Confounding and Control Variables
The confounding variables included in the statistical analysis were systolic blood pressure on arrival, age,Reference Achit, Soudant and Hosseini10 sex,Reference Achit, Soudant and Hosseini10 and the presence of comorbidities like hypertension,Reference Achit, Soudant and Hosseini10 atrial fibrillation,20 dyslipidemia, and diabetes mellitus.Reference Achit, Soudant and Hosseini10 The control variables include preadmission Oxford Handicap ScoreReference Bamford, Sandercock, Dennis, Burn and Warlow18, stroke syndrome at the time of first medical assessment, and the Oxfordshire Community Stroke Project classification of ischemic stroke subtype.Reference Bamford, Sandercock, Dennis, Burn and Warlow22 Table 1 reports the baseline characteristics of patients in the sample.
Statistical Analyses
We used treatment effect estimators for observational data in estimating the differences in average costs and QALYS – the treatment effect or incremental costs and QALYs – required for the cost-utility analysis. The estimation of differences in average costs and QALYs followed the intention-to-treat principle. The AIPW and the PSM estimators were used to estimate the differences in average QALYs (QALYs gained) and costs.Reference Cattaneo, Drukker and Holland8,Reference Busso, DiNardo and McCrary23,Reference Austin24 The AIPW estimator, also known as the efficient influence function estimator, models both the outcome and the treatment probability.Reference Cattaneo, Drukker and Holland8 However, only one of these two models must be correctly specified to consistently estimate the treatment effects, making the estimator doubly robust.Reference Cattaneo, Drukker and Holland8,Reference Tan25 PSM involves matching observations based on a single variable, their propensity score.Reference Abadie and Imbens7 According to Rosenbaum and Rubin, the propensity score is the conditional probability of assignment to a treatment group given observable control variables.Reference Rosenbaum and Rubin26 Rosenbaum and Rubin show that adjusting only for the propensity score was sufficient to eliminate confounding.Reference Rosenbaum and Rubin26 The implementation of the PSM estimator involved estimating the propensity scores using a logit model and then matching based on the scores, using a 1:1 matching without replacement, after specification tests.
In both estimators, an overidentification test for covariate balance, a Chi-square test, was used to check whether the covariates between the treatment groups were balanced after matching. A p-value < 0.05 indicates a lack of balance. Also, we used overlap plots of the estimated densities of treatment probabilities to check whether the overlap assumption was violated: the overlap assumption will be violated if an estimated density has too much mass around 0 or 1.Reference Busso, DiNardo and McCrary23
In a further sensitivity analysis, the differences in average costs and QALYs were reestimated using costs and QALYs discounted at 3% using the same estimators as before. Further, incremental QALYs were estimated using QALYs generated using health utility indexes derived from Hong and SaverReference Hong and Saver27 discounted at 1.5% and 3% and analyzed using the same estimators. For simplicity, we refer to the analysis based on QALYs based on health utility indexes from Kim et al.Reference Bamford, Sandercock, Dennis, Burn and Warlow18 as the “reference case” (including discount rates of 1.5% and 3%) and QALYs based on health utility indexes from Hong and Saver,Reference Berger, Sox and Willke12 the “non-reference case” (also including discount rates of 1.5% and 3%). The statistical analyses were performed using Stata software, version 15 (StataCorp).
Assessing Cost-effectiveness
Cost-effectiveness was assessed using the net monetary benefit (NMB) and the incremental cost-utility ratio (ICUR) for robustness checks. Equation 4 defines the NMB:
where λ represents the threshold value for the WTP; ΔE is the difference in average QALYs; ΔC is the difference in average costs. See the statistical analysis section for the estimation of ΔE and ΔC Canada does not have an explicit λ; consequently, initially, we assumed that λ = $50,000, and in a sensitivity analysis, we allowed the value of λ to vary from $0 to $80,000 and the results were evaluated. If the estimated 95% confidence interval (CI) for the NMB excludes zero, we can infer that EVT ± tPA is cost-effective. Equation (5) defines the ICUR:
The inference from the NMB should be identical to the inference from the ICUR. The inference and conclusions from the ICUR depend on its location in the cost-effectiveness plane.Reference Gray, Clarke, Wolstenholme and Wordsworth28 According to Gray et al., if the ICUR falls in the northeast quadrant of the cost-effectiveness plane, the new treatment is costly but more effective, and the ICUR represents the additional amount that must be paid to gain one unit of QALY. Interventions with ICURs below λ are cost-effective.Reference Gray, Clarke, Wolstenholme and Wordsworth28
Sampling uncertainty was explored using the 95% CI for NMB and ICUR, estimated using Fieller’s method based on the original sample.Reference Fieller29 We also used bootstrapping with replacement to generate 1000 pairs (replications) of ΔC and ΔE. In bootstrapping with replacement, the original sample serves as a proxy for the population of interest, which is then resampled with replacement to estimate the distribution empirically around the statistic of interest. The bootstrapped replications are akin to probabilistic sensitivity analysis in the case of analytic decision models. We used the bootstrapped replications also to generate 95% CI for NMB and ICUR using the percentile method. We plotted the bootstrap replications on a cost-effectiveness plane, and the 95% CI for NMB was summarized on an NMB graph showing point estimates of NMB, including the lower and upper limits of the CI for different values of λ. We also summarized the results using the cost-effectiveness acceptability curve, which summarizes the proportion of the distribution of the incremental costs and QALYs (ΔC and ΔE) that falls within the acceptable region of the cost-effectiveness plane with changes in λ. Methodological uncertainty was explored by repeating the analysis, including the bootstrapping, using a discount rate of 3% for QALYs and costs for both the reference and non-reference cases.
Results
Baseline Characteristics and Descriptive Statistics
In the EVT ± tPA group, 41 out of the 44 patients had EVT done (93%), and 33 out of the 44 patients had tPA (75%). Cumulatively, 31 out of the 44 patients (70%) in the EVT ± tPA group had both EVT and tPA. In the standard care ± tPA group, 25 out of the 44 patients (57%) had tPA. Further, 37 out of 44 patients (84%) in the EVT ± tPA group were alive at the last hospital follow-up, while 24 out of 44 (55%) were alive in the standard care ± tPA group. Also, the average health utility indexes were 0.47 (95% CI: 0.35–0.58) in the EVT ± tPA group and 0.30 (95% CI: 0.19–0.41) in the standard care ± tPA group. Table 1 shows the summary statistics of the socioeconomic and clinical characteristics of patients in both treatment groups.
Differences in Average Costs and QALYs
The overidentification test for covariate balance between the two treatment groups in the matched sample had a
![]() $\chi _{\left( {11} \right)}^2 = 3.5$
, (p-value = 0.98); we fail to reject the null hypothesis of covariate balance, after matching. Also, Figure 1 shows the overlapping plot of the estimated densities of treatment probabilities to check whether the overlap assumption was violated. From the figure, none of the plots had too much probability mass near 0 or 1, and the two densities overlap; hence, there is no evidence that the overlap assumption was violated.
$\chi _{\left( {11} \right)}^2 = 3.5$
, (p-value = 0.98); we fail to reject the null hypothesis of covariate balance, after matching. Also, Figure 1 shows the overlapping plot of the estimated densities of treatment probabilities to check whether the overlap assumption was violated. From the figure, none of the plots had too much probability mass near 0 or 1, and the two densities overlap; hence, there is no evidence that the overlap assumption was violated.
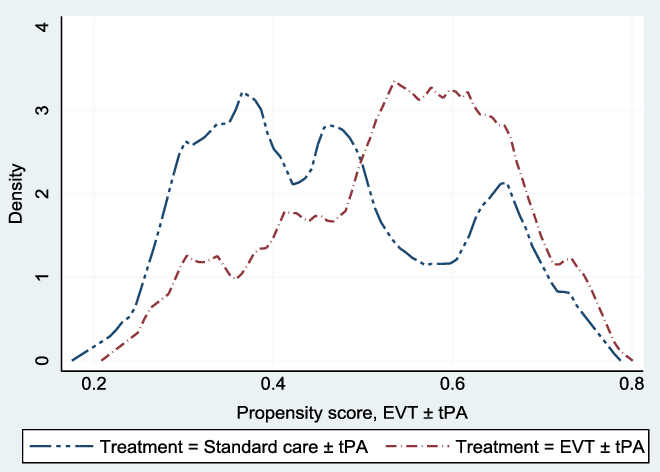
Figure 1: Overlap plots of the estimated density of the predicted treatment probabilities. The overlap plots were used to check whether the overlap assumption was violated in the matched sample: the overlap assumption will be violated if an estimated density has too much mass around 0 or 1.Reference Busso, DiNardo and McCrary23 The assumption was not violated.
The probability of being alive used in adjusting life years was 0.86 (95% CI: 0.78–0.94) in the EVT ± tPA group and 0.51 (95% CI: 0.40–0.63) in the standard care ± tPA group. Table 3 reports the unadjusted costs and QALYs, and the unadjusted difference in means. The table shows results for QALYs at 90 days, and lifetime QALYs discounted at 1.5% and 3%. In all cases, patients treated with EVT ± tPA had better outcomes in the form of QALYs than those treated with standard care ± tPA (p-value < 0.05). In the case of costs, the average costs for patients treated with EVT ± tPA appear relatively larger compared with costs associated with the standard care ± tPA; however, the difference in costs was not statistically different from zero (p-value > 0.05).
Table 3: Unadjusted costs and quality-adjusted life years (QALYs)
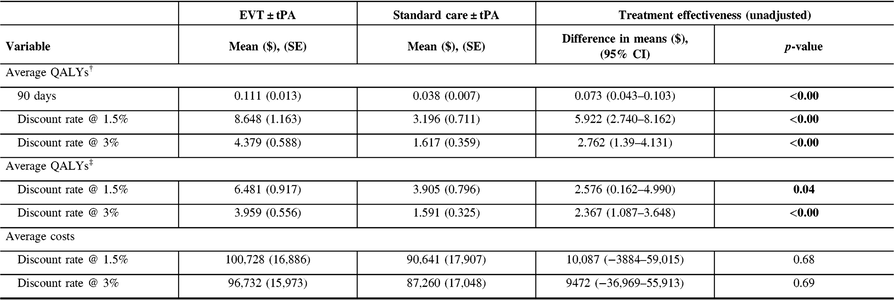
CI = confidence interval; SE = standard error.
† QALYs generated using health utilities from the WHO’s Global Disease Burden project.
‡ QALYs derived from health utilities reported in Kim et al.
Table 4 shows the average differences in QALYs – QALYs gained – for four cases based on the PSM and the AIPW estimators. Cases 1 and 2 constitute the reference case, and 3 and 4, the non-reference case. In case 1, QALY was discounted at 1.5% and discounted at 3% in case 2. From the table, the positive QALYs gained are indicative that patients treated with EVT ± tPA had better outcomes than those in the control group (95% CI excludes zero). The results for cases 3 and 4 were identical to cases 1 and 2. The results for all four cases were identical across the two estimators. Cases 5 and 6 on table show the results for the differences in average costs between the treatment groups. The difference in average costs was positive, with the implication that EVT ± tPA appears costly; however, the difference was not statistically different from zero (the 95% CI did not exclude zero) across the two estimators and discount rates.
Table 4: Confounder-adjusted differences in average QALYs and costs

CI = confidence interval.
The confounding variables included in all three models were hypertension, systolic blood pressure at admission, atrial fibrillation, age, dyslipidemia, diabetes mellitus, hypertension, preadmission Oxford Handicap Score, and sex.†QALYs derived from health utilities reported in Kim et al. (2011) – the reference case.
‡ QALYs generated using health utilities from the WHO’s Global Disease Burden project.
The results from both unadjusted and matched samples were identical: EVT ± tPA was effective and appeared relatively costly, but the difference in average costs was not statistically different from zero – the 95% CI spanned zero.
Cost-effectiveness Results
The difference in average costs and QALYs results reported showed that the conclusions were not sensitive to the estimator used in the analysis. Consequently, the inputs for the cost-utility analysis were based on results from the AIPW estimator, mainly because of its double-robust property. See Table 5. The average cost for treating patients with EVT ± tPA was $109,387 (95% CI: 69,822–148,952); the corresponding cost for standard care ± tPA was $87,187 (95% CI: 52,946–121,429). The difference in average costs between the treatment groups was $22,200 (95% CI: −29,527–73,926). Similarly, the average QALYs for EVT ± tPA was 6.73 (95% CI: 5.04–8.41) and 3.84 (95% CI: 2.58–5.10) for the standard care ± tPA. The intervention was found to have a net gain of 2.89 (95% CI: 1.05–4.72) QALYs. The NMB was $122,300 (95% CI: $1656–$242,944), based on λ = $50,000 per QALY. Similarly, the ICUR was $7682 per QALY gained (95% CI: −$9552–$48,611). The probability that EVT ± tPA is cost-effective at the $50,000 threshold was 0.98 (or 98%). Table 5 also shows the results based on the bootstrapped sample. The results from the bootstrapped sample were identical to the results based on the original sample, with a 0.85 probability that EVT ± tPA is cost-effective.
Table 5: Cost-utility analysis results, reference case (discount rate at 1.5%)

QALYs = quality-adjusted life years; Net monetary benefit estimated using a willingness-to-pay threshold of $50,000 per QALY gained; ICUR = the incremental cost-utility ratio.
The average costs and QALYs and their differences were estimated using the confounder-adjusted augmented inverse probability weighted estimator.
Sensitivity Analyses
Scenario 1: Sampling Uncertainty
Figure 2 shows the empirical distribution of the differences in average costs and QALYs (ΔC and ΔE) between the 2 groups from 1000 bootstrapped replications, for both the reference and non-reference cases. Each point on the graph represents results from one run of the model. From the figure, the majority of the points were in the northeast and southeast quadrants of the cost-effectiveness plane. Points below the horizontal reference line represent situations where EVT ± tPA was less costly and offered more health benefits.
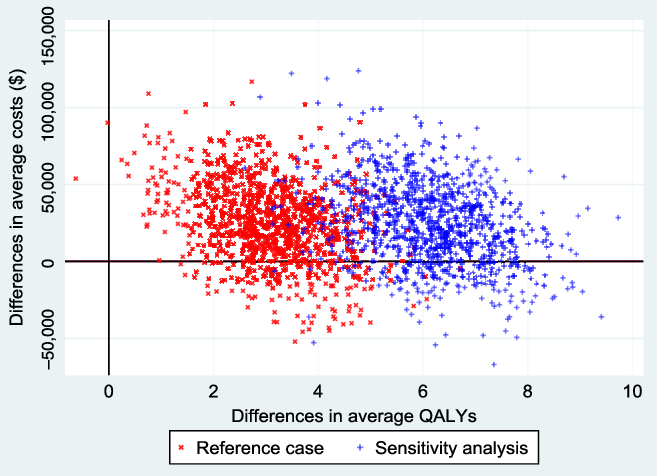
Figure 2: Cost-effectiveness plane from 1000 bootstrapped replications. The reference case represents QALYs estimated from health utility indexes from Kim et al. (2011), and the sensitivity (non-reference case), based on health utility indexes from Hong and Saver (2009). The negative average cost differentials represent situations where EVT ± tPA was less costly than standard care ± tPA. The probability that EVT ± tPA is cost-effective at a willingness-to-pay threshold of $50,000 was 0.85 in the reference case and 0.92 in the sensitivity analysis. These results were based on a discount rate of 1.5% per annum.
Scenario 2: Methodological Uncertainty: Varying WTP Threshold
The WTP threshold, λ, was allowed to vary from $0 to $80,000, and the results were evaluated. Figure 3 shows the NMB and the associated 95% CI for different values of WTP based on the bootstrapped sample, while Figure 4 shows the cost-effectiveness acceptability curve, which shows how the probability of cost-effectiveness increases with WTP for the reference case. Both figures show that the evidence in support of the cost-effectiveness of EVT increases with increases in the WTP, as expected.
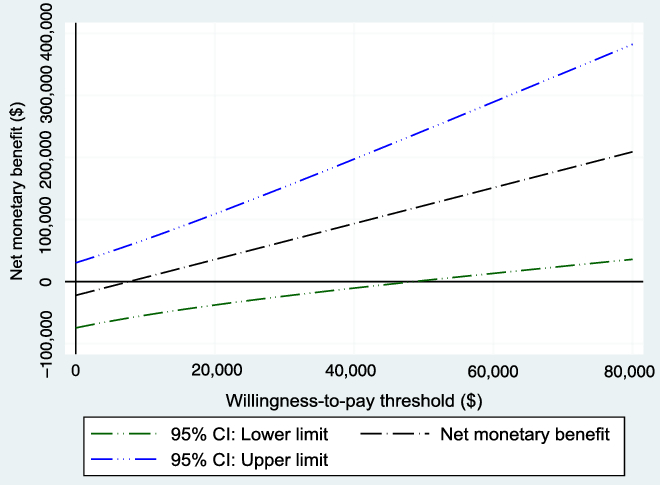
Figure 3: Net monetary benefit with varying willingness-to-pay thresholds from the 1000 bootstrapped replications (reference case). As expected, the net monetary benefit increases as the willingness-to-pay threshold increases.
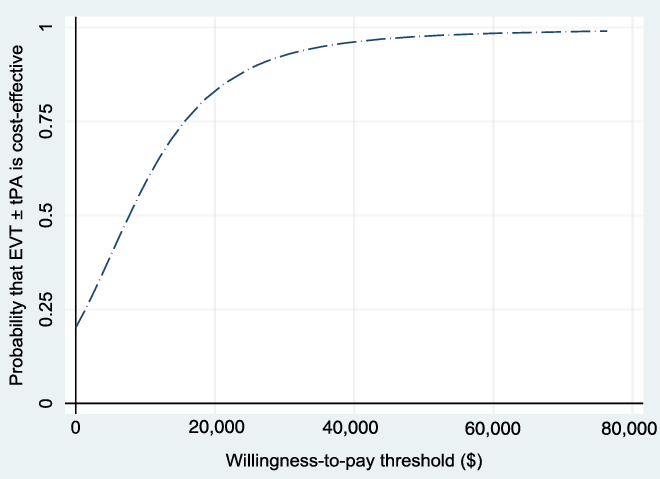
Figure 4: Cost-effectiveness acceptability curve (reference case, based on 1000 bootstrapped replications, using 1.5% discount rate) showing the probability that EVT ± tPA is cost-effective for different values of the willingness-to-pay threshold.
Scenario 3: Methodological Uncertainty: Discount Rate of 3% Per Annum
The analysis was repeated, discounting costs and QALYs at 3% (See Table 6). Again, there was no change in the conclusions.
Table 6: Cost-utility analysis results, reference case (discount rate at 3%)

QALYs = quality-adjusted life years; Net monetary benefit estimated using a willingness-to-pay threshold of $50,000 per QALY gained; ICUR = the incremental cost-utility ratio.
The average costs and QALYs and their differences were estimated using the confounder-adjusted augmented inverse probability weighted estimator.
Scenario 4: Methodological Uncertainty: QALYs from Another Source
The analysis was repeated for the non-reference case. See Tables 7 (discount rate of 1.5%) and 8 (discount rate of 3%) for the results. Also, see Figure 5. Again, there was no change in the conclusions.
Table 7: Cost-utility analysis results, non-reference case (discount rate at 1.5%)†

QALYs = quality-adjusted life years; Net monetary benefit estimated using a willingness-to-pay threshold of $50,000 per QALY gained; ICUR = the incremental cost-utility ratio.
† QALYs derived from health utility derived from disability weights reported in Hong and Saver (2009). The average costs and QALYs and their differences were estimated using the confounder-adjusted augmented inverse probability weighted estimator.
Table 8: Cost-utility analysis results, non-reference case (discount rate at 3%) †

QALYs = quality-adjusted life years; Net monetary benefit estimated using a willingness-to-pay threshold of $50,000 per QALY gained; ICUR = the incremental cost-utility ratio.
† QALYs derived from health utility derived from disability weights reported in Hong and Saver. The average costs and QALYs and their differences were estimated using the confounder-adjusted augmented inverse probability weighted estimator.
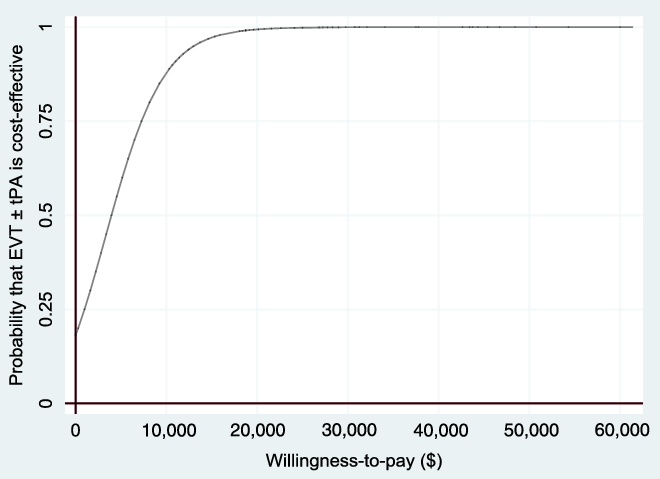
Figure 5: Cost-effectiveness acceptability curve (non-reference case, based on 1000 bootstrapped replications, using 1.5% discount rate) showing the probability that EVT ± tPA is cost-effective for different values of the willingness-to-pay threshold.
Summary of the Results
After accounting for uncertainty, patients treated with EVT ± tPA had a net gain of 2.89 (95% CI: 0.93–4.99) QALYs than those treated with standard care ± tPA (at a discount rate of 1.5%) and a net gain of 2.54 (95% CI: 1.49–3.73) QALYs at a discount rate of 3%, all in the reference case. In the non-reference case, the difference in QALYs was 5.89 (95% CI: 3.93–8.29) at a discount rate of 1.5% and 3.12% (95% CI: 1.99–4.20) at a discount rate of 3%. Concerning costs, the difference in costs was not statistically different from zero. The difference in average costs was $22,200 (95% CI: −28,902–78,244) when the discount rate was 1.5% and $20,892 (95% CI: −27,189–73,208) when the discount rate was 3%. In the cost-utility analyses, again, after accounting for uncertainty, the NMB was $122,300 (95% CI: −4777–253,133) with a 0.85 probability that EVT ± tPA is cost-effective at WTP threshold of $50,000 per QALY gained. The ICUR was $7682 per QALY gained (95% CI: −8126–53,194) in the reference case.
Financial Implications
Our results are indicative that EVT ± tPA is likely to be cost-effective. What is less clear is the financial implications, should the policymakers decide to provide more resources to scale up EVT treatment at the QEII HSC. Based on available data from the QEII HSC, there were 1243 reported cases of ischemic stroke in 2016 in Nova Scotia. Based on the reported cases from 2012 to 2016, we projected that there would be 1400 cases in 2019. Approximately 72% of the population live within less than 50 km away from the QEII HSC and so will likely use the ground ambulance as a means of transportation, with the other 28% most likely to use air transport to the QEII HSC. We estimated the expected transportation cost per case to be $3699. The EVT procedure cost per case was estimated at $8814. The average inpatient cost was $29,760 for EVT patients ($32,736 in the control group). There was a 30% chance that patients in the EVT ± tPA group will go to rehabilitation after discharge from the stroke unit, incurring rehabilitation costs (34% in the control group). Consequently, the expected rehabilitation costs were estimated at $9943 in the EVT ± tPA group ($16,929 in the control group). Concerning long-term care, from the sample, an equal number of patients from both treatment groups were transferred to long-term care at discharge from the stroke unit (two each).
Further, the mRS scores at discharge and follow-up were indicative that patients in the EVT ± tPA group had better functional outcomes than those in the control group, which will impact long-term care costs in favor of the EVT ± tPA group. Based on these assumptions, the expected cost of care per year per case was estimated at $48,517 for the EVT ± tPA group ($49,665 in the control group): The projected cost savings per case per year was $1148, in the absence of long-term care costs. If we assume that 20% of new cases for 2019 will utilize the EVT procedure (280 cases), the expected annual savings to the healthcare system will amount to $321,334 per year or $1,606,668 in 5 years.
Discussion and Conclusion
This study evaluated the cost-effectiveness of EVT ± tPA in the treatment of stroke at the QEII HSC in Halifax, Nova Scotia, Canada, compared to standard care ± tPA, using patient-level data that reflect the local population. The analyses involved the use of the AIPW estimator to generate the inputs required for the cost-utility analysis. The results show that patients treated with EVT ± tPA had better outcomes, measured in QALYs than patients who had standard care ± tPA. The QALYs gained ranged from 2.58 to 5.90 (discount rate of 1.5%) and 2.38 to 3.12 (discount rate of 3%) in all cases evaluated. The differences in average costs ranged from $9845 to $22,200 in all cases. At a discount rate of 1.5%, the ICUR ranged from $3769 per QALY gained to $8225 per QALY gained. The probability that EVT ± tPA was cost-effective at a WTP threshold of $50,000 per QALY ranged from 0.85 to 0.99. Assuming that 20% of new cases for 2019 will utilize the EVT procedure (280 cases), the expected annual savings to the healthcare system will amount to $321,334 per year or $1,606,668 in 5 years, if the utilization rate and the target population remains the same.
How does this result compare with others? In our study, the average QALYs for EVT ± tPA patients at 90 days poststroke was 0.11 and 0.04 for standard care ± tPA, with QALYs gained of 0.07 (95% CI: 0.04–0.10, see Table 3), which matches the 0.073 reported by Xie et al.Reference Xie, Lambrinos and Chan3 Further, the present study reported QALYs gained of 2.54 (at a discount rate of 3%, see Table 5), and an ICUR of $8225 per QALY gained, whereas Xie et alReference Xie, Lambrinos and Chan3 – using a discount rate of 5%, and a Markov decision model – reported QALYs gained of 0.21 and an ICUR of $11,990 per QALY gained in their base case. A Health Quality Ontario report reported an ICUR of $11,990 per QALY gained (at a discount rate of 5%).30 Further, they reported 0.35 QALYs gained and an ICUR of $26,818 per QALY gained using data from the ESCAPE trial. The Ontario report used a discount rate of 5%, so a direct comparison of the two results may be misleading. Our approach was consistent with CADTH’s recommendations (4th edition).17 However, the direction of the results in both studies was consistent. Also, our results were consistent with findings in CADTH’s 2018 report on EVT for patients with ischemic stroke,5 and Sevick et al.Reference Sevick, Ghali and Hill6
This study was based on real-world patient-level data, which was representative of the population of Nova Scotia, therefore making the results generalizable. Access to patient-level data allowed us to control for potential confounding factors, allowing for heterogeneity, unlike analytic decision models that are based on a representative individual. We found robust evidence to support the cost-effectiveness of EVT ± tPA compared to standard care ± tPA. To the best of our knowledge, this study was the first to assess the cost-effectiveness of EVT using data from patients not enrolled in a clinical trial. Further, our study demonstrates the potential for leveraging patient-level data from administrative and clinical databases – real-world data – for cost-effectiveness studies. At the minimum, this study provides an objective and robust economic evaluation of the EVT treatment of ischemic stroke caused by proximal intracranial large-vessel occlusion involving the anterior cerebral circulation in Nova Scotia.
There were some limitations. There was information on where patients were referred from, but not how they arrived at our center, with the implication that assumptions had to be made about the mode of transportation. Also, there was no primary data on health utility indexes for the patients, so we had to rely on health utility indexes from the literature to generate the QALYs. Further, there was less information about the patients after the last hospital follow-up. However, this limitation will only affect 32% of the sample (28/88) who were transferred to the rehabilitation center, as 31% (27/88) were dead at last follow-up, and 35.2% (31/88) were discharged home from the stroke unit. Out of the 32% at the rehabilitation center, we assumed that those who were functionally dependent at follow-up would require long-term care. These limitations notwithstanding, based on the results from the analyses, including the sensitivity analysis, we are confident about the robustness of our results.
Disclosures
Dr. SJP reports participation in the ESCAPE and ESCAPE-NA1 clinical trials, and in the planning and implementation of a provincial EVT program in Nova Scotia, Canada. All other authors have nothing to disclose.
Statement of Authorship
PSK performed the cost-utility analyses and wrote the manuscript; SXH and KV co-led the case-control study and collected the patient data; WLS collected the data for the Acute Stroke Registry; CAC maintains the Acute Stroke Registry; HC devised the algorithm for matching the cases and controls; JJSS supervised the neuroradiological aspects of the study; SJP conceived the study and supervised the neurological aspects; all authors reviewed the manuscript.


