


1. Introduction
NiO films are versatile materials with antiferromagnetic properties (Aytan et al. Reference Aytan, Debnath, Kargar, Barlas, Lacerda, Li, Lake, Shi and Balandin2017) and p-type semiconductors (3.6 eV band gap) (Zhai et al. Reference Zhai2014; Mokoena, Swart & Motaung Reference Mokoena, Swart and Motaung2019) with metal-deficient structures. Due to their excellent chemical stability, natural NiO films have been proposed for multiple applications, ranging from gas sensors (Soleimanpour, Jayatissa & Sumanasekera Reference Soleimanpour, Jayatissa and Sumanasekera2013) to catalysts (Rahardjo & Shih Reference Rahardjo and Shih2023), electrochromic windows (Sutar et al. Reference Sutar, Babar, Pisal, Inamdar and Mujawar2023) and even fuel cells (Elessawy et al. Reference Elessawy, Abdel Rafea, Roushdy, Youssef and Gouda2023). The NiO structure is stable for production across major physical and chemical deposition methods. NiO thin films have reportedly been produced by different techniques, including atomic layer deposition (ALD) (Solanki et al. Reference Solanki2023; Wang, Lin & Lu Reference Wang, Lin and Lu2023), sol–gel (Raimundo et al. Reference Raimundo, Silva, Santos, Araújo, Oliveira, Morales, Soares and Macedo2023), RF (Elmassi et al. Reference Elmassi, Narjis, Nkhaili, Elkissani, Amiri, Drissi, Abali, Bousseta and Outzourhit2022) or DC (Shen et al. Reference Shen2025) magnetron sputtering and pulsed laser deposition (PLD) (Hameed, Ali & Al-Awadi Reference Hameed, Ali and Al-Awadi2020; Jin et al. Reference Jin, Zhu, He, Chen, Liu, Li, Liu, Liu and Chen2020; Farha Reference Farha2023). Among the techniques used, PLD has shown room temperature heteroepitaxy for NiO deposited on MgO substrates and generally provides a complex environment for tailoring structural, morphological and physical properties by adjusting the deposition parameters. The implementation of plasma diagnostics as a tool for in situ control and deposition control has recently been shown by our group for AgO (Irimiciuc et al., Reference Irimiciuc, Chertopalov, Novotný, Craciun, Lancok and Agop2022a ), CuO (Volfová et al. Reference Volfová2023) and CuI (Irimiciuc et al. Reference Irimiciuc, Chertopalov, Novotný, Craciun and Lancok2021) systems, and has been implemented by the Geohegan group (Giuffredi et al. Reference Giuffredi2020; Lin et al. Reference Lin2020; Bertoldo et al. Reference Bertoldo2021; Harris et al. Reference Harris2023) in what they have named autonomous PLD, where in situ plasma diagnostics (Langmuir Probe and ICCD camera imaging) are used as control tools to tailor the properties of the films.
Plasma diagnostic results for NiO laser-produced plasmas are scarce, with several studies only providing the outcome of optical emission investigations or only focused on metallic Ni plasma dynamics under various irradiation conditions (Berman & Wolf Reference Berman and Wolf1998; Donnelly et al. Reference Donnelly, Lunney, Amoruso, Bruzzese, Wang and Ni2009; Smijesh, Chandrasekharan & Philip Reference Smijesh, Chandrasekharan and Philip2014; Smijesh et al. Reference Smijesh, Chandrasekharan, Joshi and Philip2014; Svendsen, Ellegaard & Schou Reference Svendsen, Ellegaard and Schou1996). Jadoual et al. (Reference Jadoual, El Boujlaidi, El Fqih, Aamouche and Kaddouri2014) reported differences in the optical emission spectra of Ni and NiO, with important differences in the emission light intensity and spectral distribution induced by the different absorption and ablation mechanisms involved. Most of the reported work only addresses the properties of the resulting films as a function of the various plasma conditions (Fasaki et al. Reference Fasaki, Giannoudakos, Stamataki, Kompitsas, György, Mihailescu, Roubani-Kalantzopoulou, Lagoyannis and Harissopulos2008; Kumar et al. Reference Kumar, Baratto, Faglia, Sberveglieri, Bontempi and Borgese2015; Qiu et al. Reference Qiu, Gong, Zheng, Yuan, Zhang, Zhu, Zhou and Cao2017; Thomas et al. Reference Thomas, Joshi, Kumar and Philip2018; Hajakbari, Rashvand & Hojabri Reference Hajakbari, Rashvand and Hojabri2019; Zhao, Ho-Baillie & Bremner Reference Zhao, Ho-Baillie and Bremner2020; Iacono et al. Reference Iacono, Scuderi, Amoruso, Gulino, Ruffino and Mirabella2023) without providing clear characterisation of the deposition tool (laser-produced plasmas, gas discharges, etc.). Therefore, to promote PLD as one of the best tools for NiO production, information on the kinetics and gas phase reactions for NiO plasma is mandatory.
In this paper, we present a comprehensive report on the dynamics of NiO plasmas generated by laser ablation and expansion in various atmospheres. Insight into the plasma dynamics of NiO under usual PLD conditions is provided by the angle- and time-resolved LP methods. Angular acceleration and selective distribution of charges based on their ionisation and nature are found to be general features of NiO plasma. The formation of transient double-layer accelerating ions as a result of plasma structuring is also addressed in this report.
2. Materials and methods
A NiO target (Kurt J. Lesker Company Ltd., 99.9 % pure, 25.4 mm diameter, 6.35 mm thick) was irradiated with a YAG laser ( $ \lambda $
= 266 nm, 5 ns, 10 Hz) using a 4.3 J cm−
2 laser fluence. Irradiation occurred under conditions similar to those of PLD, which involved continuous rotation of the target to provide a fresh surface for each irradiation pulse and to avoid crater formation or local heating. A cylindrical Langmuir probe (tungsten wire from Advent Research Materials Ltd., purity 99.95 %, diameter 0.2 mm and exposed length 2 mm) was placed at 37 mm with a metallic substrate positioned 50 mm from the target to simulate the PLD geometry (figure 1). Plasma investigations were performed at various pressures of O2, N2 and Ar in a range from 5 × 10⁻⁵ Pa residual pressure to 10 Pa. Each investigation was preceded by a cleaning procedure (1200 pulses at a 10 Hz repetition rate using a fluence of 4.3 J cm−2), with the LP being shielded during the procedure from the incoming transient plasma during the cleaning procedure. The time-resolved investigations involved the collection of ionic or electronic temporal traces by applying a wide range of biases (±20 V with 50 intermediate values) and collecting the voltage signal across a load resistor (1 k
$ \lambda $
= 266 nm, 5 ns, 10 Hz) using a 4.3 J cm−
2 laser fluence. Irradiation occurred under conditions similar to those of PLD, which involved continuous rotation of the target to provide a fresh surface for each irradiation pulse and to avoid crater formation or local heating. A cylindrical Langmuir probe (tungsten wire from Advent Research Materials Ltd., purity 99.95 %, diameter 0.2 mm and exposed length 2 mm) was placed at 37 mm with a metallic substrate positioned 50 mm from the target to simulate the PLD geometry (figure 1). Plasma investigations were performed at various pressures of O2, N2 and Ar in a range from 5 × 10⁻⁵ Pa residual pressure to 10 Pa. Each investigation was preceded by a cleaning procedure (1200 pulses at a 10 Hz repetition rate using a fluence of 4.3 J cm−2), with the LP being shielded during the procedure from the incoming transient plasma during the cleaning procedure. The time-resolved investigations involved the collection of ionic or electronic temporal traces by applying a wide range of biases (±20 V with 50 intermediate values) and collecting the voltage signal across a load resistor (1 k $\Omega$
) with a Tektronix DPO 4140 oscilloscope. The angle-resolved investigations were performed by placing the unbiased probe at various angles (0°–50°) with respect to the main expansion axis (defined as the axis orthogonal to the laser-target impact point). Each electrical measurement was time-synchronised by a fast silicon photodiode (Thorlabs FDS100), which signals the moment the laser beam arrives at the target.
$\Omega$
) with a Tektronix DPO 4140 oscilloscope. The angle-resolved investigations were performed by placing the unbiased probe at various angles (0°–50°) with respect to the main expansion axis (defined as the axis orthogonal to the laser-target impact point). Each electrical measurement was time-synchronised by a fast silicon photodiode (Thorlabs FDS100), which signals the moment the laser beam arrives at the target.
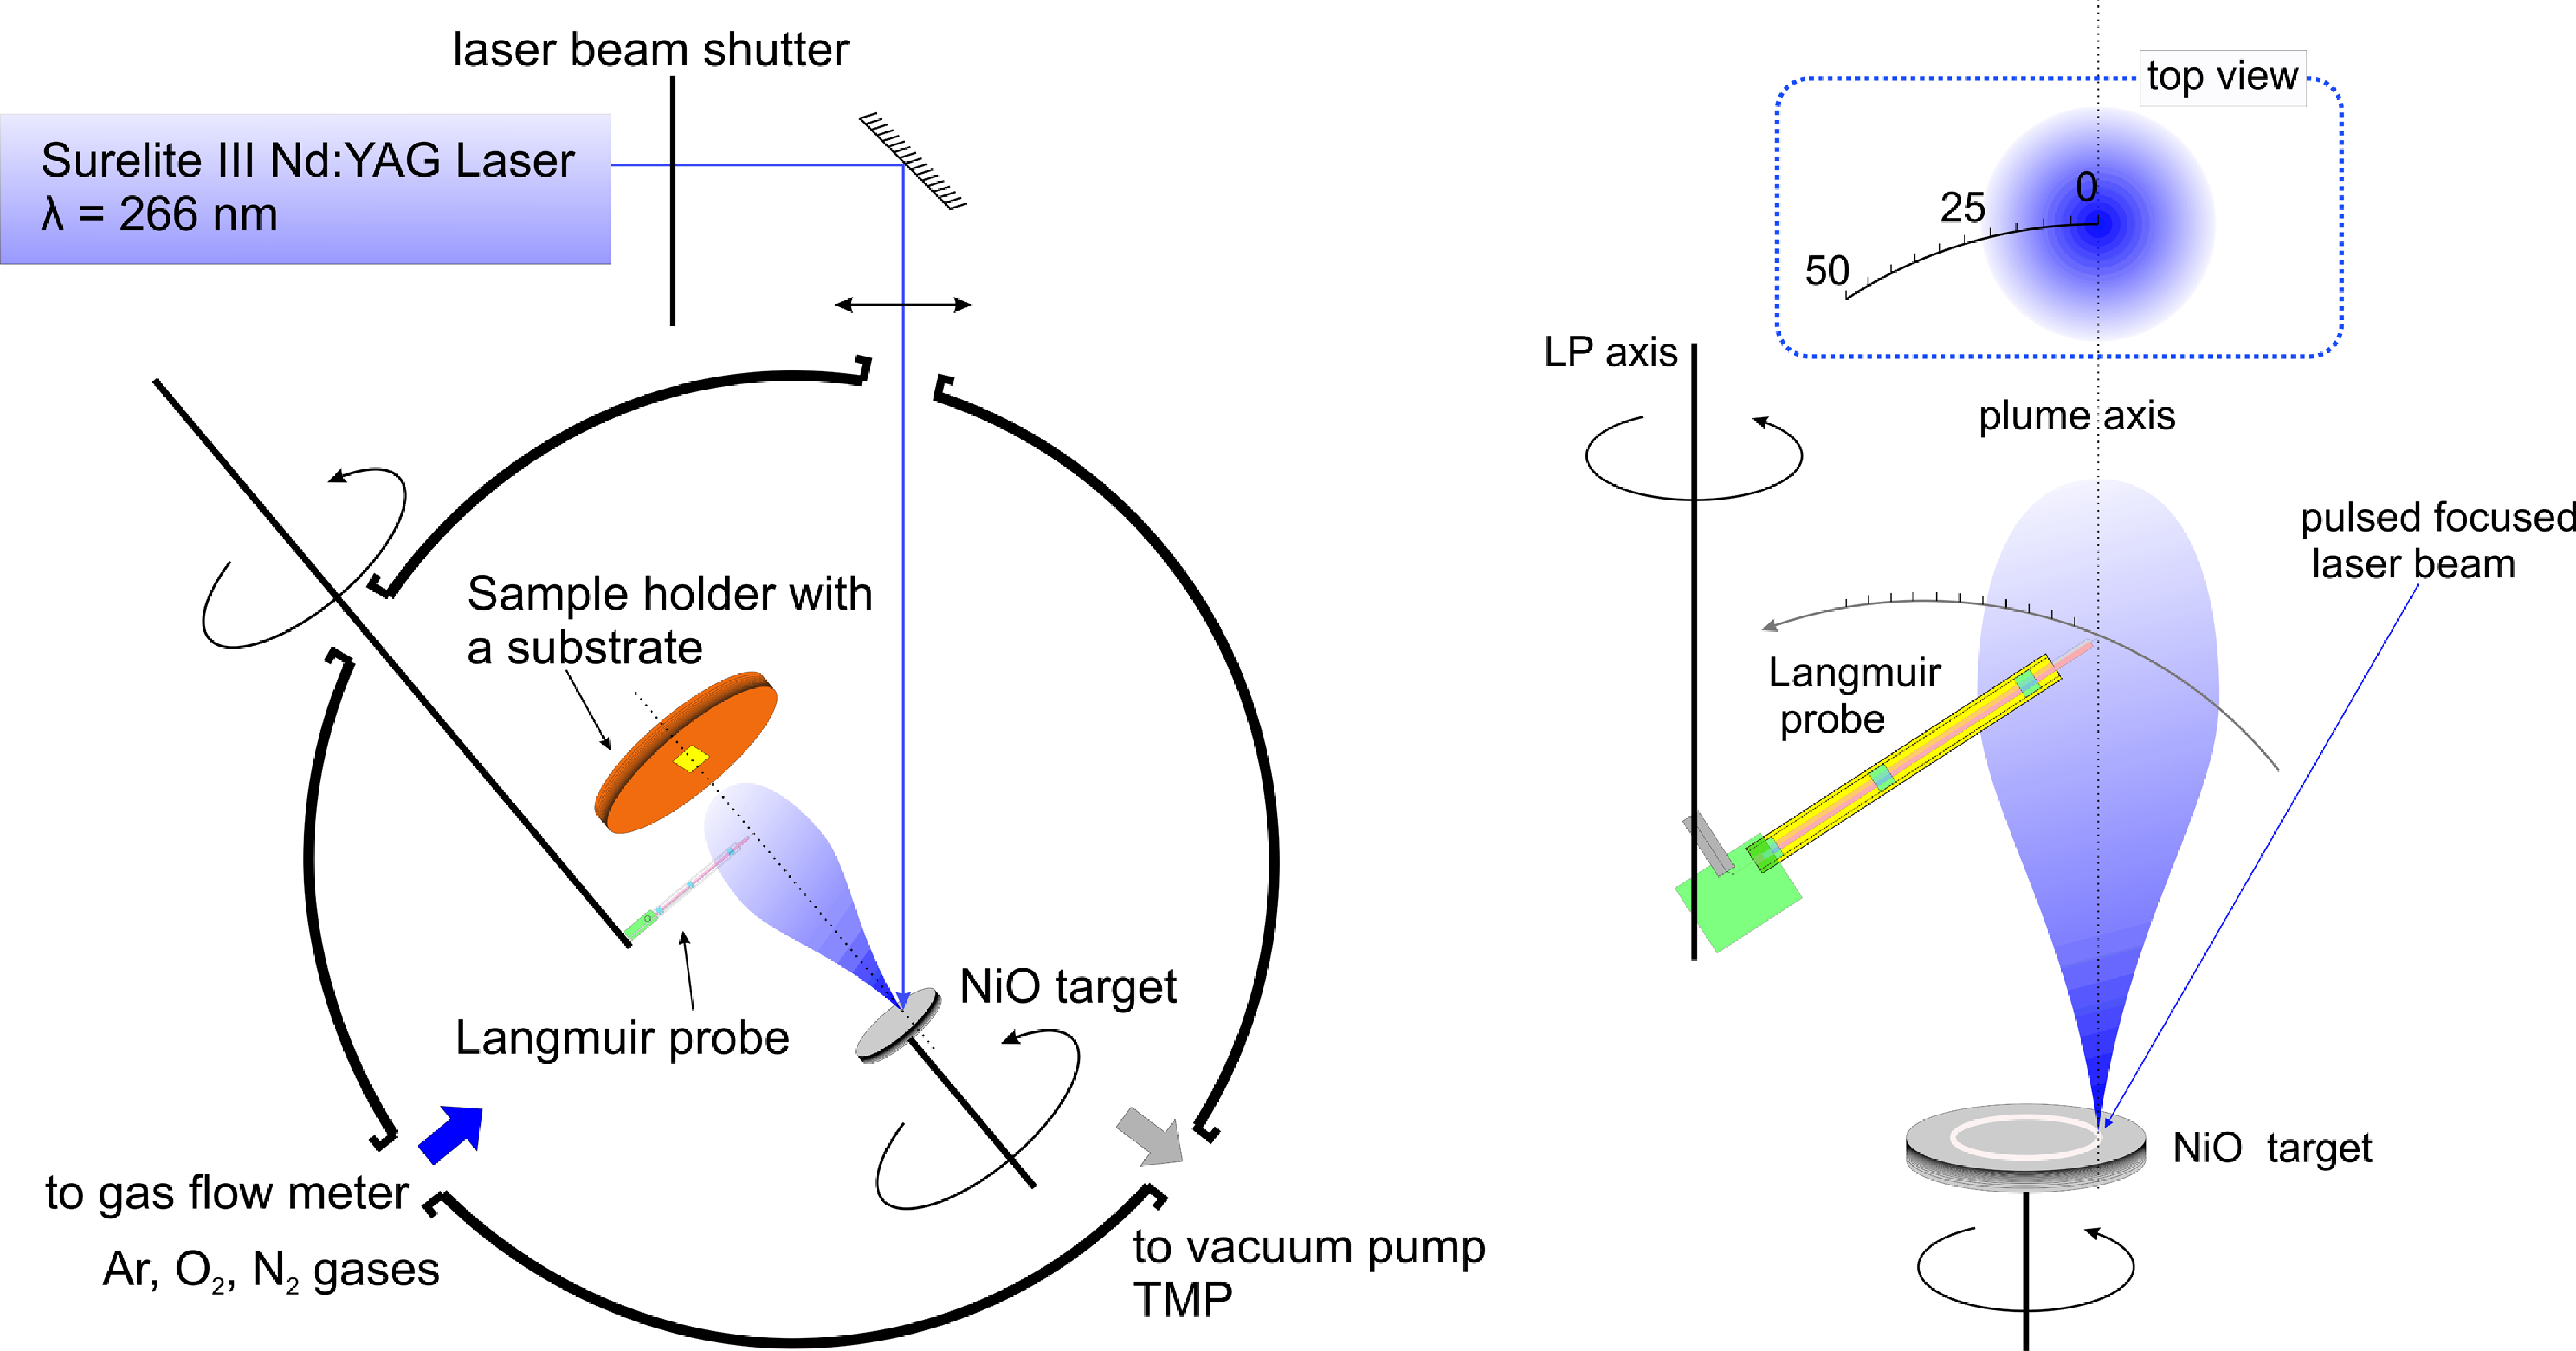
Figure 1. Schematic representation of the experimental set-up.
3. Results and discussions
3.1. Angular acceleration and multistructuring
An angle-resolved approach (Giovanielli, Kephart & Williams Reference Giovanielli, Kephart and Williams1976; Konomi, Motohiro & Asaoka Reference Konomi, Motohiro and Asaoka2009; Donnelly et al. Reference Donnelly, Lunney, Amoruso, Bruzzese, Wang and Ni2010a ; Giovannini et al. Reference Giovannini, Gambino, Rollinger and Abhari2015) to laser-produced plasma (LPP) diagnostics was shown to be an important tool in attempting to correlate the property dynamics inside the plasma plume with the outcome properties of deposited thin films. Figure 2 shows the evolution of the non-biased charge current as a function of the measuring angle in the range of 45° with respect to the main expansion plane, defined by the axis orthogonal to the irradiated surface. Figure 2(a) shows that the net charge in the centre of the plume is negative, while the edges of the plasma are dominated by a positive net charge. In our previous papers (Irimiciuc et al. Reference Irimiciuc, Chertopalov, Novotný, Craciun and Lancok2021; Irimiciucet al., Reference Irimiciuc, Chertopalov, Novotný, Craciun, Lancok and Agop2022a ; Volfová et al. Reference Volfová2023), we showed that the negative contribution to the floating current can be generated by electrons and positively charged ions (in our case, O–), while the positive contribution contains mainly charged ions (Ni+). Therefore, the NiO-generated plasma has a very particular angular distribution, which entails a stoichiometric break at larger angles. By transferring these results and considering the cylindrical symmetry of the plasma, the optimum deposition conditions for stoichiometric NiO films under vacuum can be achieved on a 1 cm2 surface area.
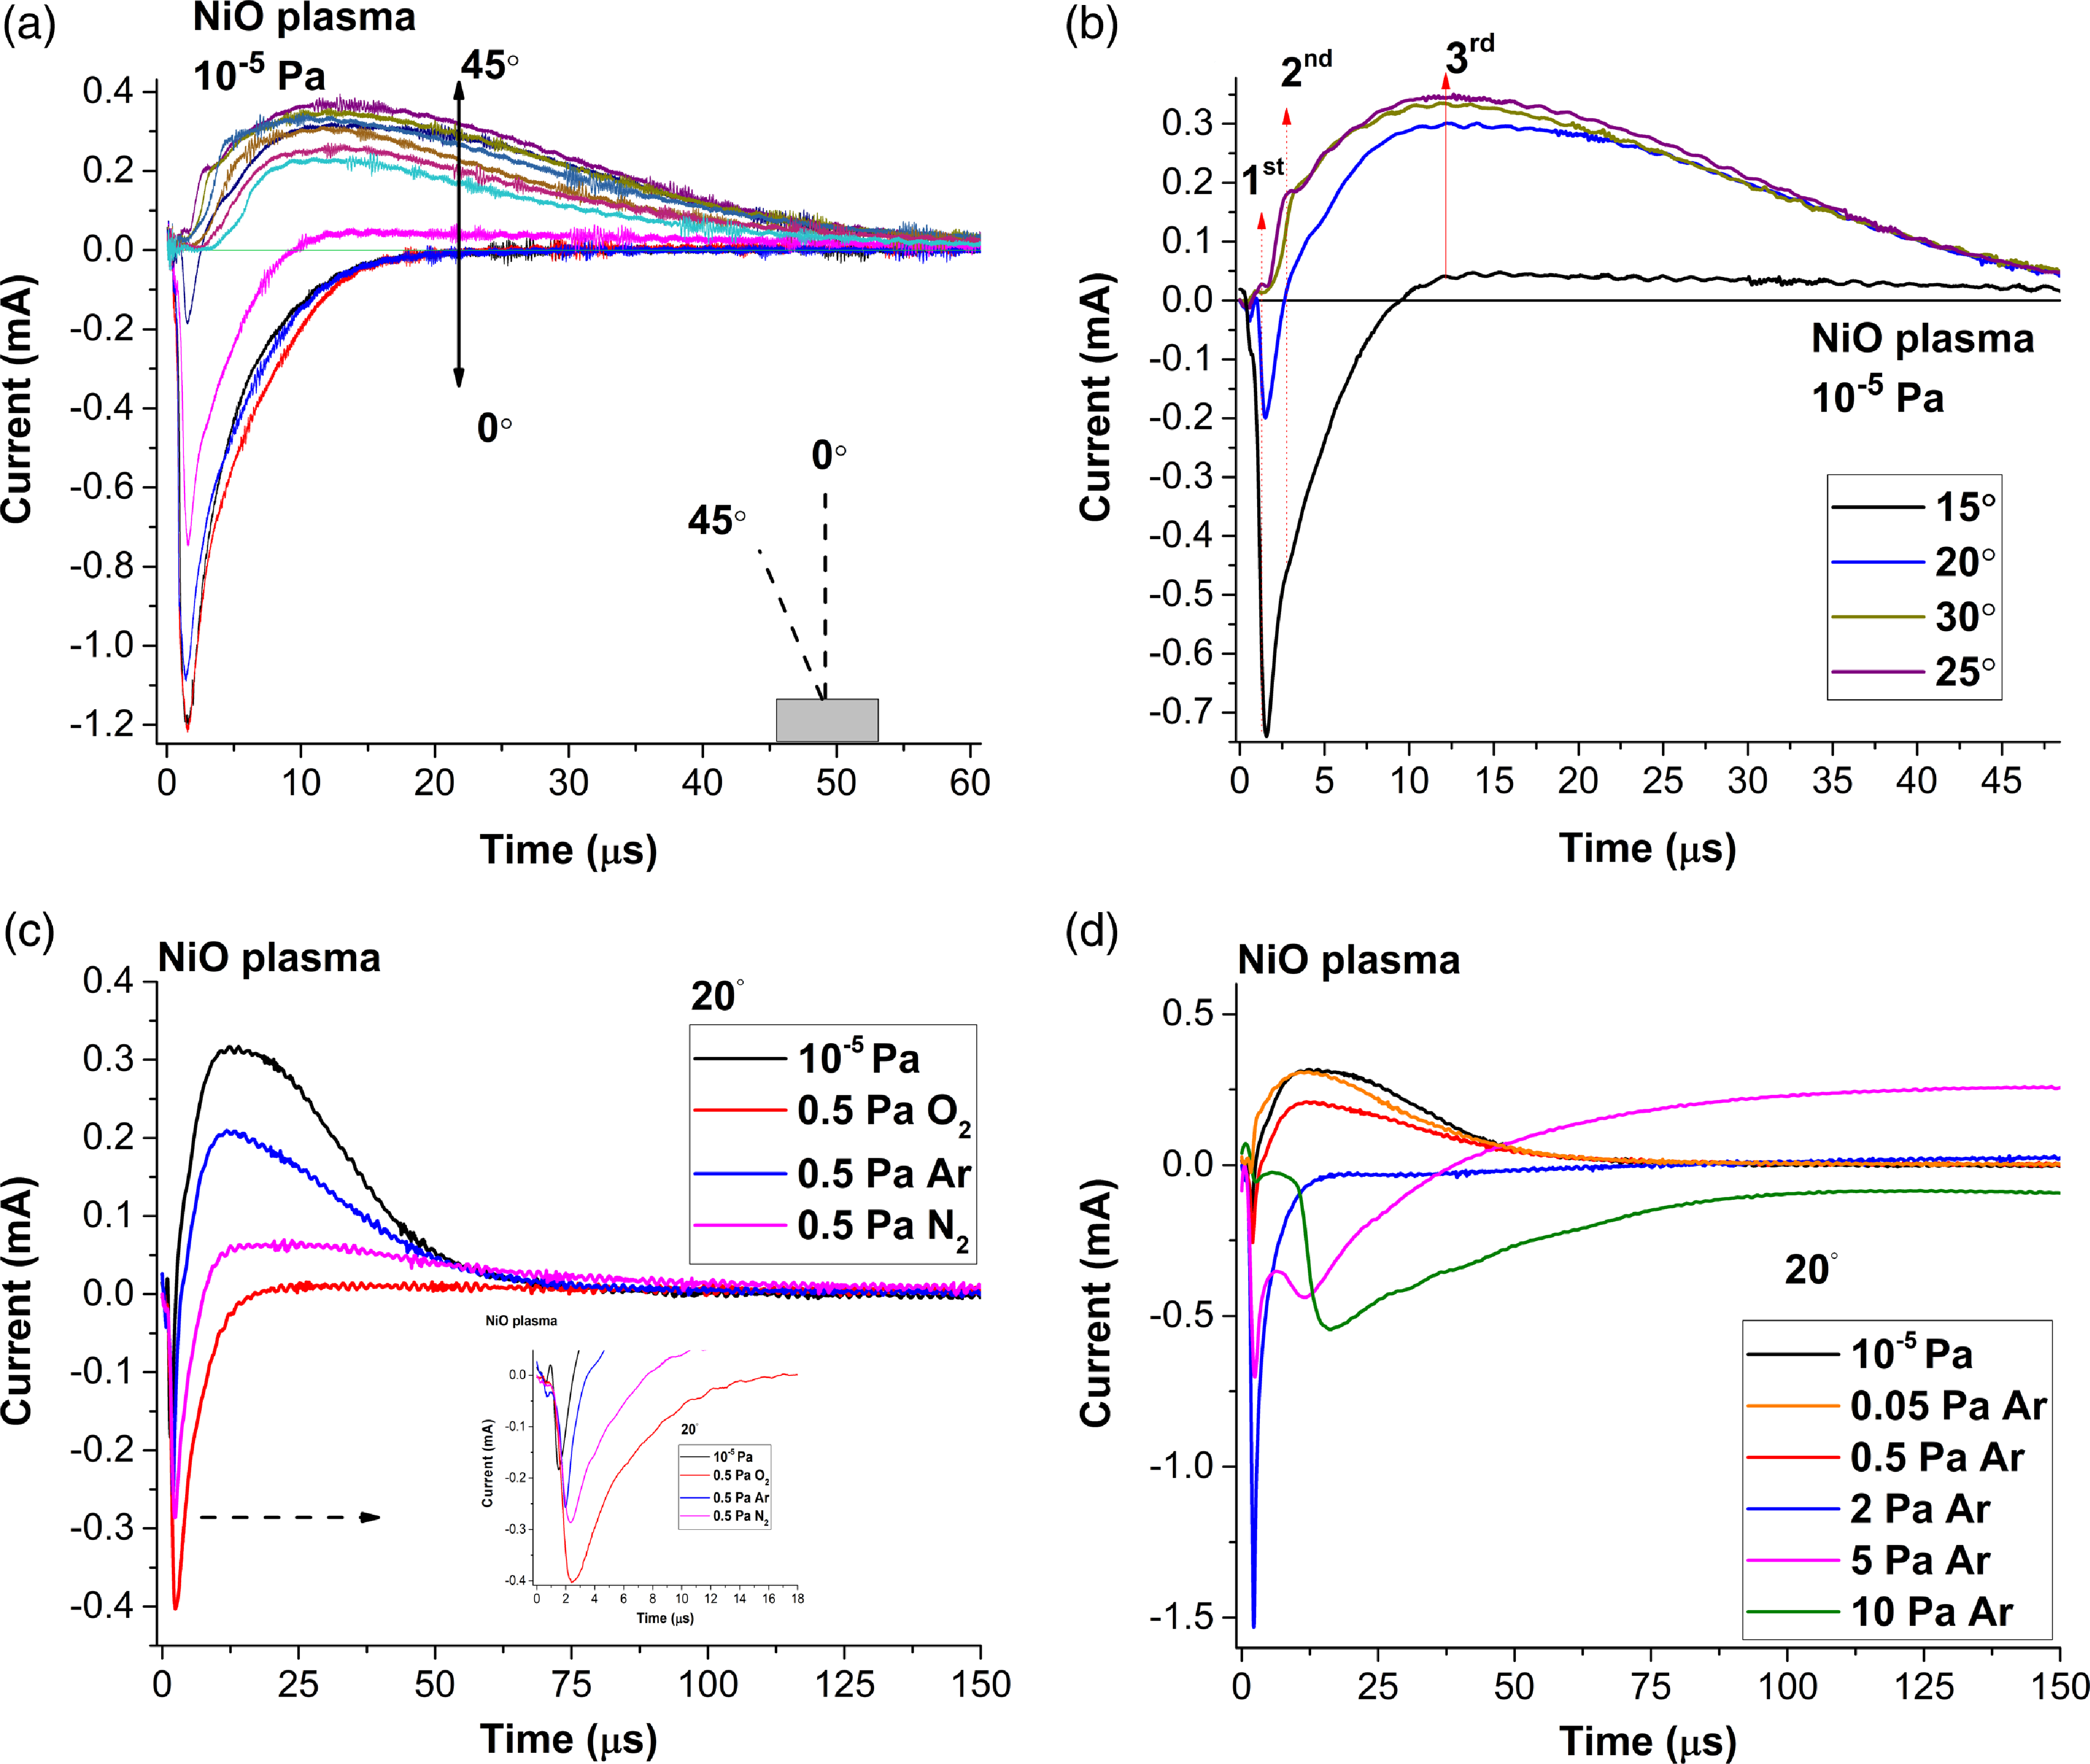
Figure 2. (a) Charged particle temporal traces for various measurement angles for NiO plasma expanding in 10–5 Pa; (b) the current transition in a 15° measurement window; (c) the atmosphere effect on the charge particle temporal traces and (d) the pressure effect on the structure of the charged particle temporal traces at 20°.
Figure 2(b) shows the details of the electrical signals collected between 15° and 25°. The transition between negative and positive net charges occurs over a plasma distance of 5 mm and highlights the presence of three main contributions to the current: two fast peaks with arrival times <1 µs and one in the tens of 1 µs range. Multiple structures are expected due to the presence of multiple ionized states, and the selective acceleration of Ni+ and O– in various plasma volumes can induce multiple peaks in the floating charge temporal traces. The particularities of NiO plasma allow for fine control with variations in pressure. To confirm this, the dynamics of NiO plasma were investigated with the addition of various gases (figure 2(c) for 20°). An Ar pressure of 0.5 Pa maintains the shape of the temporal trace with a 500 ns shift in the negative peak and a 0.11 mA decrease in the Ni– contribution. The addition of N2 followed the same trend as Ar, with a stronger inhibition of the positive peak (0.255 mA) and an 850 ns shift of the negative peak. The differences can have a two-fold nature. They can be induced by scattering effects and by the differences in scattering cross-section of the N2, O2, O, N or Ar species. Alternatively, if we consider, secondary effects induced by the scattering processes such as: molecule dissociation, gas ionisation and acceleration, significant differences can be identified for N2 dissociation (9.7 eV) and subsequent ionisation (14.5 eV) compared with Ar (15.7 eV ionisation energy). The presence of 0.5 Pa of O2 resulted in a reduction of approximately 99 % of the Ni+ positive peak and a shift of 970 ns of the positive peak. These results confirm the occurrence of selective acceleration, which means that the plasma structure becomes more uniform. In figure 2(d), it can be seen that the increase of the Ar working gas pressure causes a confinement of the positive (Ni+) peak after 2 Pa and a slowing of the plasma, as identified by the higher arrival times and the widening of the negative (O–) peak. The contribution associated with Ni– is considerable reduced at 20° with the addition of Ar. This effect can be attributed to the stronger angular separation of the charges within the plasma volume as the pressure increase.
From the time of arrival temporal traces, according to previous approaches (Torrisi & Gammino Reference Torrisi and Gammino2006; Mascali et al. Reference Mascali, Gambino, Miracoli, Gammino, Torrisi, Maimone and Tumino2008; Torrisi et al. Reference Torrisi, Caridi, Margarone and Borrielli2008) and expanded by our group (Irimiciuc et al. Reference Irimiciuc, Chertopalov, Craciun, Novotný and Lancok2020; Irimiciuc et al. Reference Irimiciuc, Chertopalov, Lancok and Craciun2021), the charged particle energy distribution can be computed. Figure 3(a) shows the angular distribution of the fast particle charge density and the corresponding kinetic energy. The high-energy particles are ejected from the sample via an electrostatic mechanism (Bulgakov & Bulgakova Reference Bulgakov and Bulgakova1999) and are accelerated in the field generated from the charge separation that occurs during the first femtosecond of the laser–matter interaction (Ojeda-G-P et al. Reference Ojeda-G-P, Yao, Bulgakova, Bulgakov and Lippert2019; Yao et al. Reference Yao, Schneider, Bulgakova, Bulgakov and Lippert2023). Under our irradiation conditions, according to the previously reported procedure (Torrisi et al. Reference Torrisi, Gammino, Andò and Làska2002; Láska et al. Reference Láska, Krása, Pfeifer, Rohlena, Gammino, Torrisi, Andò and Ciavola2004; Picciotto et al. Reference Picciotto, Krása, Láska, Rohlena, Torrisi, Gammino, Mezzasalma and Caridi2006; Cutroneo et al. Reference Cutroneo, Mackova, Malinsky, Matousek, Torrisi and Ullschmied2015), the initial peak acceleration field is 224 kV cm−1. Under vacuum conditions (10–5 Pa), the energy decreases monotonically following a $cos^{n}(\theta )$
, as was reported by Toftmann et al. (Reference Toftmann, Schou, Hansen and Lunney2000). The overall kinetic energy of the fastest group of particles from the plasma reaches a maximum of 1.6 keV in front of the plume, decreasing towards 40 eV at the edge. The charge density reaches a maximum of 9.5
$cos^{n}(\theta )$
, as was reported by Toftmann et al. (Reference Toftmann, Schou, Hansen and Lunney2000). The overall kinetic energy of the fastest group of particles from the plasma reaches a maximum of 1.6 keV in front of the plume, decreasing towards 40 eV at the edge. The charge density reaches a maximum of 9.5 $\times$
1012 cm–3 at 10° for the negatively charged oxides and 1.27
$\times$
1012 cm–3 at 10° for the negatively charged oxides and 1.27 $\times$
1013 cm–3 at 35°, which is in line with values reported for other investigated oxides (De Giacomo, Shakhatov & De Pascale Reference De Giacomo, Shakhatov and De Pascale2001; Irimiciuc et al., Reference Irimiciuc, Chertopalov, Novotný, Craciun, Lancok and Agop2022a
). The density maxima are reached immediately before and after the transition region of 15°–30°, which confirms the selective acceleration of charges in this region and the formation of a transient double layer that will expel the Ni+ ions out of the plasma core. Further confirmation of the angular acceleration field can be seen in figure 3(b), where we have represented the angular distribution of the fast and slow ionic groups. The two angular distributions have shifted maxima of approximately 15°, which is induced by the selective angular acceleration and kinetic separation of the plasma across the 20° axis. The introduction of various gases during the expansion generally shifts this acceleration region to 35° for pressure values of 5 and 10 Pa. In these expansion regimes, the dynamics is dominated by a greater number of collisions, with the mean free path ranging from 6 mm for 5 Pa to 0.6 mm for 10 Pa and enhanced chemical reactions in the gas phase for the N2 and O2 cases (Irimiciuc et al. Reference Irimiciuc, Chertopalov, Novotný, Craciun, Lancok and Agop2022a
). Another main difference between the nature of the gas (reactive/inert) is shown in figure 3(c,d), where under identical pressure conditions, the expansion velocities for both negative and positive charges are shown. For the O2 atmosphere, the values are overall greater by a factor of 2, reaching a maximum value of 9 km s−1 at 40°, for the positive charges, and a factor of 1.2, with values reaching 115 km s−1 for the negative charges, while for Ar, the values are 3.2 km s−1 and 92 km s−1, respectively. Another significant difference is that the addition of Ar induced a sharper transition of just 5° (equivalent to a 3 mm plasma width) compared with that of reactive gases (O2, N2), where the transition remains a gradual transition of approximately 15° (equivalent to a 9 mm plasma width).
$\times$
1013 cm–3 at 35°, which is in line with values reported for other investigated oxides (De Giacomo, Shakhatov & De Pascale Reference De Giacomo, Shakhatov and De Pascale2001; Irimiciuc et al., Reference Irimiciuc, Chertopalov, Novotný, Craciun, Lancok and Agop2022a
). The density maxima are reached immediately before and after the transition region of 15°–30°, which confirms the selective acceleration of charges in this region and the formation of a transient double layer that will expel the Ni+ ions out of the plasma core. Further confirmation of the angular acceleration field can be seen in figure 3(b), where we have represented the angular distribution of the fast and slow ionic groups. The two angular distributions have shifted maxima of approximately 15°, which is induced by the selective angular acceleration and kinetic separation of the plasma across the 20° axis. The introduction of various gases during the expansion generally shifts this acceleration region to 35° for pressure values of 5 and 10 Pa. In these expansion regimes, the dynamics is dominated by a greater number of collisions, with the mean free path ranging from 6 mm for 5 Pa to 0.6 mm for 10 Pa and enhanced chemical reactions in the gas phase for the N2 and O2 cases (Irimiciuc et al. Reference Irimiciuc, Chertopalov, Novotný, Craciun, Lancok and Agop2022a
). Another main difference between the nature of the gas (reactive/inert) is shown in figure 3(c,d), where under identical pressure conditions, the expansion velocities for both negative and positive charges are shown. For the O2 atmosphere, the values are overall greater by a factor of 2, reaching a maximum value of 9 km s−1 at 40°, for the positive charges, and a factor of 1.2, with values reaching 115 km s−1 for the negative charges, while for Ar, the values are 3.2 km s−1 and 92 km s−1, respectively. Another significant difference is that the addition of Ar induced a sharper transition of just 5° (equivalent to a 3 mm plasma width) compared with that of reactive gases (O2, N2), where the transition remains a gradual transition of approximately 15° (equivalent to a 9 mm plasma width).
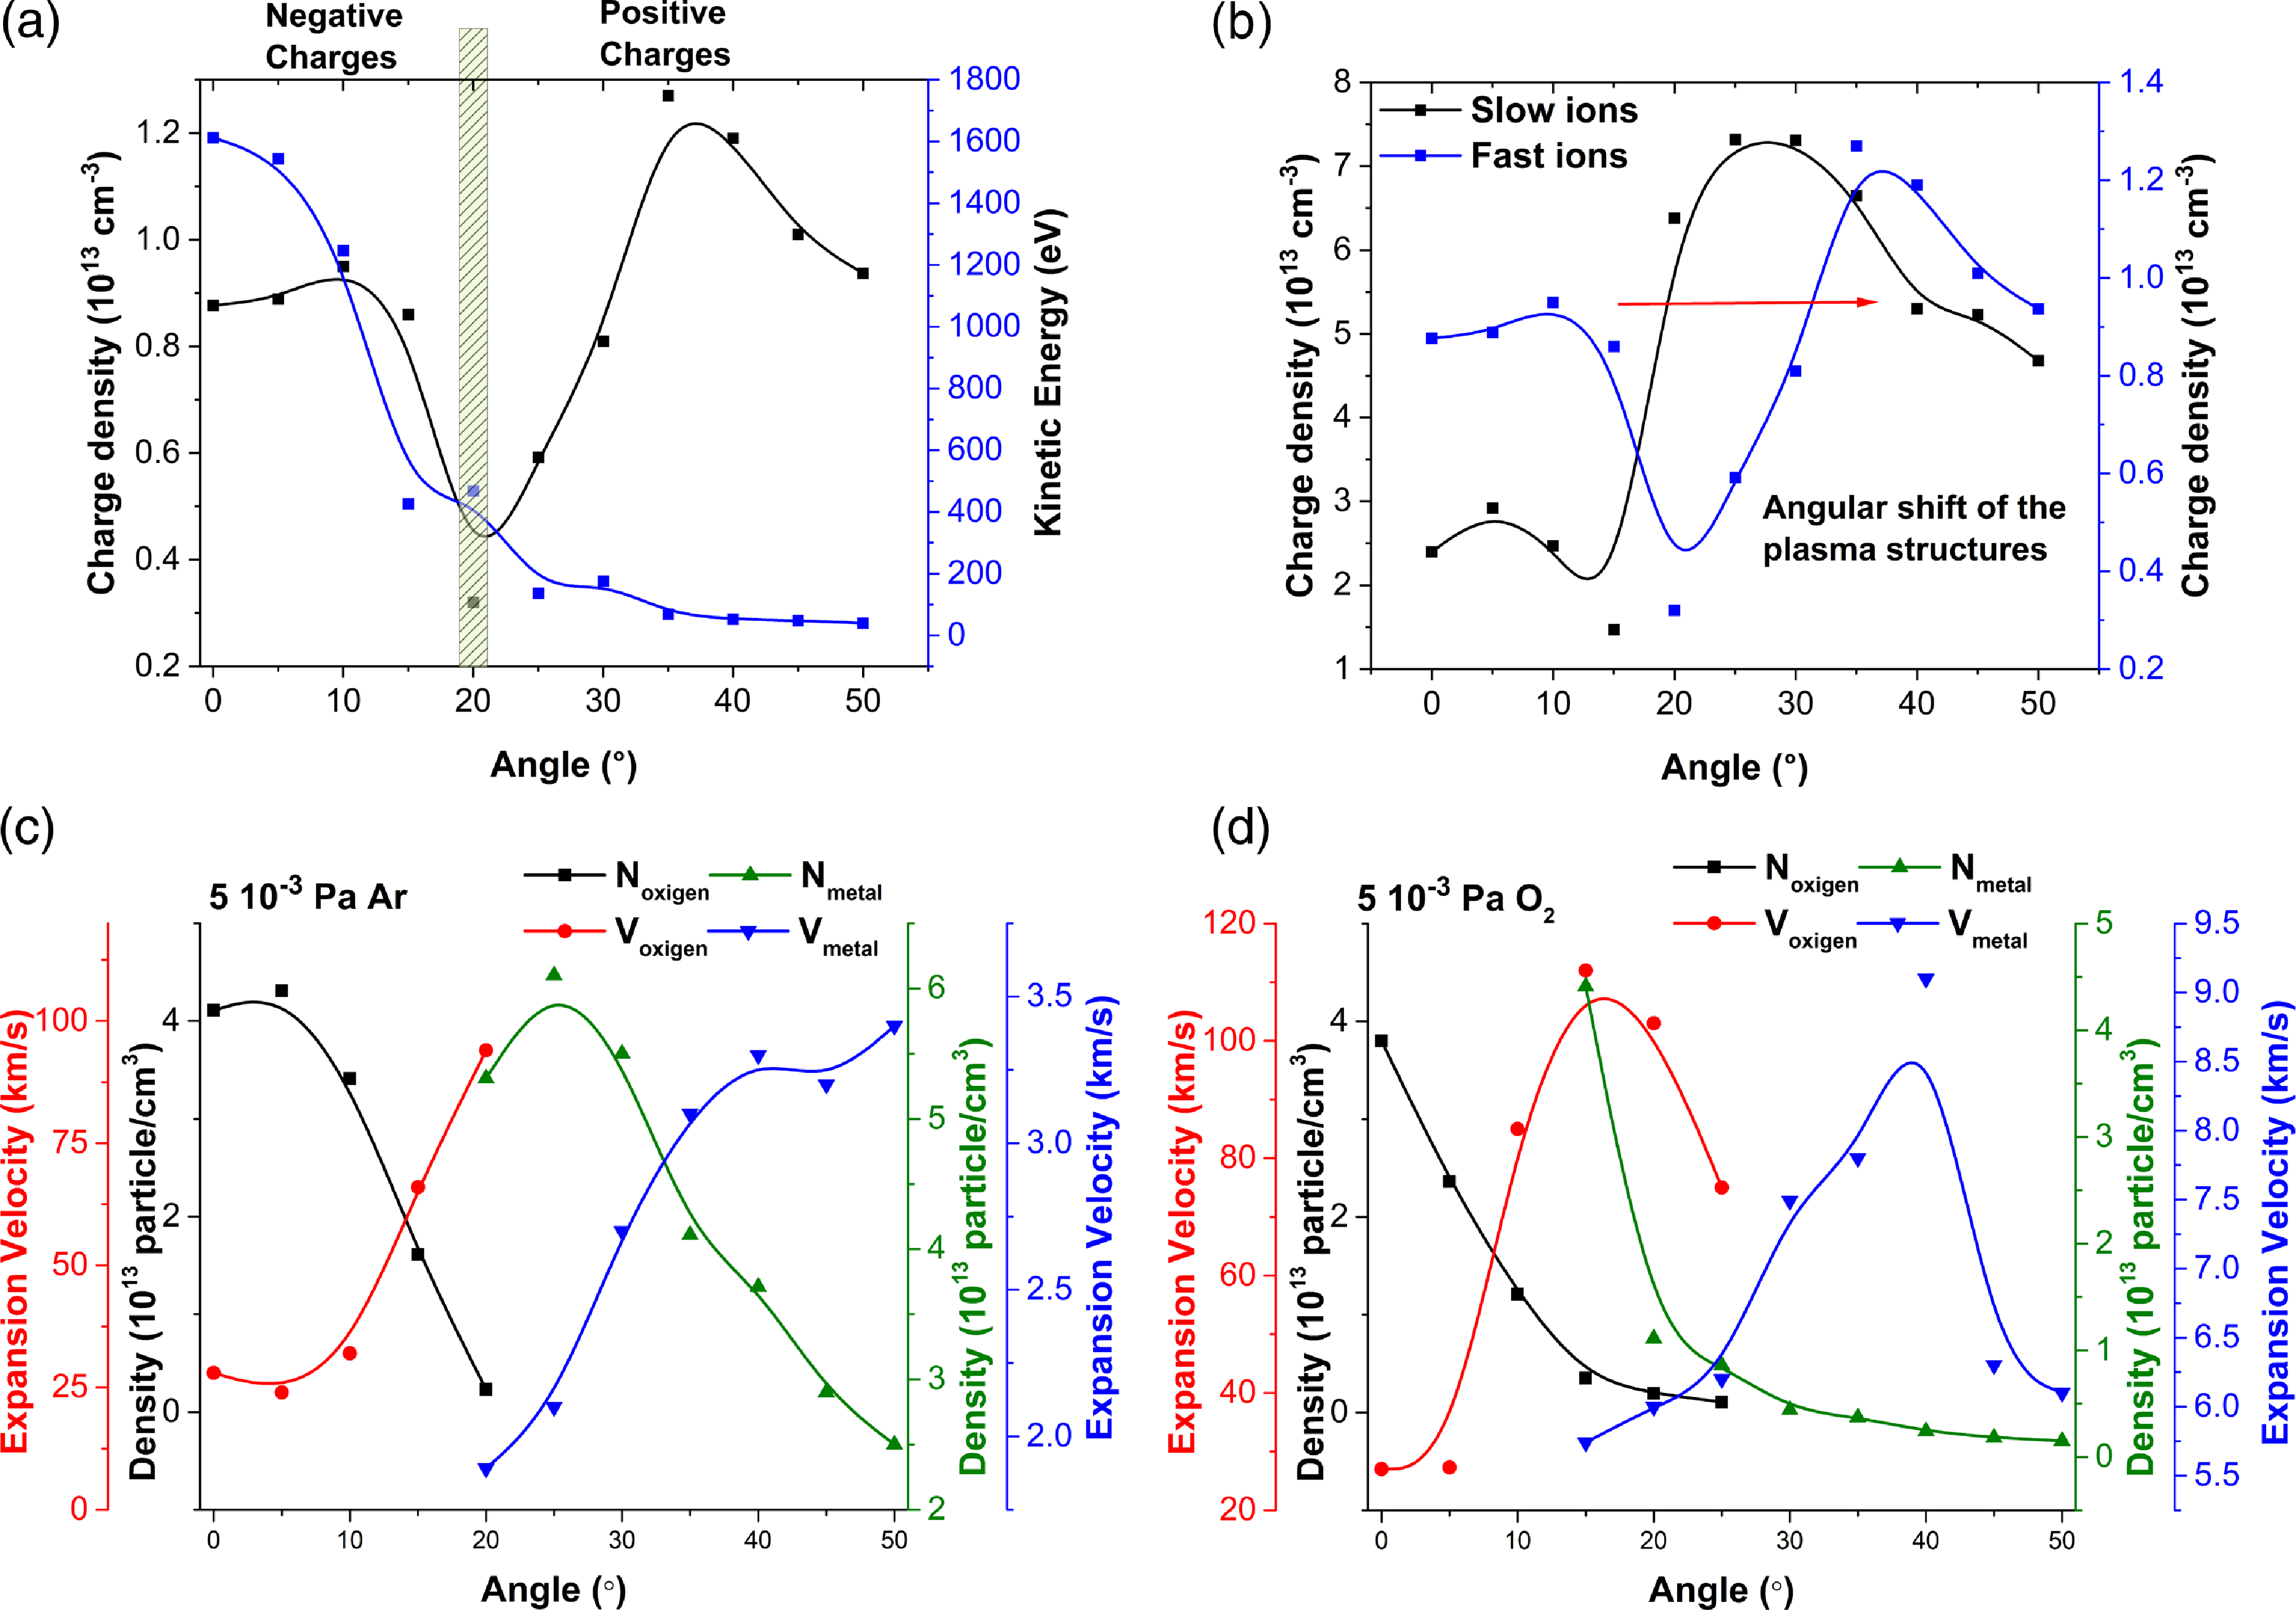
Figure 3. (a) Angular evolution of the particle density and kinetic energy of the high-energy plasma ions for 10–5 Pa; (b) the angular shift plasma structures; and (c) the dependence of the positively and negatively charged particle densities and their respective expansion velocities on the measurement angle for 5 $\times$
10−3 Pa Ar and (d) 5
$\times$
10−3 Pa Ar and (d) 5 $\times$
10−3 Pa O2.
$\times$
10−3 Pa O2.
Based on our previous results and on the correlation between the arrival time and the atomic mass of the plasma components, each peak in the charged particle temporal traces (figure 2) corresponds to a specific species from the plasma. Therefore, the fastest negative peak corresponds to the electrons in the plasma, the second negative peak corresponds to the oxygen species and the positive peak corresponds to the Ni species (Irimiciuc et al. Reference Irimiciuc, Chertopalov, Novotný, Craciun, Lancok and Agop2022a
). Figure 4(a–c) shows the impact of the gas atmosphere on the kinetics of each plasma component. The addition of Ar under vacuum conditions up to 10 Pa causes a decrease in the density peak attributed to the electron from 1.6 keV down to 5 eV following a linear trend ( $ E_{kin}\,=\,a+b\cdot \mathrm{ln}P)$
function with two slopes for different pressure ranges (<2 Pa, b = −120; >2 Pa, b = −412). The oxygen species follow a similar pattern, decreasing from 135 eV to 1 eV, with a local maximum at 2 Pa, which is in line with the data from mass spectrometry measurements (Yao et al. Reference Yao, Schneider, Bulgakova, Bulgakov and Lippert2023). A similar maximum is observed in the evolution of the Ni+ kinetic energy, which slightly increases up to 2 Pa, reaching 10 eV, followed by a decrease to 0.03 eV at 10 Pa. The values found for the Ni+ are lower than those reported for the LPP of pure Ni samples, where they can reach 180 eV (Castaño et al. Reference Castaño, Ecija, Apiñániz, Martínez, Basterretxea, Longarte, Redondo and Sánchez Rayo2010). The effect of N2 on NiO dynamics is represented in figure 4(b). The electron-attributed peak follows a linear decrease defined by two slopes (<2 Pa, b = −46.3; >2 Pa, b = −226.3) down to 332 eV at 10 Pa. The O– attributed peak increases up to 0.5 Pa, where the ions reach 611 eV, followed by a steep decrease to 25 eV. The Ni+ kinetic energy reaches a maximum at the same pressure, with significantly lower values ranging from 1 to 5 eV.
$ E_{kin}\,=\,a+b\cdot \mathrm{ln}P)$
function with two slopes for different pressure ranges (<2 Pa, b = −120; >2 Pa, b = −412). The oxygen species follow a similar pattern, decreasing from 135 eV to 1 eV, with a local maximum at 2 Pa, which is in line with the data from mass spectrometry measurements (Yao et al. Reference Yao, Schneider, Bulgakova, Bulgakov and Lippert2023). A similar maximum is observed in the evolution of the Ni+ kinetic energy, which slightly increases up to 2 Pa, reaching 10 eV, followed by a decrease to 0.03 eV at 10 Pa. The values found for the Ni+ are lower than those reported for the LPP of pure Ni samples, where they can reach 180 eV (Castaño et al. Reference Castaño, Ecija, Apiñániz, Martínez, Basterretxea, Longarte, Redondo and Sánchez Rayo2010). The effect of N2 on NiO dynamics is represented in figure 4(b). The electron-attributed peak follows a linear decrease defined by two slopes (<2 Pa, b = −46.3; >2 Pa, b = −226.3) down to 332 eV at 10 Pa. The O– attributed peak increases up to 0.5 Pa, where the ions reach 611 eV, followed by a steep decrease to 25 eV. The Ni+ kinetic energy reaches a maximum at the same pressure, with significantly lower values ranging from 1 to 5 eV.
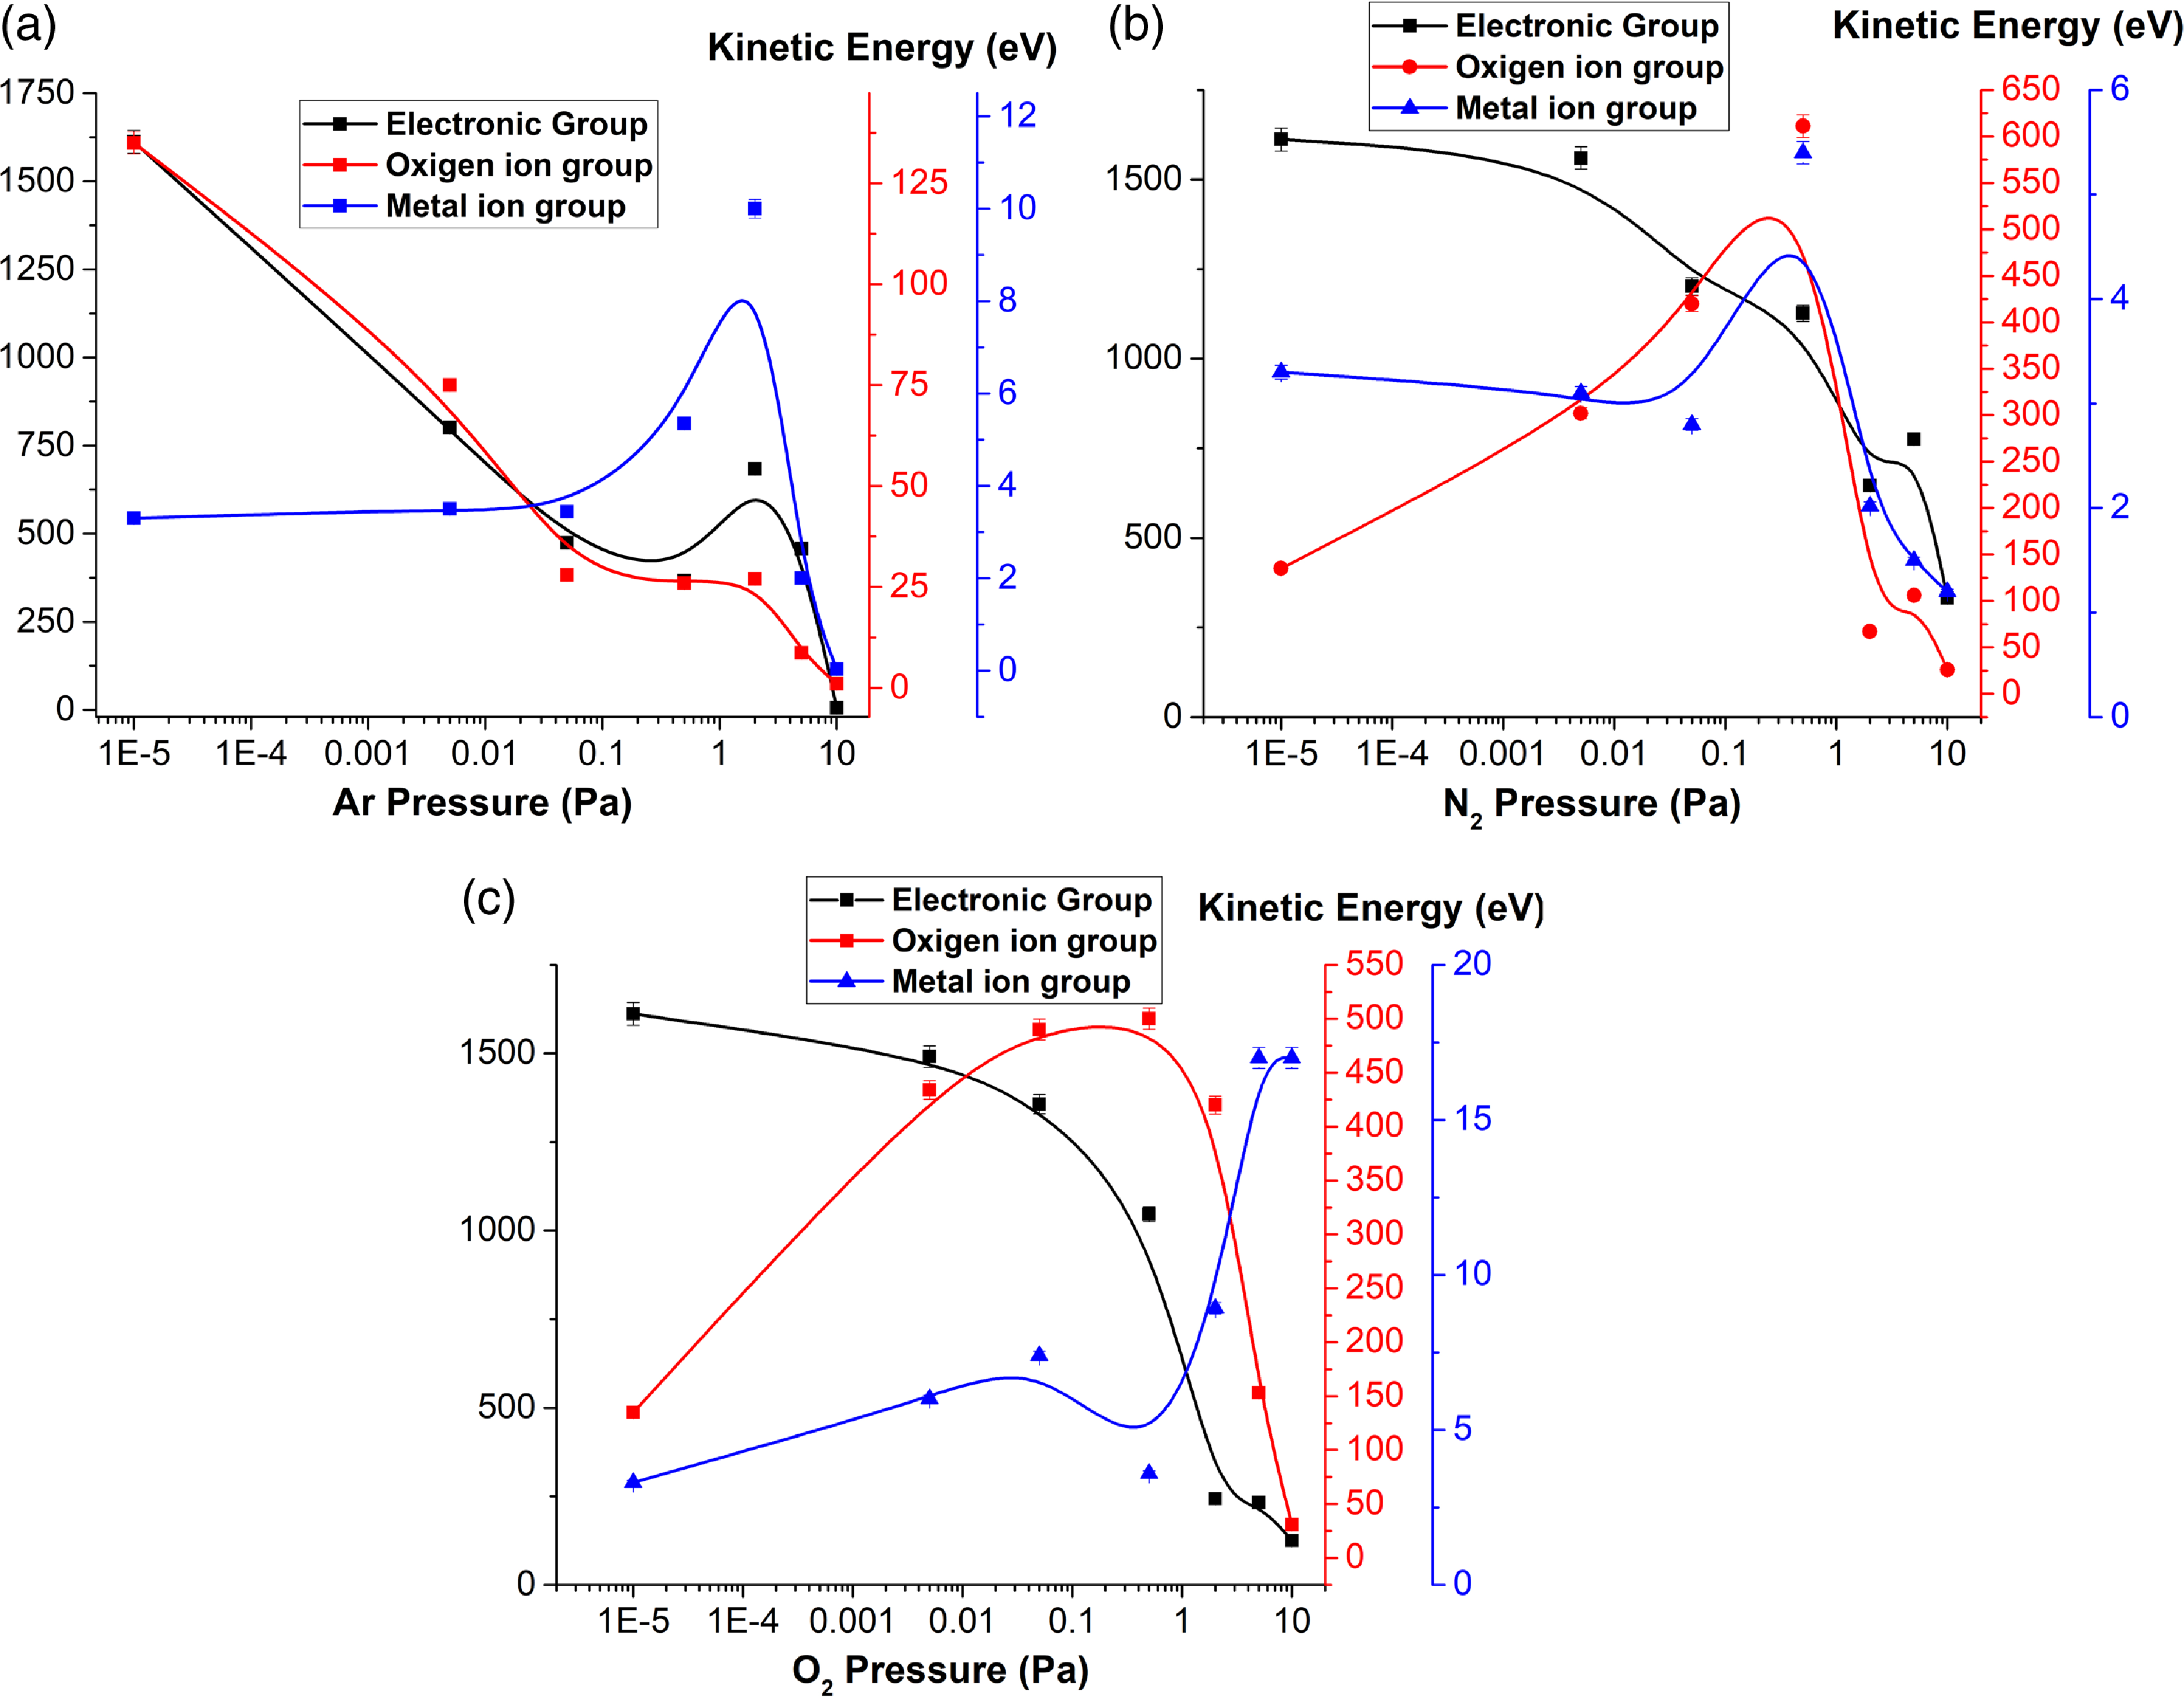
Figure 4. Influence of pressure on the kinetic energies of the main plasma components and the effect of pressure: (a) Ar; (b) N2; (c) O2.
The O2 atmosphere induces a similar dynamic as that observed in the N2 case. The electron-attributed peak follows a similar path (<2 Pa, b = −27.7; >2 Pa, b = −299.4), reaching a minimum of 125 eV. The O–-attributed peak is described by a slower increase, reaching a maximum of 500 eV at 0.5 Pa. The Ni+-attributed peak follows a quasiexponential increase with an inflection point at approximately 2 Pa, reaching a maximum of 17 eV at 10 Pa. These results are in good agreement with the dynamics of Ag plasma in an O2 atmosphere, where two similar slope behaviours were observed (Irimiciuc et al. Reference Irimiciuc, Chertopalov, Novotný, Craciun, Lancok and Agop2022a ). It is worth noting that in that case, the inflection point was attributed to the start of the gas phase chemical reaction in the plasma. Above 2 Pa, the background gas under our irradiation conditions becomes an active element of the dynamic ionisation and can potentially accelerate the front of the plasma.
By comparing the dynamic regimes in all three working atmosphere it can be concluded that in the N2 case, due to the high energy of the electrons (maximum of 1.6 keV), N+ are generated in front of the plasma, which accelerates the positive charges in the plasma; thus, O– ions have the highest energy compared with the Ar or O2 case. Additionally, the ionisation of O2 during expansion will accelerate Ni+ ions defining the highest kinetic energy regime for the metal ions. Overall, it is observed that 0.5–2 Pa represents a key pressure reange for NiO plasma dynamics, with important ramifications for PLD and kinetic control only via background gas. Starting from 0.5 Pa, the mean free path ranges between 2 cm and 3 cm (depending on the nature of the gas). By considering an average with the substrate distance of 5 cm, it implies that along the expansion, there will be one minimum collision between the plasma particles and the working atmosphere. Therefore, 0.5 Pa is the region where the plasma transitions from free expansion to the collision-dominated regime. This conclusion is supported by the steep decrease in the kinetic energy of all particles for pressures higher than 0.5 Pa. The obtained value is confirms our previous report (Irimiciuc et al. Reference Irimiciuc, Chertopalov, Novotný, Craciun, Lancok and Agop2022a ), where the transition was observed at approximately 2 Pa, a difference explained here by the additional O atoms ejected directly from the ceramic target.
3.2. Two-temperature dynamics
To further explore the dynamics of NiO plasma in various atmospheres, we implemented the time sweeping technique (Donnelly et al. Reference Donnelly, Lunney, Amoruso, Bruzzese, Wang and Ni2010b ; Esposito et al. Reference Esposito, Lippert, Schneider, Wokaun, Donnelly, Lunney, Tellez, Vadillo and Laserna2010; Irimiciuc et al. Reference Irimiciuc, Chertopalov, Lancok and Craciun2021) to reconstruct and compute several plasma parameters. The characteristic time series is shown in figure 5(a), where selected electron and ion temporal traces are represented for a range of probe biases between ± 20 V, with the inset containing a reconstructed I–V curve at 15 µs. Figure 5(b) shows the selected temporal evolution of the plasma potential (V p ) and electron temperature (T e ). T e steeply decreases below 1 µs, followed by an increase that reaches a first maximum of 3 eV at 6 µs and a subsequent maximum of 1.5 eV at 10 µs. The plasma potential has a modulated evolution similar to that for temperatures ranging from 1 V to 3.6 V. Due to the complicated temporal evolution, when attempting to analyse the pressure effect on T e , the relevance of the time window sampled by the technique needs to be addressed. Figure 5(c) shows the pressure impact on T e for various time windows. The T e values range from 0.5 to 3.5 eV, depending on the Ar pressure and the time window selected. For values below 1 µs, the temperature evolution is similar to the Ni+ ion evolution seen in figure 4(a), with a maximum at 2 Pa. Therefore, in this temporal regime, the energy of the plasma is still dictated by the drift of the ion and by electron–ion interactions. At later time windows, above 1 µs, we observe a similar dynamic as that described by the electron kinetic energy, which implies that at longer times, the value of T e is dominated by the thermal movement of the electrons (electron–electron interactions). The global effect of the pressure over the complete 30 µs sampled for this study is presented in figure 5(d). The multi-peak structure is observed for all investigated pressures, and it becomes more pronounced at high pressures above 2 Pa. This means that the temperature modulation in time is a collision-induced separation and that the presence of background induced a separation in terms of the thermal energy of the plasma during expansion. Similar behaviours were also observed for O2 and N2 atmospheres, with slightly higher temperature values found in the O2 case (0.3–4.6 eV, reached at 0.4 µs). Overall, the T e evolution allows for the optimum NiO formation within the plasma volume as a gas phase reaction in a region of 1–12 µs (where for all gases, the temperature was generally above 2.5 eV), with no dissociation of the molecule due to thermal interactions with the electrons.
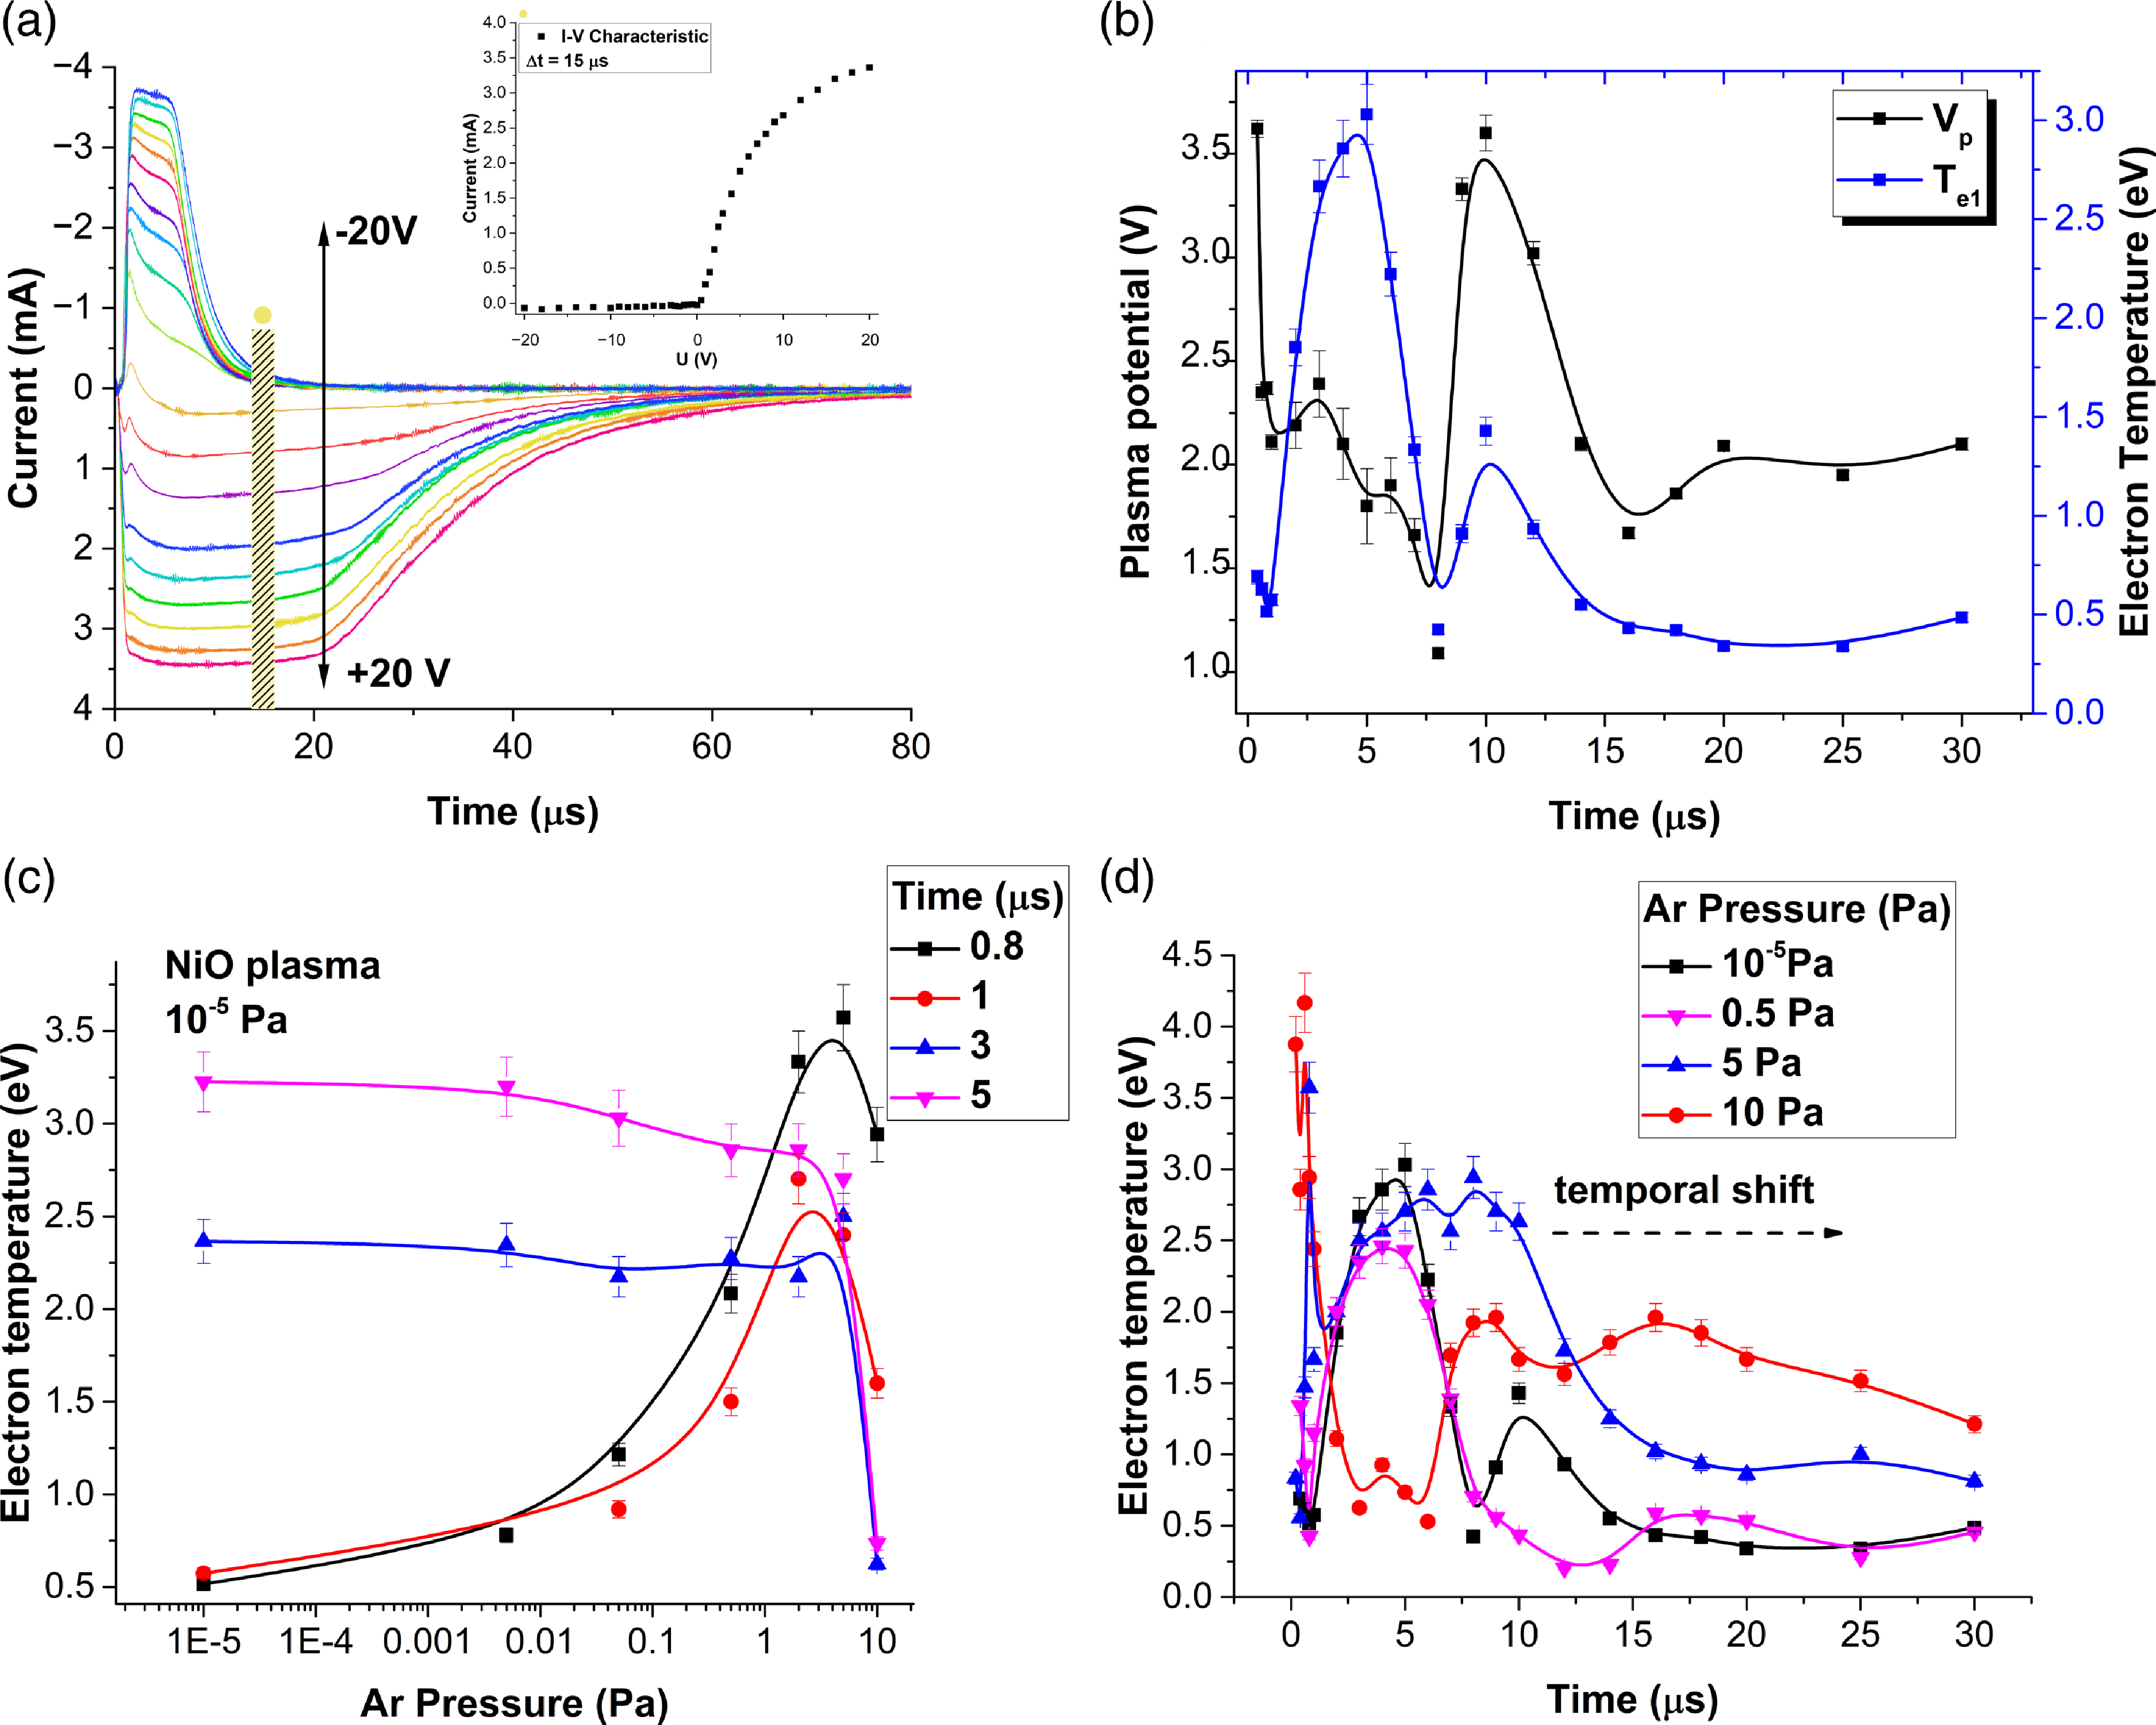
Figure 5. (a) Temporal traces characteristic of charges collected at a wide range of biases (± 20 V, only ± 10 V shown here); (b) the temporal evolution of the temperature and the plasma potential; (c) the effect of pressure on the temporal evolution of electron temperature; and (d) correlations between the measurement time and the working pressure.
To investigate whether the temporal modulation of the plasma is correlated with the splitting of the plasma core into multiple structures, we analysed the $\mathrm{ln}(I_{e})\,=\, f(U)$
representation in figure 6(a), following the approach proposed by Chen (Reference Chen2001) and removing the contribution from both negative and positive ions. There are two clear slopes in the logarithmic representation of I
e
, which is a clear indication of a two-temperature distribution within the plasma plume (Te
1
and Te
2
in figure 6(a)). This means that as the plume expands, there is splitting into two secondary plasma structures with different T
e
and V
p
characteristics. With respect to plume separation, previous reports (Harilal et al. Reference Harilal, Bindhu, Tillack, Najmabadi and Gaeris2002; Wu et al. Reference Wu, Li, Wei, Jia and Qiu2013; Focsa et al. Reference Focsa, Gurlui, Nica, Agop and Ziskind2017; Volkov Reference Volkov2021) have shown that separation into two or three structures is a hydrodynamic process induced by the kinetic separation of the particle, which expands with different velocities and is correlated with the different ablation mechanisms present during the nanosecond irradiation regime (Volkov Reference Volkov2021). The two-temperature distribution of ln(I
e
) actually shows that separation occurs at a fundamental level, generating two different plasmas. When separation occurs, the difference in temperature and potential will generate a double layer that will separate the structures. The dimension of the double layer is generally correlated with the Debye length, and in the vacuum expansion case, it is several hundred micrometres. Across this double layer, electrons and ions can be accelerated and transferred from one plasma structure.
$\mathrm{ln}(I_{e})\,=\, f(U)$
representation in figure 6(a), following the approach proposed by Chen (Reference Chen2001) and removing the contribution from both negative and positive ions. There are two clear slopes in the logarithmic representation of I
e
, which is a clear indication of a two-temperature distribution within the plasma plume (Te
1
and Te
2
in figure 6(a)). This means that as the plume expands, there is splitting into two secondary plasma structures with different T
e
and V
p
characteristics. With respect to plume separation, previous reports (Harilal et al. Reference Harilal, Bindhu, Tillack, Najmabadi and Gaeris2002; Wu et al. Reference Wu, Li, Wei, Jia and Qiu2013; Focsa et al. Reference Focsa, Gurlui, Nica, Agop and Ziskind2017; Volkov Reference Volkov2021) have shown that separation into two or three structures is a hydrodynamic process induced by the kinetic separation of the particle, which expands with different velocities and is correlated with the different ablation mechanisms present during the nanosecond irradiation regime (Volkov Reference Volkov2021). The two-temperature distribution of ln(I
e
) actually shows that separation occurs at a fundamental level, generating two different plasmas. When separation occurs, the difference in temperature and potential will generate a double layer that will separate the structures. The dimension of the double layer is generally correlated with the Debye length, and in the vacuum expansion case, it is several hundred micrometres. Across this double layer, electrons and ions can be accelerated and transferred from one plasma structure.
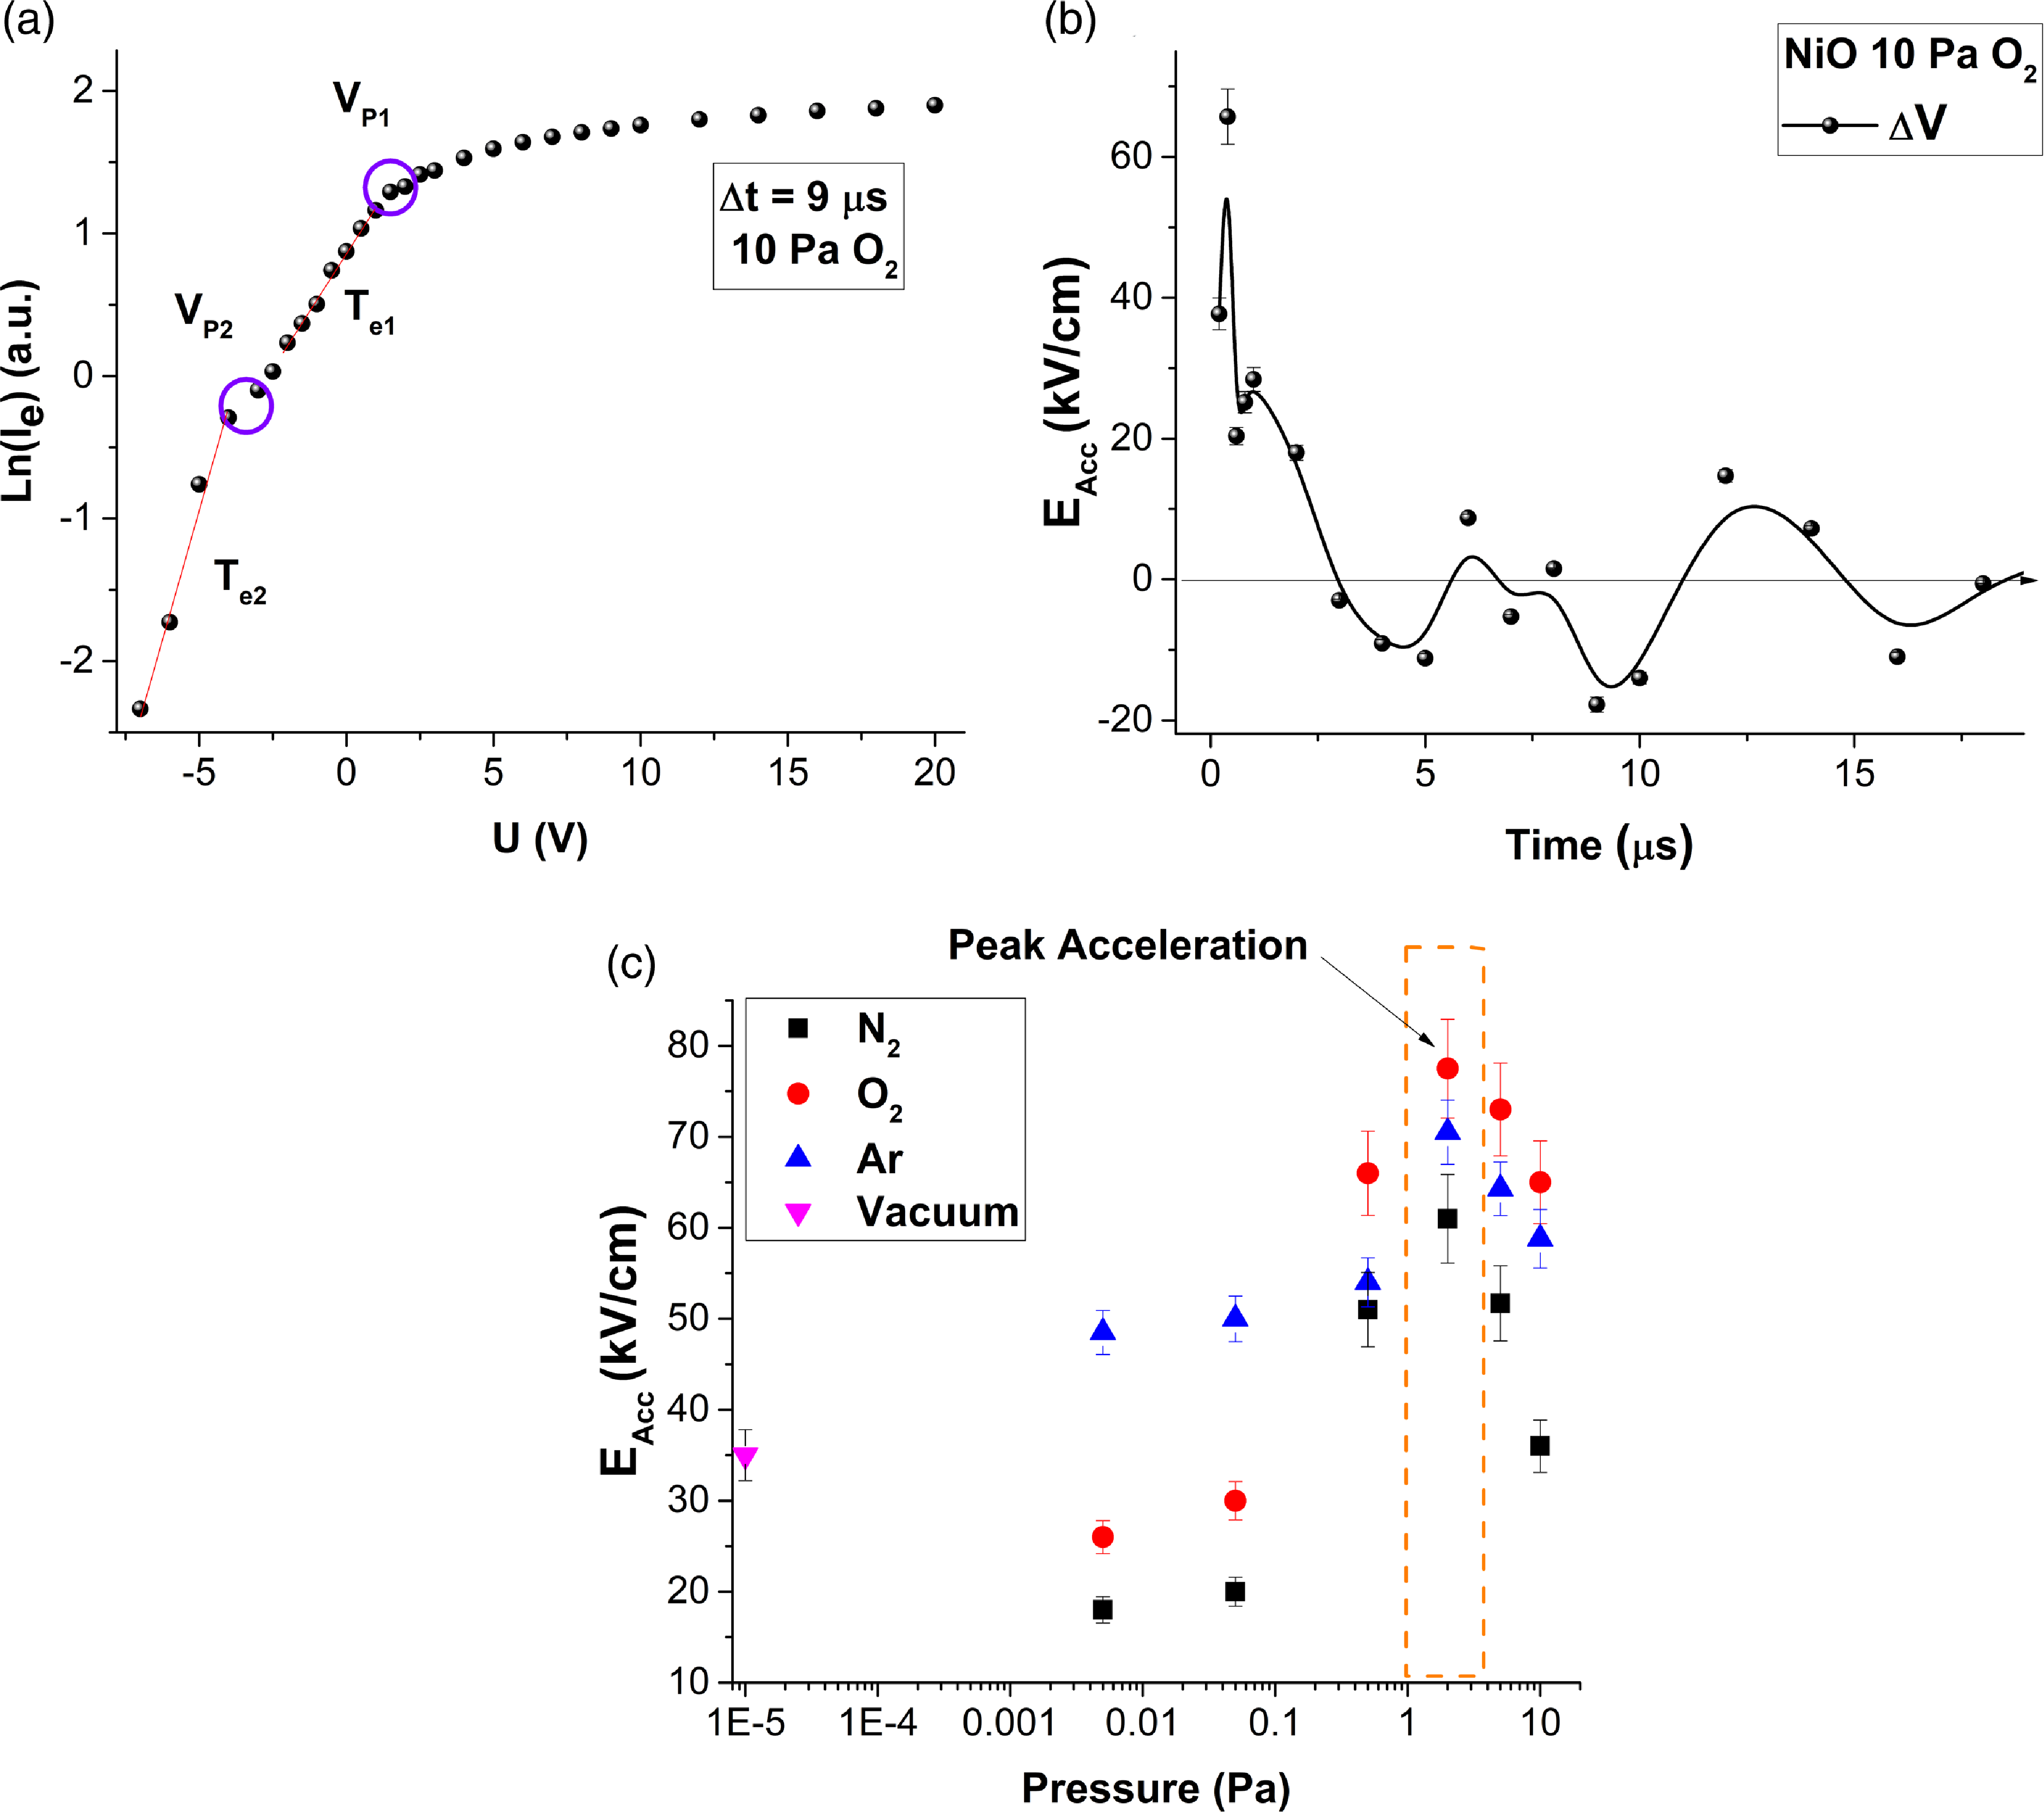
Figure 6. (a) Logarithmic representation of the I–V curve for a NiO plasma at 10 Pa; (b) temporal evolution of the acceleration field; and (c) acceleration field dependence on the nature of the gas (lines are visual guides).
The acceleration potential (E Acc) evolution over time is presented in figure 6(b). The acceleration potential decreases from 65 kV cm−1 to 0 in the first 3 µs of expansion, followed by oscillation at approximately ± 15 kV cm−1. These values are a few orders of magnitude lower than the initial acceleration of ions induced by the electrostatic ablation mechanism. In the first moments of expansion, the negative ions are accelerated to compensate for the charge separation during the Coulomb explosion, followed by a constant exchange of particles, which occurs around this double layer structure. The effect of the nature of the background gas on the acceleration potential is presented in figure 6(c). The acceleration potential increases for pressures below 0.5–2 Pa. This means that the additional particles do not slow the plasma, but contribute to charge separation (Bulgakov & Bulgakova Reference Bulgakov and Bulgakova1999) and the enhancement of the accelerating field. The pressure range also coincides with mean free paths larger than the target-substrate distance. At higher pressures, neutralisation of the plasma occurs due to the increased number of collisions (Chen & Bogaerts Reference Chen and Bogaerts2005; Diwakar et al. Reference Diwakar, Harilal, Phillips and Hassanein2015; Liu et al. Reference Liu, Chen, Gao, Lin, Man, Sun and Li2016; Hussain et al. Reference Hussain, Gao, Li, Hao and Lin2017). The evolution of the E Acc is consistent with the evolution of the kinetic energies of the plasma components with an O2 atmosphere, providing the best acceleration conditions for the charges within the plasma volume.
Finally, the perturbative regime of the LP was investigated (figure 7 a,b). On this behaviour of the LP, our group has already published (Irimiciuc et al. Reference Irimiciuc, Chertopalov, Bulíř, Vondracek, Fekete, Jiricek, Novotný, Craciun and Lancok2022b ) that for pressures above 2 Pa, a fireball-like structure forms on the probe, leading to kHz oscillations overlapping the natural evolution of the current. Figure 7(a) shows the LP signal at 1.5 V, which indicates that the perturbance regime appears to be independent of the nature of the gas. However, when comparing the onset of these oscillations, it is observable that the perturbation is a feature of the slower core of the plasma, as they appear after 20 µs for O2, 38 µs for N2 and 46 µs for Ar. The nature of the gas also induces an increase in the amplitude for the O2 (120 µA) and N2 (78 µA) cases compared with that for the Ar case (44 µA). The oscillation frequency is constant in the full range of investigated pressures and is approximately 40 kHz, with differences below 2.5 % between the gases. These perturbations are ionic in nature as per their interpretation given by Dimitriu et al. (Reference Dimitriu, Irimiciuc, Popescu, Agop, Ionita and Schrittwieser2015), where these plasma structures have a strong ionic core, and the oscillations are the breaking and self-organisation of the double layer formed around the fireball.
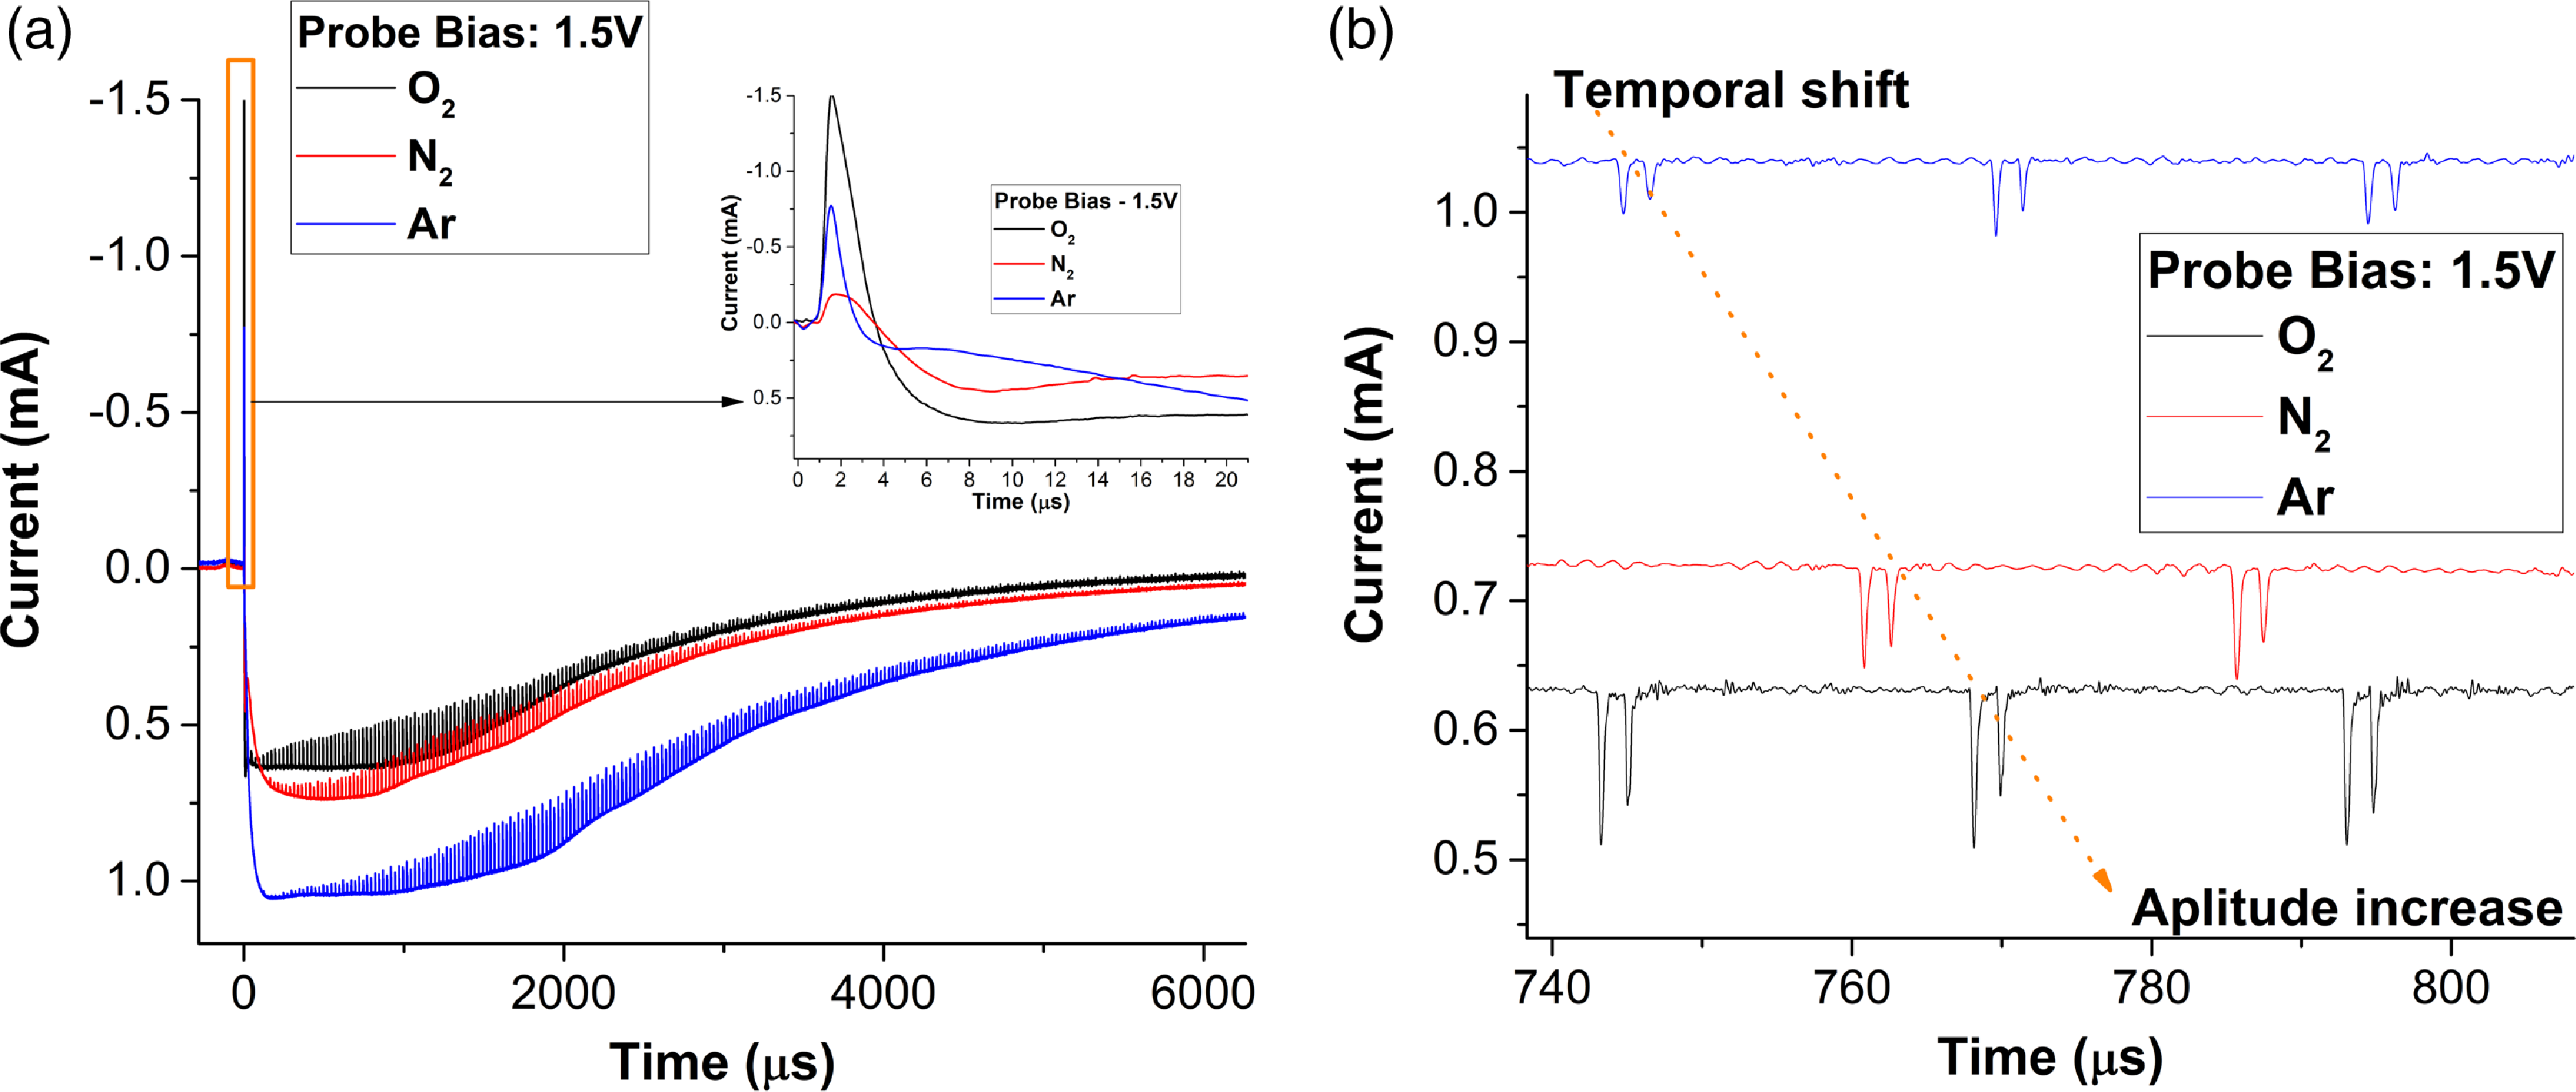
Figure 7. (a) Characteristic perturbative current traces for a probe bias of 1.5 V collected in 5 Pa of Ar, O2 and N2and (b) influence of the nature of the gas on the perturbative behaviour.
4. Conclusions
The structure and dynamics of NiO plasmas generated by ns-laser ablation in various atmospheres were investigated by angle- and time-resolved LP methods. Angle-resolved measurements revealed angular separation of the charges, with positive charges dominating the edges of the plasma. Selective separation leads to the formation of an acceleration region that separates ions based on their nature and ionisation state. The addition of O2 leads to a widening of the core plasma, pushing the positive charges to larger angles. An increase in the working pressure leads to an increase in the kinetic energy of the Ni+ and O– ions, with a maximum of approximately 0.5–2 Pa, while O2 allows for the continuous acceleration of metal ions regardless of the pressure. The time-resolved analysis revealed a multipeak evolution of the temperature, which widened and then shifted with increasing pressure. The electron temperature has two dependencies on the pressure, based on the region in time sampled with the technique. A maximum of approximately 2 Pa is observed for the short moments of time, while for later times, an inflection point in a logarithm decrease is observed around the same pressure point.
Evidence of two temperature structures for the NiO LPP is observed, and the estimation of the accelerating field generated between the two plasma structures reveals selective ion acceleration in the first microsecond followed by alternative dynamics around the double layer. The acceleration field has a maximum for an O2 atmosphere at approximately 2 Pa, which shows the separation between drift-dominated kinetics and thermal/reaction-based dynamics. Further investigation in this 2 Pa region revealed the appearance of a perturbation consistent with the formation of a plasma fireball on the probe. The dynamics of these perturbations is affected by the different incubation times of the gas, while the gas remains ionic with oscillations in the same range as the plasma–ion oscillation frequencies.
Acknowledgements
Editor Louise Willingale thanks the referees for their advice in evaluating this article.
Funding
This work was supported by the Romanian Ministry of Education and Research (grant number 30 N/2023 and 18ROMD/20.05.2024) and by SPS G6153 grant. This work was supported by the European Union and the Czech Ministry of Education, Youth and Sports (project: MSCA Fellowships CZ FZU II - CZ.02.01.01/00/22_010/0008124).
Data availability statement
The data that support the findings of this study are available on request from the corresponding author.
Author contributions
S.A.I. developed the concept of the work, S.C. and S.A.I. performed the experiments and data acquisition. All authors contributed equally to analysing data and reaching conclusions, and in writing the paper.
Declaration of interests
The authors report no conflict of interest.


 Open access