


1. Introduction
Protest is considered a key indicator of political conflict and constitutes a widely used expression of unconventional political participation (Della Porta and Diani, Reference Della Porta and Diani2006). Given its importance to understand social and political dynamics, a “science to study protest” (Fisher et al., Reference Fisher, Andrews, Caren, Chenoweth, Heaney, Leung, Perkins and Pressman2019) has emerged in the last decades. While the field of social movement and protest research is characterized by methodological pluralism (della Porta, Reference Della Porta2014), the analysis of protest events constitutes the core method to understand the temporal and spatial development of protests. It has been widely used for empirical analysis and theory building on social movements and contentious politics (Tilly, Reference Tilly1978; McAdam et al., Reference McAdam, McCarthy, Olzak and Soule2009; Kriesi et al., Reference Kriesi, Grande, Dolezal, Heibling, Höglinger, Hutter and Wüest2012) including in recent episodes of contention (Shuman et al., Reference Shuman, Hasan-Aslih, Van Zomeren, Saguy and Halperin2022).
Protest event data are usually compiled from newspaper reports or other textual sources, and so far relied on the time- and resource-intensive manual annotation of these sources according to a predefined codebook. As a result, only few larger protest event data sets exist, limiting the method’s potential to be applied to the multiple and dynamically unfolding crises of our time.Footnote 1 With growing computing power and the development of advanced natural language processing (NLP) methods, several attempts have been made to automate the creation of protest event data (Hanna, Reference Hanna2017; Fisher et al., Reference Fisher, Andrews, Caren, Chenoweth, Heaney, Leung, Perkins and Pressman2019; Lorenzini et al., Reference Lorenzini, Kriesi, Makarov and Wüest2022). Currently, the automated identification of protest events and political event data more broadly reaches levels of accuracy comparable to humans. But the automated coding of event characteristics (such as protest claims and forms of action) still remains a research frontier. Scholars have pointed to the weaknesses of existing fully automated event databases such as Global Data on Events Language and Tone (GDELT) (Hoffmann et al., Reference Hoffmann, Santos, Neumayer and Mercea2022) and concluded that the automated “collection of political event data has not accomplished a high degree of reliability or advanced beyond English language sources” (Fisher et al., Reference Fisher, Andrews, Caren, Chenoweth, Heaney, Leung, Perkins and Pressman2019, p. 3).
In this article, we present major advances regarding these shortcomings. We combine selected classifiers based on fine-tuned large language models (LLMs) and present a first fully automatic pipeline for the creation of protest event data sets that turns a set of German newspaper articles containing protest-related keywords into a reliable data set of protest events. We call this pipeline PAPEA, Pipeline for the Automation of Protest Event Analysis. All steps in the pipeline use publicly available models and tools. PAPEA thus can be easily adapted and extended. With PAPEA, we join ongoing efforts to automate PEA data collection and classification (Duruşan et al., Reference Duruşan, Hürriyetoğlu, Yörük, Mutlu, Yoltar, Gürel and Comin2022; Lorenzini et al., Reference Lorenzini, Kriesi, Makarov and Wüest2022; Caren et al., Reference Caren, Andrews and Ray2023; Oliver et al., Reference Oliver, Hanna and Lim2023) and provide a first fully documented and adaptable pipeline for this task that can reduce annotation time by several orders of magnitude.
In the following, we will first briefly present the development of PEA automation attempts and discuss the contributions and shortcomings of existing approaches. We will then present PAPEA’s overall architecture and discuss each step in the pipeline in detail. Subsequently, we illustrate its potential on a large data set of local newspaper articles. We wrap up this article with a discussion of remaining challenges and necessary steps to extend PAPEA to automatically extract an even larger set of PEA variables and some thoughts on how to increase precision for infrequent categories.
The pipeline that we present fulfills a specific objective—the analysis of protest events. Yet, the individual steps of the pipeline depicted in Figure 1 correspond to much more general problems that are relevant for a broader set of text analysis tasks concerned with action forms and positions of political actors. An application outside protest event analysis would require different fine-tuned models, but the overall architecture of the pipeline could well be adapted. We will discuss this in more detail in Section 5.
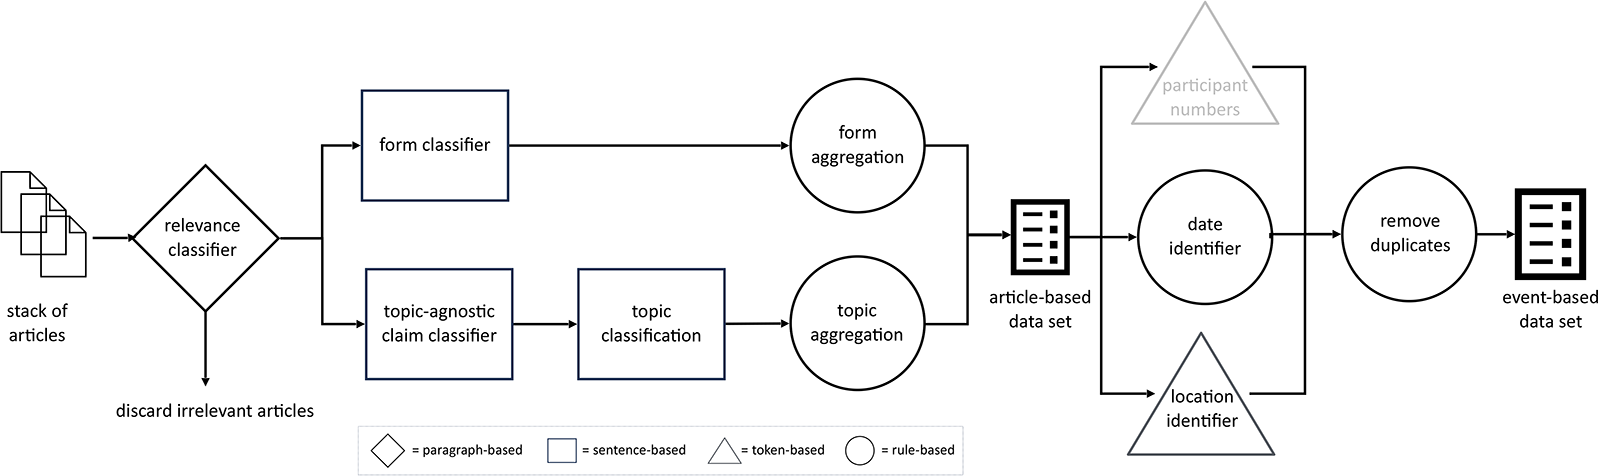
Figure 1. The complete pipeline.
2. From manual annotation to automation: Advances and current frontiers
Due to its prominence in the canon of social movement methodology, the genealogy of protest event research is well documented (Hutter, Reference Hutter and Della Porta2014; Hanna, Reference Hanna2017; Fisher et al., Reference Fisher, Andrews, Caren, Chenoweth, Heaney, Leung, Perkins and Pressman2019). Pioneering work was done by Charles Tilly, who engaged in standardized event coding from the 1960s (Fisher et al., Reference Fisher, Andrews, Caren, Chenoweth, Heaney, Leung, Perkins and Pressman2019). Since then, countless projects have applied the method contributing significantly to theory building in social movement studies and political sociology more broadly. Prominent examples include the Dynamics of Collective Action (DCA) project (McAdam et al., Reference McAdam, McCarthy, Olzak and Soule2009) in the United States and the New Social Movements project, extending protest event analysis (PEA) to cross-country comparative analysis in Europe (Kriesi et al., Reference Kriesi, Koopmans, Duyvendak and Giugni1992). As a key indicator of political conflict, information on protest has also been collected as part of larger conflict event datasets, most prominently the Armed Conflict Location and Event Data Project (ACLED) (Raleigh, Reference Raleigh, Linke, Hegre and Karlsen2010). Yet, this dataset is limited to political violence and one specific form of protest—demonstrations—ignoring broader repertoires of protest (e.g. petitions, vigils, occupations, and civil disobedience). Furthermore, the data set has shortcomings with respect to its initial focus on Africa and concerns regarding data quality (Eck, Reference Eck2012) as well as with respect to potential biases in regional coverage due to its source selection. This means ACLED cannot fully replace the more fine-grained protest event databases that currently are still manually annotated (e.g. PolDem; Kriesi et al., Reference Kriesi, Wüest, Lorenzini, Makarov, Enggist, Rothenhäusler, Kurer, Häusermann, Wangen, Altiparmakis, Borbáth, Bremer, Gessler, Hunger, Hutter, Schulte-Cloos and Wang2020). Olsen and her collaborators provide an overview over many of the currently existing PEA and conflict datasets and their methodological underpinnings (Olsen et al., Reference Olsen, Simon, Velldal, Øvrelid, Hürriyetoğlu, Tanev, Thapa and Uludoğan2024).
Until today, the bulk of research based on protest event data relies on the extraction of protest events from media reports in national newspapers, usually one per country. The focus on few (national) sources introduces a well-documented bias (Earl et al., Reference Earl, Martin, McCarthy and Soule2004), yet it was long indispensable given the labor-intensive data collection process. Fundamentally, protest event analysis combines “a discovery and coding problem” (Fisher et al., Reference Fisher, Andrews, Caren, Chenoweth, Heaney, Leung, Perkins and Pressman2019, p. 3), involving a “haystack task” (Hanna, Reference Hanna2017, p. 7) in which a small percentage of relevant articles must be selected from a large universe of reports, and a subsequent coding of key event variables. Illustrating the resources needed to exploit the full potential of PEA in long time series, Oliver et al. refer to the DCA project based on the manual reading and coding of protest events based on New York Times microfilm archives, which “involved four principal investigators and dozens of graduate students funded over a decade by a series of NSF grants at three institutions” (Oliver et al., Reference Oliver, Hanna and Lim2023, p. 2).
Against this background, the generation of event databases has become a dynamic context for the application of computational social science, most notably machine learning (Beieler et al., Reference Beieler, Brandt, Halterman, Schrodt, Simpson and Alvarez2016; Hanna, Reference Hanna2017; Zhang and Pan, Reference Zhang and Pan2019; Caselli et al., Reference Caselli, Mutlu, Basile and Hürriyetoğlu2021; Lorenzini et al., Reference Lorenzini, Kriesi, Makarov and Wüest2022). While the automation of event data collection has proliferated “with declining costs of computational power” (Wiedemann et al., Reference Wiedemann, Dollbaum, Haunss, Daphi and Meier2022), the results are still mixed. So far, the few fully automated real-time event coding projects such as GDELT or Crisis Early Warning System (ICEWS), which also cover protests, remain confronted with serious validity and reliability issues (Wang et al., Reference Wang, Kennedy, Lazer and Ramakrishnan2016; Hoffmann et al., Reference Hoffmann, Santos, Neumayer and Mercea2022). However, parts of the workflow, notably the “haystack task” of identifying relevant articles, have been successfully automated. As argued by Wiedemann et al. in a recent overview of advances in the identification task (Wiedemann et al., Reference Wiedemann, Dollbaum, Haunss, Daphi and Meier2022), this step requires striking a tricky balance between recall and precision. By definition, increasing recall comes at the cost of decreasing precision. Since minimizing false negatives is usually considered the priority, a higher number of false positives need to be accepted and filtered out afterward (Croicu and Weidmann, Reference Croicu and Weidmann2015). For this, Zhang and Pan have applied a second-stage classifier concentrating on the elimination of false positives after an initial round of relevance classification (Zhang and Pan, Reference Zhang and Pan2019).
An alternative approach is improving the quality of the classifiers. In this regard, innovations in computational capacity have in recent years allowed the application of transformer-based neural networks. This approach does rely not only on the traditional unordered “bag-of-words” semantics but also on the structure and sequence of natural language (Wiedemann and Fedke, Reference Wiedemann, Fedke and Engel2021). Depending on the strategy used, the results in the relevance detection vary greatly. Hanna reports a maximum F2 score of 0.77 (Hanna, Reference Hanna2017). Croicu and Weidmann’s (Reference Croicu and Weidmann2015) combination of various bag-of-words approaches yields 0.90 recall and 0.58 precision. Zhang and Pan (Reference Zhang and Pan2019), who apply a recurrent neural network for the detection of protest events in social media, report highly satisfactory recall and precision scores of 0.96 and 0.95, respectively. Similarly, the BERT model applied by Hürriyetoglu et al. achieves an F1 score of 0.9 (Reference Hürriyetoğlu, Yörük, Yüret, Yoltar, Gürel, Duruşan, Mutlu, Yörük, Yüret, Yoltar, Duruşan and Mutlu2019). Despite these highly satisfactory scores, both Hürriyetoglu et al. (Reference Hürriyetoğlu, Yörük, Mutlu, Duruşan, Yoltar, Yüret and Gürel2021) and Zhang and Pan (Reference Zhang and Pan2019) document that the accuracy of their trained models significantly drops when applied out-of-sample. Despite these ongoing challenges, innovations in computational capacity and NLP modeling have led to a situation, in which an automation of the identification task reaches levels of accuracy comparable to humans, thereby reducing the need for human resources drastically.
Beyond the identification of relevant articles, however, various challenges remain in the automated coding of event characteristics. Hanna reports F1 scores ranging from 0.11 to 0.85 for protest forms, with only three forms surpassing a 0.5 threshold (Hanna, Reference Hanna2017, p. 23). Likewise, without detailing exact scores, the Count Love project notes that automated models “do not yet perform with sufficient recall and precision for fully automatic data entry” (Leung and Perkins, Reference Leung and Perkins2021). Due to unsatisfactory results in this more demanding task, various projects such as the Machine-learning Protest Event Data System (MPEDS; Hanna, Reference Hanna2017), POLCON (Lorenzini et al., Reference Lorenzini, Kriesi, Makarov and Wüest2022), and the Crowd Counting Consortium (CCC; Fisher et al., Reference Fisher, Andrews, Caren, Chenoweth, Heaney, Leung, Perkins and Pressman2019) continue to rely on a semi-automated process with event annotation primarily performed by human coders. At the same time, several teams of researchers concentrate on the improvement of automated annotation of key variables. A key initiative in this regard is the CASE (Challenges and Application of Automatic Extraction of Socio-political Events from News) series of workshops (Hürriyetoğlu et al., Reference Hürriyetoğlu, Yörük, Mutlu, Duruşan, Yoltar, Yüret and Gürel2021, Reference Hoffmann, Santos, Neumayer and Mercea2022, Reference Hürriyetoğlu, Tanev, Thapa and Uludoğan2024), which aims at the collaborative tackling of key shared tasks. The organizers of CASE are currently working on GLOCON, a fully automated data set of “contentious politics events” in Turkey, India, China, Argentina, and Brazil (Duruşan et al., Reference Duruşan, Hürriyetoğlu, Yörük, Mutlu, Yoltar, Gürel and Comin2022), of which technical details are not yet published. Beyond protest event data sets, BERT-based approaches include, for instance, the attempt to automatically identify 56 thematic categories in party manifestos, currently with F1 scores between 0.4 and 0.6 (Koh et al., Reference Koh, Boey and Béchara2021).
Building upon this state of the art, with PAPEA, we are contributing to the current research frontier of automated classification of protest events. In the remainder of this article, we detail the architecture and performance of our fully automated pipeline and apply it to a use case of German-language newspaper articles.
3. A modular pipeline for the automation of protest event analysis
PAPEA largely follows a workflow similar to creating a manually annotated protest event data set. The overall design of the pipeline is modular. Each module corresponds to one step in the pipeline and has a well-defined input and output. Technically, a module can contain anything from a few lines of code to a sequence of tasks. If alternative and potentially better methods for individual steps become available, they can be “plugged in” into the pipeline according to the respective research project’s needs, allowing for a high level of flexibility and adaptability.
Our current pipeline is able to identify and classify four core event variables: protest form, protest topic, place, and date of the protest. In addition, we have a module to distinguish between actual reports about past protests and articles announcing future protests. In Section 5 we report ideas on how to improve performance on place and date, as well as how to include modules on actors and numbers to the pipeline. Figure 1 illustrates the complete text processing pipeline. We start with a set of newspaper articles containing keywords related to protests. This keyword selection usually produces a high number of false positives because some indispensable keywords are polysemic (e.g. to demonstrate) or describe activities that sometimes but not always are a protest (e.g. march). The first step of reducing the original data set to only relevant articles is accomplished with a pre-trained sequence classifier. After reducing our stack of articles to only relevant ones, we identify and classify protest forms and topics in two parallel processing steps. For both tasks, we use sentence transformer models. After aggregating the results from both classification steps at the article level, we then run a token-based classifier to identify protest locations and a rule-based procedure for protest dates. After completion, we remove duplicate events and produce an event-based PEA dataset as the final output.
In the following section, we first briefly introduce the data set that was used to train and evaluate the various classifiers used in PAPEA, before discussing each step of the pipeline in detail. All Python and R scripts to run the pipeline as well as an example dataset are provided in the Online Appendix. The fine-tuned models are made available and documented at Huggingface.Footnote 2
3.1. The gold-standard data set for model training and evaluation
The classifiers were trained on a hand-annotated gold standard dataset of local protests in four German cities—Bremen, Dresden, Leipzig, and Stuttgart—between 2000 and 2020. The dataset draws on German-language local newspapers—one outlet for each city (Leipziger Volkszeitung, Sächsische Zeitung [for Dresden], Weser-Kurier [for Bremen], and Stuttgarter Zeitung). We used the first 2500 manually annotated articles to train our classifier for relevance detection described below, and, after successful implementation, used it for selecting relevant articles that were then manually annotated. A team of student assistants manually extracted date, protest form, issue, number of participants, and several other variables. Quality and consistency of annotation were ensured by (a) a closely supervised team of student assistants including a continuous discussion of unclear cases and (b) detailed annotation guidelines that were tested and improved after the first six city years (Bremen 2015–16, Dresden 2014, Leipzig 2015–16, and 2018) were coded. For this purpose, the project’s two PIs and two postdocs conducted a double annotation of 607 articles, checked for alignment, and adjusted annotation guidelines if necessary. Newspaper reports were annotated with the open-source web-based annotation software Inception (Klie et al., Reference Klie, Bugert, Boullosa, Eckart de Castilho and Gurevych2018).
3.2. Task 1: Selecting relevant documents
The first module selects articles that actually report about a protest. Following the long-term German protest data set Prodat (Rucht et al., Reference Rucht, Hocke and Ohlemacher1992, p. 4), we define protest as every collective, public action of non-state actors that expresses a societal or political demand. We thus include not only demonstrations but also strikes, petitions, performances, or collective acts of political violence. For our German language newspaper corpus, we initially select articles that contain at least one of the following keywordsFootnote 3: “protest, assembly, demonstr*, rally, campaign, social movement, squat, strike, petition, hate crime, unrest, riot, insurrection, boycott, activis*, resistance, mobilis*, citizens’ initiative” in all flexions.Footnote 4 This typically returns relevant and irrelevant articles at a ratio of about 1:10. To select relevant articles, we use the best-performing multilingual model described in Wiedemann et al. (Reference Wiedemann, Dollbaum, Haunss, Daphi and Meier2022)—a sequence classifier based on XLM-RoBERTa and fine-tuned with the gold standard dataset outlinedearlier. For the classification, it reduces the article text to only those sentences that contain one of the keywords plus the sentence before and after the respective keyword sentence (kwic + 1). Under optimal conditions, this classifier reaches an F1 score of 0.92, and even under the most adverse conditions, it yields an F1 score of 0.75 (Wiedemann et al., Reference Wiedemann, Dollbaum, Haunss, Daphi and Meier2022, p. 3389).
Figure 2 shows the distribution of the classifier’s predicted probabilities on an example dataset not used for training, documenting a bimodal probability distribution typical for such a binary classification task: at the left local maximum, the model is confident that the documents do not contain a report about protests and, while at the right local maximum, it is confident that the documents do report about a protest. Between the two local maxima, the frequency of true positives decreases and the frequency of false positives increases.
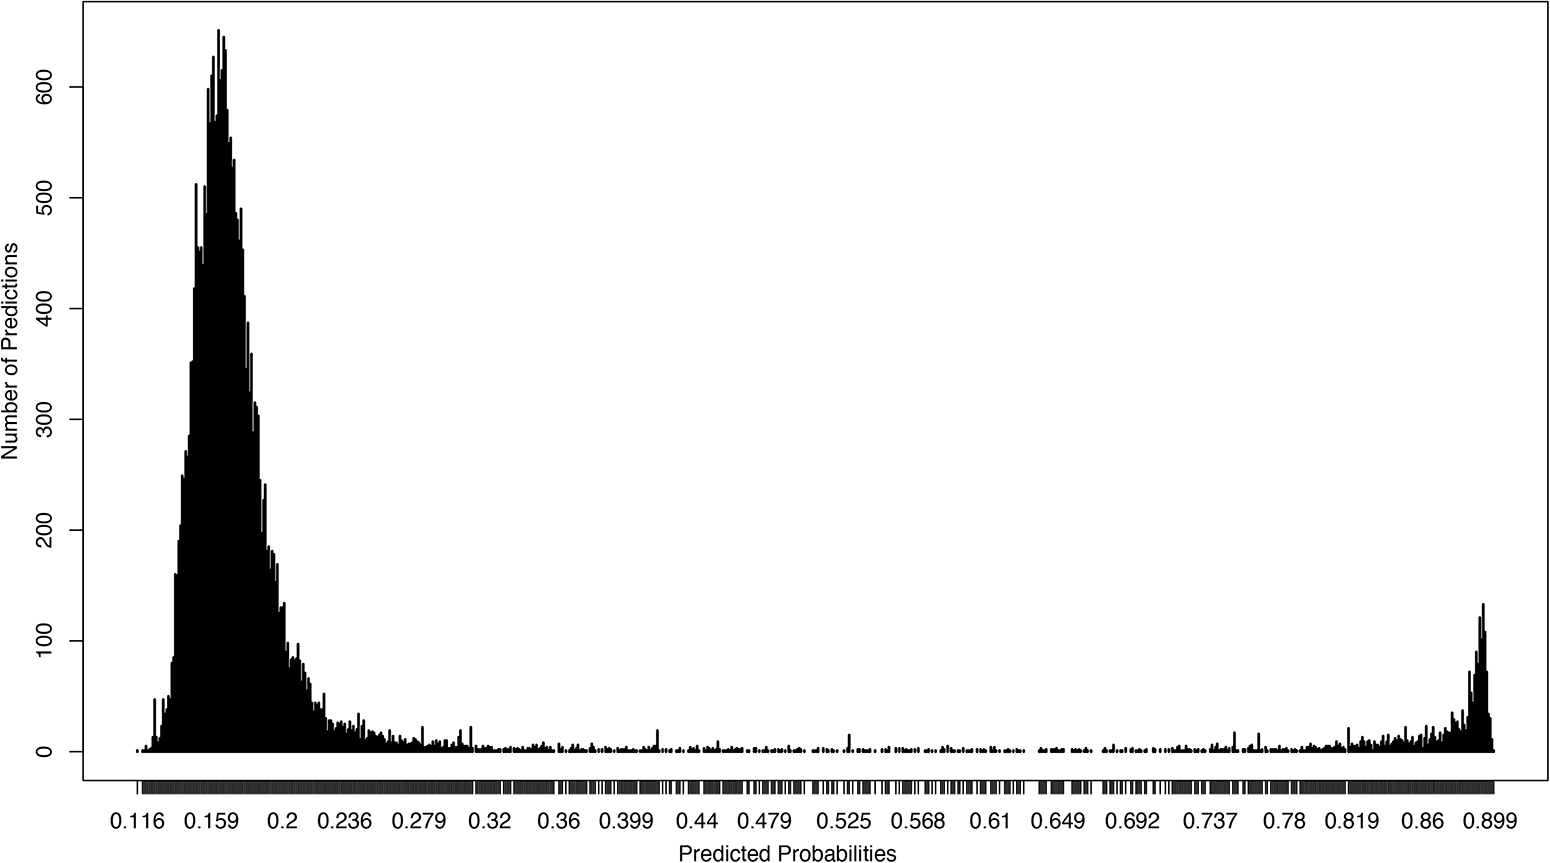
Figure 2. Relevance classification, distribution of predicted probabilities.
The specific character of the distribution allows us to maximize for recall or for precision by selecting a lower or higher cutoff point for including documents in the final selection.
3.3. Task 2: Classifying protest forms
The protest form identification is realized as a sentence classifier. Information about the form—a demonstration, a petition, a strike, a performance, or another of the overall 22 protest forms in our codebook (Table 1)—can usually be identified at the sentence level, without having to account for a broader context. Therefore, sentence transformer models are ideal for this task.
Table 1. Frequency of protest forms in the ProLoc data set
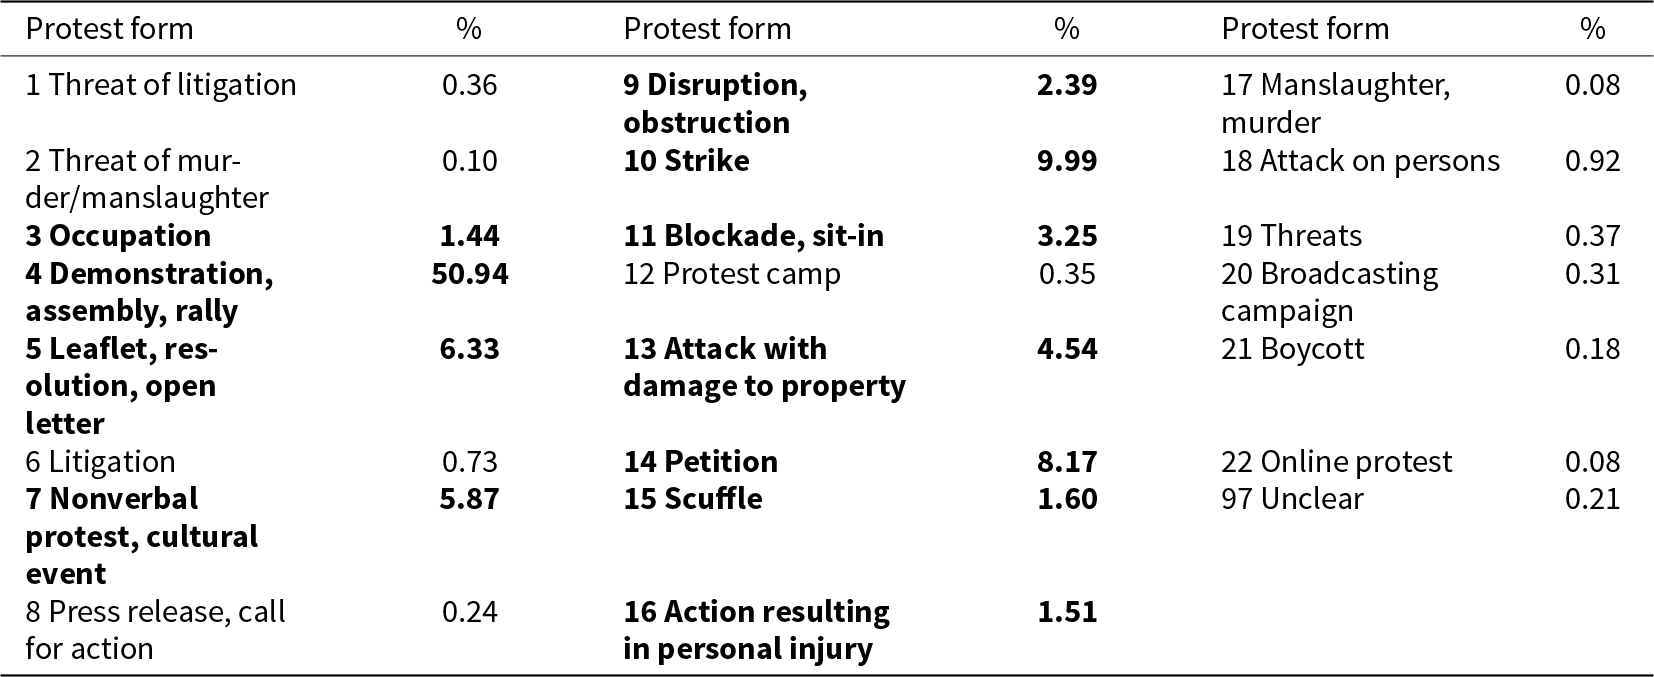
Table 1 lists the relative frequency of the different forms of protest in our gold standard data set documenting that only 11 forms (highlighted in bold) have a relative frequency of over 1%. Demonstrations make up more than 50% of the protests. Together with strikes, petitions, attacks with property damage, leaflets/open letters, nonverbal/performative protests, blockades, and obstructions, these eight forms make up more than 90% of all protests.
For the form classification task, we fine-tuned a multilingual sentence BERT model (paraphrase-multilingual-mpnet-base-v2; Reimers and Gurevych, Reference Reimers and Gurevych2019) with labeled sentences containing protest form information from the ProLoc data set (Wiedemann et al., Reference Wiedemann, Dollbaum, Haunss, Daphi and Meier2022; Daphi et al., Reference Daphi, Dollbaum, Haunss and Meier2024). In the training data, we included sentences with and without form information at a ratio of 1:2. In real-world data, the proportion of sentences containing form information is much smaller, but oversampling these sentences in the training data improves model performance. For fine-tuning, the dataset was split into a training and test set at the ratio 7:3, where half of the test set (15% of the labeled data) was used to improve model fit during training and the other half was used to evaluate the best fitting model. Sentences of the category “97 unclear” were deleted from the training data.
Table 2 documents the performance of the form classifier. The left side (Model evaluation) displays the performance of the model on the evaluation dataset during training. Generally, the model performs much better in the high-frequency classes where it reaches F1 scores up to 0.89 (and 0.94 for the no-form class). For the lower frequency classes, F1 scores vary between 0.1 and 0.61. The evaluation is performed at the sentence level, i.e. the numbers reflect the accuracy of predictions for each sentence in the articles in the train/test set. This most likely inflates prediction errors from false positives because it de facto measures how good the model replicates the manual annotation, and not whether the model may have found the correct protest form in another sentence in which it was not manually annotated.
Table 2. Evaluation of form prediction
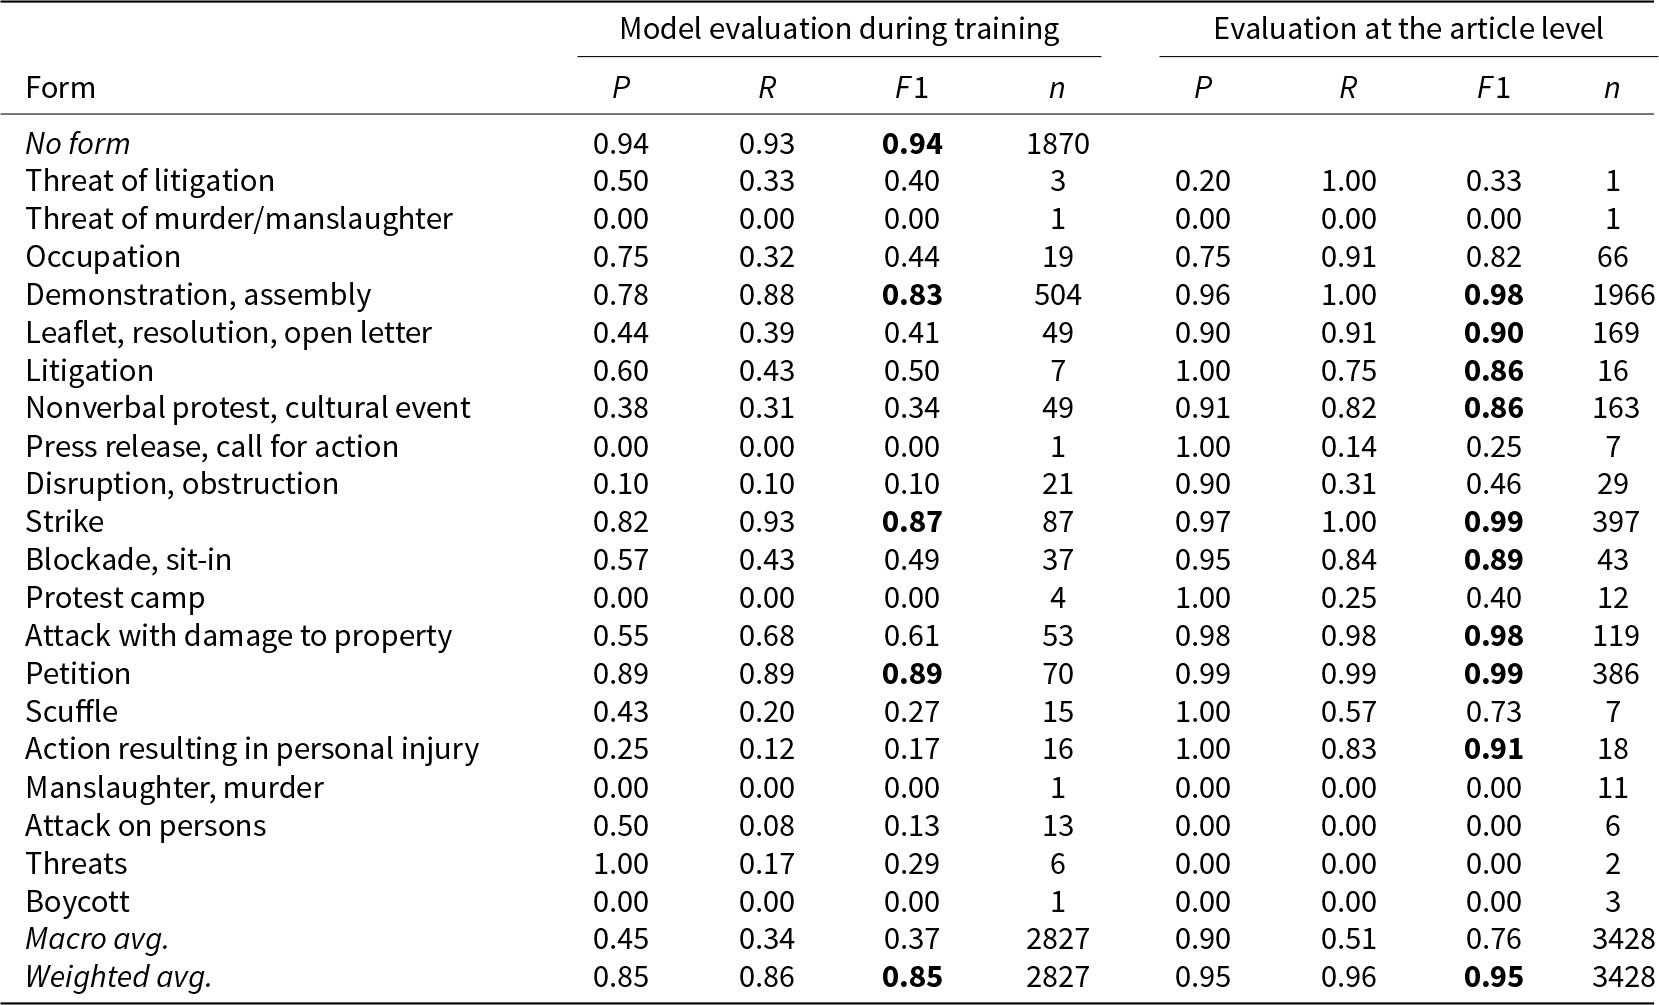
Note: Bold numbers indicate F1 scores where the model reaches or exceeds the average score of trained human annotators across all categories (see Table C1 in the Online Appendix).
On the right side of Table 2, we therefore evaluate the performance of the classifier at the article level based on an extended version of our ProLoc data set containing about 3400 annotated articles that were not part of the training data. In this case, we no longer measure whether every sentence is predicted correctly, but only whether the most often predicted protest form in each article actually corresponds to a protest form that was also annotated manually for this article. We thus account for the information redundancy in newspaper articles and also add a primitive form of error correction by keeping only the most frequently found form for each article.
As a result, for most categories, we receive highly satisfactory results, with a weighted average F1 score of 0.95. For the most frequent categories (demonstration, strike, and petition), we even get F1 scores of up to 0.99. Lower F1 scores are mostly driven by low recall values, while precision is usually very high, even for the infrequent categories. The model thus overlooks some protests with less frequent protest forms, but when it classifies a protest as one of the less frequent forms, this classification is in most cases correct. At the article level, the model performs very well for all categories where the training data contained more than 200 examples (i.e. more than 40 cases in the evaluation dataset reported as n in the left table of Table 2). Performance in lower frequency classes possibly depends on the semantic distinctiveness of the category.
There are some very low-frequency classes that the model never predicts. We assume that this may be the result of the very low prevalence of these protest forms in the training data, and will discuss options to improve prediction of low-frequency categories in Section 5.
3.4. Task 3: Classifying protest topics
Classification of protest topics is realized as a two-step process. The goal is to classify the protests into 24 topics according to the ProLoc codebook (see Online Appendix A). The categories represent an updated and compatible version of the topic categories in the Prodat codebook. After initial tests, we realized that classification on the full text of the articles either with transformer or with topic models does not perform sufficiently well. We therefore decided to try sentence classifiers that have proven to perform very well on the task of classifying claims (i.e. demands) in newspaper texts (Haunss et al., Reference Haunss, Kuhn, Padó, Blessing, Blokker, Dayanik and Lapesa2020; Dayanik et al., Reference Dayanik, Blessing, Blokker, Haunss, Kuhn, Lapesa and Pado2022). An inherent challenge associated with sentence classifiers lies in the initial necessity of identifying relevant sentences. Regrettably, those sentences containing protest forms, which the module described in Section 3.3 aptly recognizes, frequently lack the information concerning the protest claims. Our strategy therefore is to first use a binary sentence classifier to identify possible claim sentences and then use a second sentence classifier to determine the categories.
For the first subtask, we use the manually annotated DEbateNet dataset (Lapesa et al., Reference Lapesa, Blessing, Blokker, Dayanik, Haunss, Kuhn and Padó2020) to train a multi-layer perceptron as a claim identifier. Even though the model is trained on data from political debates on migration in Germany only, it performs surprisingly well also on other topics, with an F1 score of 0.78 (precision: 0.77, recall: 0.79) (Ceron et al., Reference Ceron, Barić, Blessing, Haunss, Kuhn, Lapesa, Padó, Papay and Zauchner2024). While an F1 score of 0.78 may look underwhelming given the results for relevance classification and form detection, the information redundancy in newspaper articles guarantees that usually multiple sentences containing information about the protesters’ claims exist. It should be noted that the topic-agnostic claim classifier does not only find claims made by protesters but also claims made, for instance, by addressees of the protest. Like in step 1, we address this issue by limiting the initial set of sentences to only those sentences containing one of our protest keywords plus the respective preceding and following sentences. The fact that in this context some claims come from addressees of the protests and not the protesters is not problematic because these claims still focus on the same topic.
For the second subtask, we fine-tune a sentence classifier (gbert-large-paraphrase-cosine) trained on the manually annotated protest events from the extended ProLoc data set described in Section 3.3. This classifier reaches a weighted macro average F1 score of 0.72 on the unseen test data during training (Table 3). One problem here is the strongly skewed distribution of topics, leading to seemingly unsatisfactory model performance in low-frequency categories. In high-frequency categories like environment, infrastructure, labor, or migration the model reaches above average F1 scores between 0.79 and 0.90. The model also performs very well for topics like gender and nuclear power that have a more distinct semantic field.
Table 3. Evaluation of topic prediction
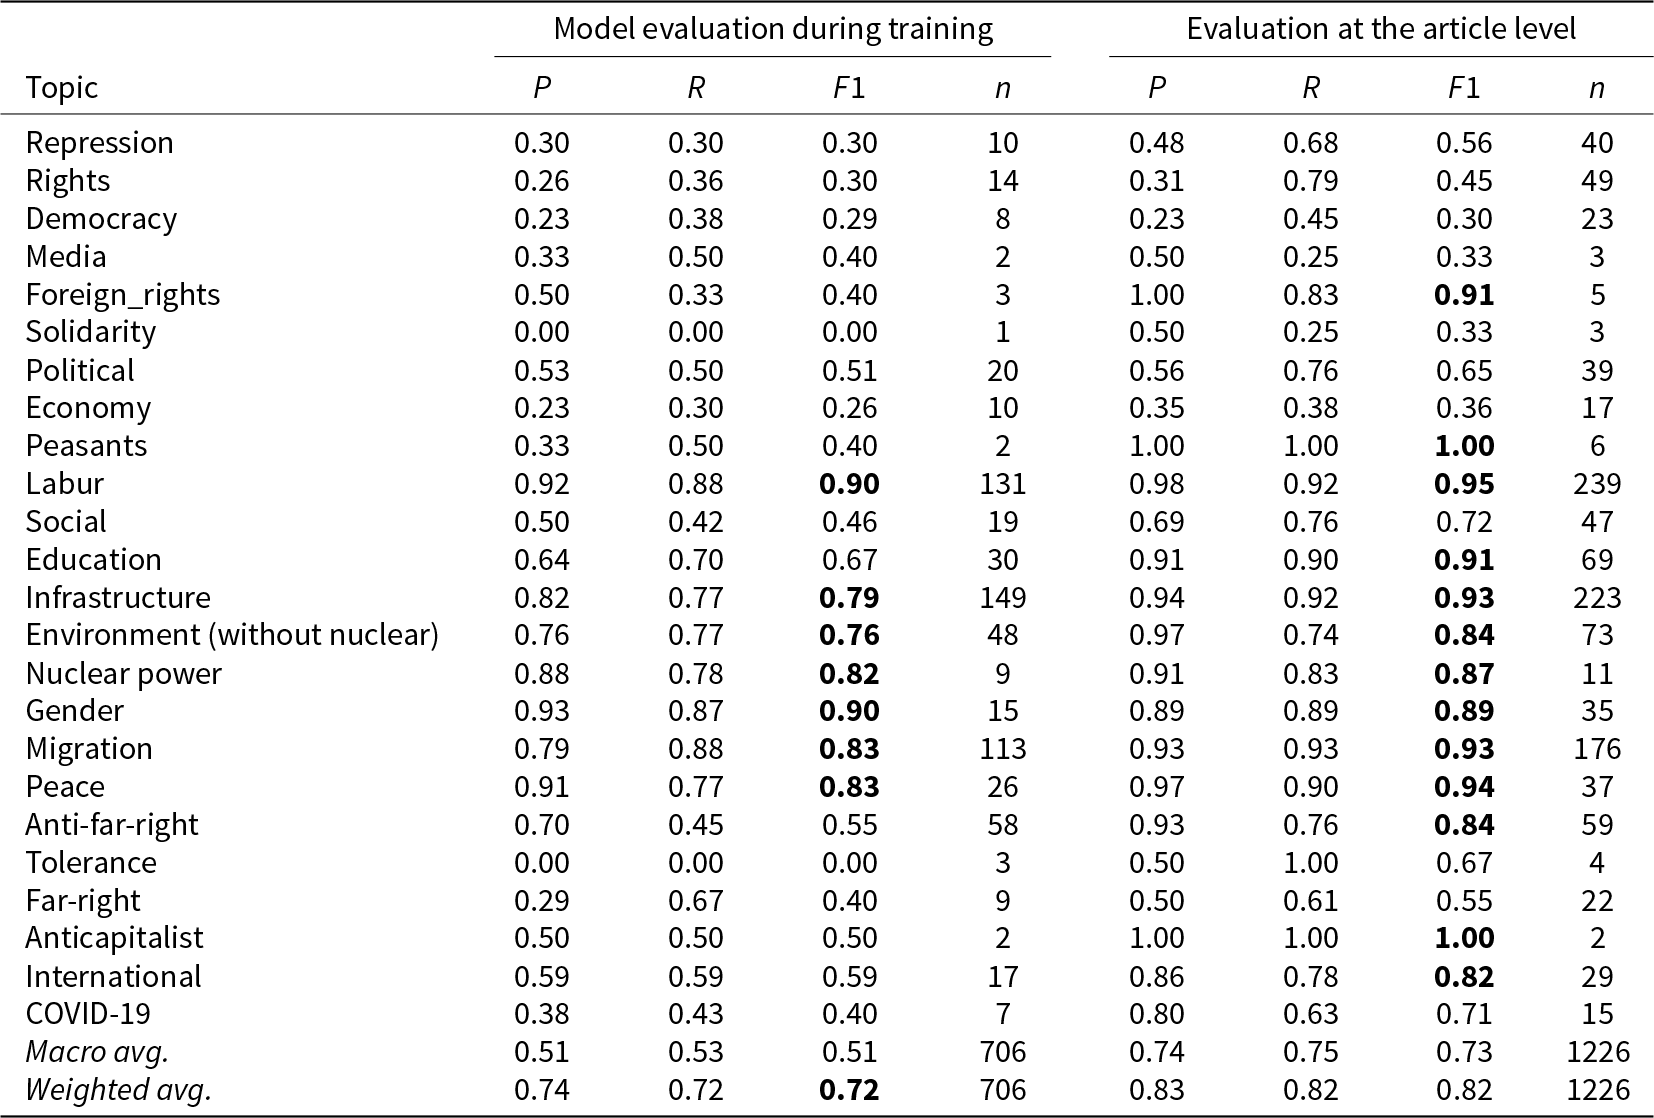
Note: Bold numbers indicate F1 scores where the model reaches or exceeds the average score of trained human annotators across all categories (see Table C1 in the Online Appendix).
Again, like in the case of the protest forms, performance at the article level is much better. When we only take the most often predicted topic per article, the weighted macro average F1 score rises to 0.82 and almost all frequent categories—and even some of the rare ones—are predicted with very high levels of accuracy (precision scores usually above 0.9 and F1 scores between 0.84 and 0.95). We can thus, again, profit from the redundancy in newspaper reporting. The model, however, overpredicts the rather abstract topic categories of repression, rights, and democracy.Footnote 5
3.5. Task 4: Identifying protest location
Location, date, and number of participants are essential features of a PEA data set. In contrast to the procedures for classifying relevance, protest form, and protest issue that we discussed earlier, these features are not identified through paragraph- or sentence-based classifiers. The location identifier instead employs Named Entity Recognition (NER) at the token level because this currently still outperforms transformer-based approaches (Tanev and De Longueville, Reference Tanev and De Longueville2023) and does not require labeled training data. We use spaCy (Honnibal et al., Reference Honnibal, Montani, Van Landeghem and Boyd2020) to identify location information—more specifically the pipeline optimized for German language processing, “de_core_news_md”—and then extract German cities based on a publicly available list of cities and ZIP codes. To be able to use the list of German cities for enhancing the results, a custom “EntityRuler” was incorporated into the pipeline following the pre-trained NER component, while the tok2vec, tagger, morphologizer, parser, lemmatizer, and sentence detector were disabled in order to reduce the processing time. The EntityRuler enables the specification of patterns for identification within the text—in this case the city names—and could be used with additional conditions, for instance, using information from the preceding step of the pipeline. If no city is found, we use the local newspaper’s place of publication.
Because our gold standard dataset only contains four cities, we manually annotated the actual protest location in 500 local newspaper articles in a separate dataset drawn from our experiment described in Section 4 to test the accuracy of the location prediction. Among all 469 true positives within these 500 articles (a precision of 0.94), the correct location was among the automatically identified locations in 78% of articles. However, the NER often identifies more than one location, which necessitates a selection rule. For this, we use the first identified location. This selection rule is crude but plausible, given that newspaper articles often begin by stating the place of the action they report on. With this rule, we can fully automatically identify the correct location in over two-thirds of true positives (68%).
We used the Mordecai 3 neural geoparser in PythonFootnote 6 as an alternative. After running the Mordecai 3 model on our subsample, we selected the locations with the highest predicted scores. The model correctly identified the location in 64% of cases, which is slightly less precise than the NER in spaCy. Nonetheless, Mordecai 3 can serve as a reasonable alternative tool in other cases.
Since these values are sufficient for a first orientation, but far from the performance we achieve for relevance, forms, and topics, we discuss some ideas for improvement in Section 5.
3.6. Task 4: Identifying protest dates
To identify the protest dates, we apply a three-step process on the same protest keyword-containing subset of sentences as described for task 1. First, we search for time-indicating keywords such as weekdays, “weekend,” or relative time expressions like “today,” “tomorrow,” or “yesterday.” We consider the article publication date as the reference. For instance, if the text mentions “Monday” and the article is published on a “Wednesday,” we code the previous Monday as the protest event date. With this procedure, we cover 62% of all the cases. In the second step, we search the remaining articles for various other date formats found in the texts (e.g. “15 March 2007,” “8 April,” “October 2007,” and “in August”). In cases where the exact day is missing, we set the date as the 15th of the given month.
Finally, in those cases where the text does not contain any date expressions, we approximate the protest date by setting it as the day before the publication of the article. Applying this multi-step process, we identify the correct exact protest date in 52.5% of the total cases. In 80.1% of the cases, the predicted date is within 1 week of the actual date.
It is worth noting that the date detection process performs especially poorly when the temporal gap between the article publication and protest date is wider than one week. In 77.9% of the inaccurately predicted cases, the reported protest event occurred more than a week before the article’s publication.
4. Applying PAPEA to create a data set on local protests in Germany
In this section, we describe a first application of the PAPEA pipeline to a large collection of newspaper articles. This constitutes a real-world application case in which the pipeline is used to extract information on protest events from unlabeled newspaper data. Given that the test data are unlabeled, we cannot compute precise performance measures. However, this test case does illustrate the profound advantages of the approach compared to time-intensive manual annotation.
4.1. Protest reporting in local newspapers
For the use case, we rely on the GermanLocalNews data set compiled at DeZIM. It contains articles from 146 German local newspapers published in a 10-year period (2010–2019). For our application of PAPEA, we limited the data to articles published in 2019 and ran them through our protest keyword list described earlier, arriving at 713,616 articles. Note that the manual annotation of about 500,000 articles that cover the 20 years of local newspaper reporting on protests in four cities in ProLoc took our five research assistants, each working 7–8 hours per week, about 3 years, and contrast this with the 17 hours compute time that it took to send the GermanLocalNews articles through the PAPEA pipeline.Footnote 7 This comparison alone underlines the immense advantages of finding well-performing automation procedures for the generation of PEA data.
From the 713,616 articles, we first subtract those that are identical duplicates, arriving at 536,995 articles from 89 newspapers. After relevance classification, we are left with 56,443 articles, which roughly corresponds to the 1:10 relation that we already noted in ProLoc. This suggests that the classifier trained on ProLoc works similarly on articles coming from different regions and newspapers than the ones it was trained on. Further removing articles in which our sentence-based classifiers did not find topics or forms reduces the data to 55,605 articles. We finally remove articles that are identical on publication date, topic, form, and identified location, thus removing articles that duplicate the protest event information, arriving at a data set containing 45,328 events.Footnote 8 Note that GermanLocalNews contains only 146 of the 498 local newspapers issued in Germany (Wikipedia, 2024) and thus contains only a fraction of the whole number of reported events (even though that fraction is likely larger than the fraction of covered newspapers). But still, this number is two orders of magnitude larger than, for instance, the 415 events that the PolDem-30 data report for Germany in 2019 based on national-level sources (Kriesi et al., Reference Kriesi, Wüest, Lorenzini, Makarov, Enggist, Rothenhäusler, Kurer, Häusermann, Wangen, Altiparmakis, Borbáth, Bremer, Gessler, Hunger, Hutter, Schulte-Cloos and Wang2020). The difference in magnitude remains even if the number of 45,328 events would, for example, be halved by a more precise process of duplicate deletion.
4.2. Some protest trends in Germany 2019
We now illustrate some protest trends for Germany in 2019. Figure 3 shows a kernel density plot of the distribution of events. Two observations are immediately apparent. First, the protest wave of the Fridays for Future is clearly visible with its climate strikes in March, September, and November. Second, in contrast to PEA data sets that focus on national reporting and thus tend to mirror attention biases more than local-sourced PEA data (Hocke, Reference Hocke1996), we see much protest activity beyond these peaks as well.
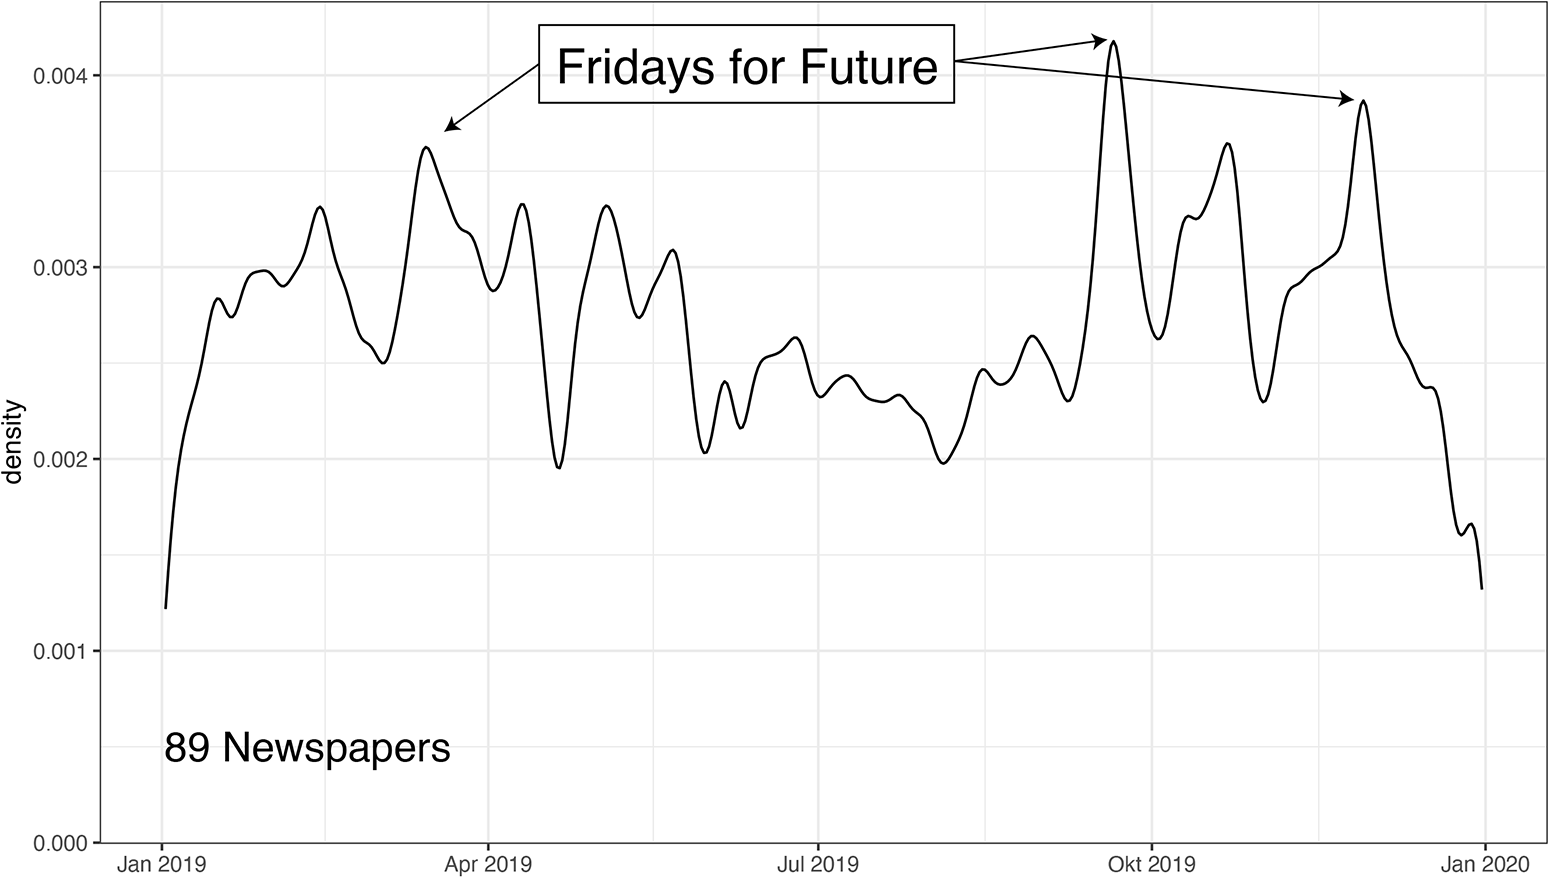
Figure 3. Distribution of automatically annotated articles containing protest events, Germany 2019.
Next, Figure 4 (left panel) displays the distribution of topics in the automatically generated data set. Environmental protests are strongly represented as the second largest category, suggesting again that the pipeline correctly identifies the FFF protest wave of 2019. However, the results also point to topics that were not present on the national news agenda to a similar extent: the largest and third-largest categories are infrastructure and labor-related protest. This matches the distribution for 2019 in the manually annotated ProLoc data set (Figure 4, right panel). As expected, the categories of rights, repression, and democracy are overpredicted, and some idiosyncrasies of our city selection in ProLoc come to the fore (for instance the higher share of far-right and anti-far-right protests owing to the inclusion of Leipzig and Dresden). But the picture is still very similar across the data sets. Environmental and infrastructure protests make up the largest categories with 15% and 17%, and migration, labor, and social protests are all among the most frequent categories in both graphs. This comparison again suggests that the automatically annotated protest event data captures empirically meaningful trends.
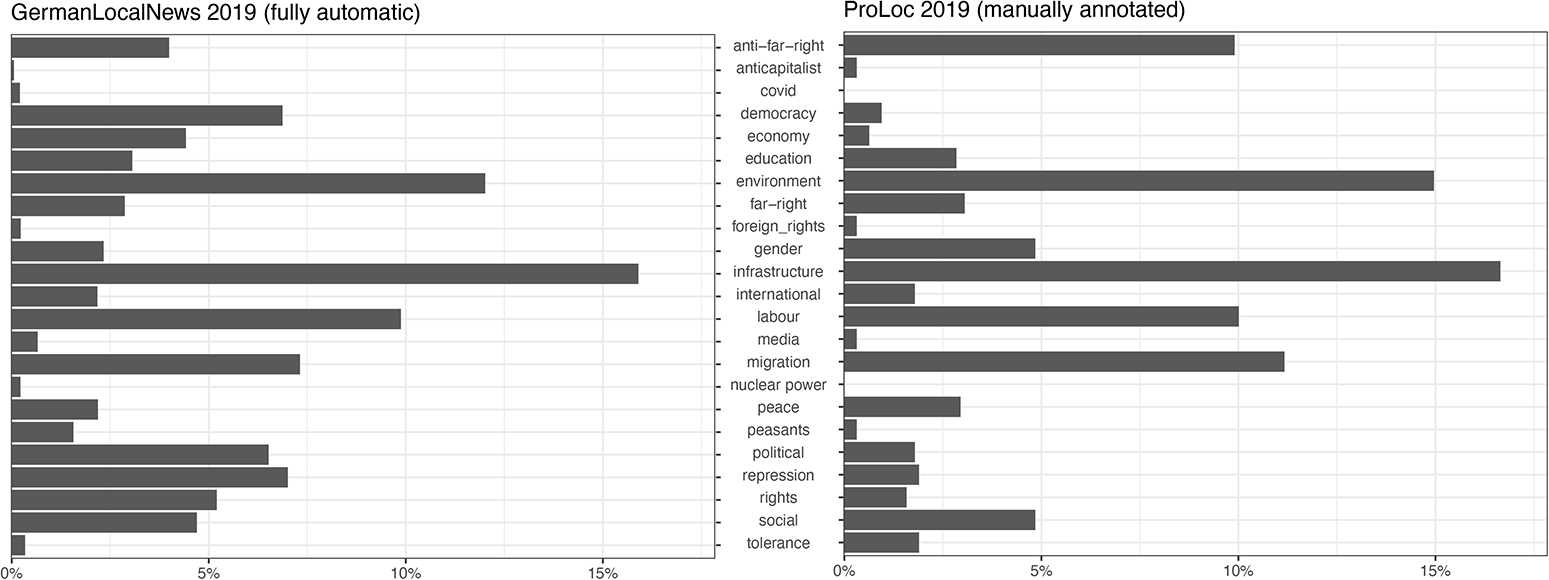
Figure 4. Topics addressed in automatically annotated protest events, Germany 2019.
This short overview indicates that our pipeline can be put to productive use at this stage in its current, fully automated state, particularly to identify broad protest trends across a large number of sources and, for these trends, will deliver results of similar quality as data sets based on labor-intensive manual coding. At the same time, we identified several areas for improvement to further optimize the quality of the data set.
5. Generalizability and limitations
The pipeline that we have developed fulfills a very specific task: the automation of protest event analysis for German-language newspapers. To what degree can the same pipeline be used for more general tasks? We consider here two scenarios: (1) protest event analysis in other languages and (2) political actions other than protest.
With regard to the first question, we tested PAPEA on English-language newswire reports used in the PolDem project (Kriesi et al., Reference Kriesi, Wüest, Lorenzini, Makarov, Enggist, Rothenhäusler, Kurer, Häusermann, Wangen, Altiparmakis, Borbáth, Bremer, Gessler, Hunger, Hutter, Schulte-Cloos and Wang2020). Our model for protest form classification was fine-tuned with German language training sentences only. But the underlying base model (paraphrase-multilingual-mpnet-base-v2; Reimers and Gurevych, Reference Reimers and Gurevych2019) was trained on texts from 50 languages and therefore our fine-tuned model should in theory also perform well on texts in these other languages. And, indeed, the fine-tuned classifier worked very well on the English language newswires and on protest forms (see Online Appendix D). Adapting our more fine-grained protest form categories to the less fine-grained protest form categories from the PolDem project (as mentioned earlier), we can report F1 scores between 0.79 for “violent protests” and 0.96 for “demonstrations.” While we could not test the performance on protest topics (due to the incompatibility of the PolDem topic categories with our topic categories), the results for the protest forms show that our pipeline is not limited to German language texts and can be applied without modification to English newswire texts—and likely also to other news sources.
Second, an application of the PAPEA pipeline for other forms of political claims-making beyond protest would be feasible without much modification: it would require replacing the protest-form classification module with a new fine-funed model for other forms, like discursive interventions or lobbying. As long as the topics cover a similar field, the topic classification module could stay the same, since it already classifies protest topics based on only the claim sentences in the newspaper articles.
Nevertheless, PAPEA is not meant to be a general-purpose text classification toolkit, nor can it replace highly resource-intense general event collection and classification efforts like GDELT. Instead, it is a pipeline that can be used by relatively small research teams with access to limited computational and financial resources to automatically create protest event datasets tailored to their specific research interests.
In our current pipeline, we see three areas in which improvement is needed and where we have some suggestions on how to address current shortcomings in updated modules of the pipeline: infrequent categories, precise location, and precise date. Two further aspects would require adding new modules to the pipeline: actor identification and automatic recognition of the number of protesters.
5.1. Infrequent categories
The two main blocks of the pipeline, protest topic and form classification, work already very well for the more frequent categories. The lesser performance in the low-frequency categories where we had significantly less than 200 annotated examples is most likely a result of insufficient training data. To improve model performance for these categories, we suggest using the existing pipeline to identify in not yet annotated newspaper articles a larger number of form and topic sentence candidates that most likely cover these categories, then evaluate them manually and retrain the model with this additional data. This should be doable with a reasonable amount of work. Or one could even use LLMs to synthetically generate training data for empirically infrequent categories (Halterman, Reference Halterman2025).
Another option is to reduce the number of categories. Since our codebook for protest forms is relatively fine-grained—much more fine-grained, for instance, than the PolDem project (Kriesi et al., Reference Kriesi, Wüest, Lorenzini, Makarov, Enggist, Rothenhäusler, Kurer, Häusermann, Wangen, Altiparmakis, Borbáth, Bremer, Gessler, Hunger, Hutter, Schulte-Cloos and Wang2020)—we computed two additional scenarios for a simplified form codebook. In the first, we aggregated our 20 forms into 6 macro-categories (symbolic physical, symbolic nonphysical, disruptive nonviolent, violent, strike, and legal action). The process of simplification is reported in Online Appendix B. In the first test, we retrained the model on the set of reduced categories and applied it to the test data. We achieve a weighted macro F1 score of 0.9 on the sentence level (see Online Appendix B), which is already somewhat better than the 0.85 reported earlier. The best result, however, is achieved when predicting with the original 20-category model and later aggregating to the 6 macro categories. On the article level, we achieve 0.92 unweighted and 0.97 weighted F1 (see Online Appendix Table B3), which outperforms the original fine-grained model. Our results thus show that aggregating the predictions of the original model with more categories delivers better results than directly predicting the fewer aggregated categories. The reason for this is that broader categories are usually also semantically more diverse which sometimes makes them harder to predict than more specific categories.
5.2. Protest location
In addition to our country-specific solution, we also tested more general and more sophisticated geolocation tools like Mordecai 3, but were not able to get better results at the city level. Currently, we think that for projects that require geolocation at the city level, still some manual curation of the cases with lower certainty scores is necessary. For projects that require geographical precision at the state or national level only, existing general geolocation tools already perform very well (Halterman, Reference Halterman2023).
5.3. Precise dates
Experiments with more sophisticated rule-based time extraction models like Heideltime (Strötgen and Gertz, Reference Strötgen, Gertz, Màrquez, Callison-Burch and Su2015) did not lead to better results than our rather crude search strategy. Caren et al. (Reference Caren, Andrews and Ray2023) have recently used ChatGPT 3.5 for this task on a set of 500 locally reported protest events of the Black Lives Matter movement with very promising results (over 90% of correctly identified dates). After replicating and adapting their pipeline for our German language data, the results, however, were disappointing. In our test data of 2402 articles, ChatGPT 3.5 identified the correct date only in 47% of cases. One reason for this large discrepancy may be our much broader definition of protest, another reason may be differing performance of ChatGPT on German and English newspaper data in general. For the time being, we would argue that precise location and date identification still requires some human post-processing to deliver reliable data.
5.4. Actor identification
Identifying potential actors with current NER tools is almost trivial. But the problem of distinguishing between the protest actors, the addressees of the protest and other actors mentioned in the text, and canonization of actor names is still not solved. For canonization, some approaches exist. Actor recommenders like RePAIR (Solaimani et al., Reference Solaimani, Salam, Khan, Brandt and D’Orazio2017) work for actors prominent enough to be mentioned in Wikipedia or other knowledge bases. More recently, Cereon et al. (Reference Ceron, Barić, Blessing, Haunss, Kuhn, Lapesa, Padó, Papay and Zauchner2024) have shown that combining LLMs for actor identification and pre-trained XLM models for canonization potentially can tackle the problem of distinguishing between actors with different roles.
5.5. Protester numbers
Again, using NER tools, it is easy to extract verbal and numeric representations of numbers from texts. Unfortunately, many of our texts contain multiple numbers, and determining which of these actually represent the protesters is far from trivial.
In principle—because both actor and number identification are easy to solve for humans—language models should in the future also be able to solve this, and then the respective modules can be added to the pipeline.
5.6. Multiple events per article
So far, our pipeline is able to identify possible cases of multiple events per article, e.g. when several forms and/or topics are identified, but as of yet, we do not have a reliable procedure for separating them. In the local newspaper data, however, multiple events are a relatively rare phenomenon limited to short and intense periods of protest-counterprotest interaction (in our data, this was the case in 2014–15 in Leipzig and Dresden). Given the highly complex way of local newspaper reporting in such cases, currently the most promising way to deal with this problem is to identify possible cases (either by multiple forms/topics or through a classifier trained on detecting protest-counterprotest interaction), and flag them for manual control.
A more general concern is that our pipeline might soon be outdated. This could be the case, for instance, when generative AI applications like ChatGPT become so computationally efficient that they can be used on millions of newspaper or online texts. Given the rapid change in machine learning development, this is clearly a possibility. In our view, here the modular character of the pipeline is again an advantage: single modules can easily be replaced if generative AI or other tools outperform our transformer-based classifiers, while keeping the ones intact that seem sensible to retain. Currently, generative LLMs do not yet outperform fine-tuned transformer-based models for our PEA tasks. In addition, the latter are still faster, are more energy efficient, and require less technical expertise to be run locally.
6. Conclusion
In current times of multiple, intersecting crises, the analysis of protest as a visible indicator of social and political conflict is more pertinent than ever. Protest event analysis has for decades been one of the methodological backbones of the study of protest, social movements, and contentious politics. But, because of its dependency on manual annotation, the applicability of protest event analysis has remained limited, and therefore, various research teams are working on pushing the frontiers of this method by leveraging advances in NLP methods (Fisher et al., Reference Fisher, Andrews, Caren, Chenoweth, Heaney, Leung, Perkins and Pressman2019; Oliver et al., Reference Oliver, Hanna and Lim2023; Hürriyetoğlu et al., Reference Hürriyetoğlu, Tanev, Thapa and Uludoğan2024).
This is paralleled with ongoing efforts in the automated identification and coding of political events more broadly. As a successor of ICEWS, Halterman and colleagues have recently come up with the “Political Event Classification, Attributes, and Types” (POLECAT) dataset based on a new coding ontology (Halterman et al., Reference Halterman, Bagozzi, Beger, Schrodt and Scarborough2023), arguing that “the global news sources available for coding near-real-time event data have completely outpaced any projects attempting to code these news sources with only human coders” (Halterman et al., Reference Halterman, Bagozzi, Beger, Schrodt and Scarborough2023).
Currently, we see several large-scale efforts to collect and classify political event data on conflicts on a global level. Projects like GDELT, ACLED, or POLECAT are resource-intensive endeavors, financed and supported by transnational internet companies, government agencies, or national security agencies. The benefits of these efforts are evident: automated event data collection would allow for an extension of geographic and temporal coverage, and thus enable answering much broader and more comparative research questions, compared to what is currently possible. Nevertheless, existing fully automated event databases still face severe issues of validity (Wang et al., Reference Wang, Kennedy, Lazer and Ramakrishnan2016; Hoffmann et al., Reference Hoffmann, Santos, Neumayer and Mercea2022) and usually remain limited to few forms of protest action. Moreover, tools and processing pipelines of these projects remain out of the reach of most social scientists with limited financial and computational resources in their academic institutions.
PAPEA is not intended to compete with these global event classification efforts. Instead, the focus lies on two aspects that will enable a broad applicability in many research settings: first, we push the limits of automating protest event coding and thus reduce annotation time by several orders of magnitude while maintaining high standards of accuracy. The combination of fine-tuned transformer models with rule-based approaches leads to high precision and recall along the pipeline. In addition, PAPEA’s modularity guarantees that alternative and potentially better methods can be “plugged in” once they become available.
Second, PAPEA is a pipeline that requires only moderate computational resources for its application and even for its training. It is thus a resource that can be used and controlled locally by various social scientists and allows them to build their own datasets tailored to their specific research interests. All models and tools used in PAPEA are publicly available which invites adaptation and improvement in a collective endeavor to improve the automation of PEA.
So far, our pipeline allows for an automated coding of the key variables—protest form and protest issue—at an accuracy level comparable to that of human coders. Other variables, including date and location, still require human post-processing to reach fully satisfactory results. Yet, we are rather optimistic that further technological advancements and adaptations of researchers working on the issue will continuously improve the performance of these steps in the pipeline.
Supplementary material
The supplementary material for this article can be found at https://doi.org/10.1017/psrm.2025.10013. To obtain replication material for this article, https://doi.org/10.7910/DVN/KVP7HA.
Acknowledgements
Research for this project was funded by the Federal Ministry of Education and Research (BMBF) (grant number 01UG2450CY) and the Federal Ministry of Family Affairs, Senior Citizens, Women and Youth (BMFSFJ; DeZIM).


 Open access