


Introduction
Turfgrass is ubiquitously grown in various landscapes, including home lawns, golf courses, parks, school playgrounds, and sports fields (Stier et al. Reference Stier, Steinke, Ervin, Higginson and McMaugh2013). Weed control is a constant task for turf management, as weeds compete with turfgrasses for essential nutrients, sunlight, and water, potentially compromising both aesthetics and functionality of the turf. Implementing cultural practices, such as mowing and irrigation, can reduce weed infestation but rarely achieves complete weed control (Busey Reference Busey2003; Neal Reference Neal2020). Currently, the most effective way to control weeds is the application of various preemergence and postemergence herbicides (Kraehmer et al. Reference Kraehmer, Laber, Rosinger and Schulz2014). However, weeds in natural environments are often unevenly distributed, leading to the broadcast application of herbicides across entire areas, including those without weed presence. Moreover, many commonly used herbicides, such as atrazine (photosystem II inhibitor) and monosodium methanearsonate (MSMA, arsenical herbicide), are classified as restricted-use pesticides due to their potential environmental impact (Kudsk and Streibig Reference Kudsk and Streibig2003; McElroy and Martins Reference McElroy and Martins2013; USEPA 2023a, 2023b; WSSA 2023). While manual spot spraying can significantly reduce herbicide inputs compared with broadcast applications by targeting only weed-infested areas, it is labor-intensive, time-consuming, and impractical for large-scale applications. Broadcast applications, on the other hand, are more efficient for large areas but often result in excessive herbicide use and environmental risks (Kudsk and Streibig Reference Kudsk and Streibig2003; Yu and McCullough Reference Yu and McCullough2016).
Computer vision–based automated weed detection and precision spraying technology is a promising solution for significantly reducing herbicide input and weed control costs (Bhakta et al. Reference Bhakta, Phadikar and Majumder2019; Gerhards et al. Reference Gerhards, Andujar Sanchez, Hamouz, Peteinatos, Christensen and Fernandez-Quintanilla2022; Jin et al. Reference Jin, Liu, Yang, Xie, Bagavathiannan, Hong and Chen2023b). Deep learning, a subfield of machine learning, employs multi-layered neural networks to simulate the way the human brain connects and transmits information between neurons (LeCun et al. Reference LeCun, Bengio and Hinton2015). Neural networks are a core component of deep learning and consist of a mathematical model composed of many artificial neurons, also known as nodes or units. Each neuron receives inputs from other neurons, weights and processes these inputs through an activation function, and then passes the result to the neurons in the next layer (Yang and Wang Reference Yang and Wang2020). Deep convolutional neural networks (DCNNs) have achieved remarkable success in many applications, such as facial recognition (Singh et al. Reference Singh, Hariharan and Gupta2020), natural language processing (Chowdhary Reference Chowdhary2020), self-driving cars (Maqueda et al. Reference Maqueda, Loquercio, Gallego, García and Scaramuzza2018), and automated detection of structural flaws (Luo et al. Reference Luo, Gao, Woo and Yang2019).
In recent years, the application of DCNNs in agriculture has grown exponentially. For example, Zhao et al. (Reference Zhao, Ma, Yong, Zhu, Wang, Luo and Huang2023) developed a neural network capable of detecting the germination status and estimating the total number of germinated rice (Oryza sativa L.) seeds. Ahmad Loti et al. (Reference Ahmad Loti, Mohd Noor and Chang2021) documented a neural network that effectively identifies and differentiates various diseases in pepper (Piper aduncum L.). Additionally, previous studies have demonstrated the efficacy of DCNNs for detecting weeds in a variety of cropping systems (Dang et al. Reference Dang, Chen, Lu and Li2023; Sharpe et al. Reference Sharpe, Schumann, Yu and Boyd2020; Yu et al. Reference Yu, Schumann, Sharpe, Li and Boyd2020). For example, researchers developed a neural network to detect weeds growing in soybean [Glycine max (L.) Merr.] (dos Santos Ferreira et al. Reference dos Santos Ferreira, Freitas, da Silva, Pistori and Folhes2017). Andrea et al. (Reference Andrea, Daniel and Misael2017) developed a neural network that accurately and reliably classifies weeds in corn (Zea mays L.) stands. Osorio et al. (Reference Osorio, Puerto, Pedraza, Jamaica and Rodríguez2020) successfully employed a neural network to detect weeds in lettuce (Lactuca sativa L.). Moreover, You et al. (Reference You, Liu and Lee2020) proposed a neural network–based semantic segmentation method to distinguish weeds from crops in complex agricultural settings.
DCNNs have also demonstrated great performance in detecting weeds growing in bermudagrass [Cynodon dactylon (L.) Pers.] turf (Jin et al. Reference Jin, Bagavathiannan, Maity, Chen and Yu2022a; Xie et al. Reference Xie, Hu, Bagavathiannan and Song2021; Yu et al. Reference Yu, Schumann, Cao, Sharpe and Boyd2019a, Reference Yu, Sharpe, Schumann and Boyd2019b). The use of DCNNs to detect weeds in both dormant and actively growing bermudagrass was first reported by Yu et al. (Reference Yu, Schumann, Cao, Sharpe and Boyd2019a), who compared three image classification neural networks, including DetectNet (NVIDIA, 2016), VGGNet (Simonyan and Zisserman Reference Simonyan and Zisserman2014), and GoogLeNet (Szegedy et al. Reference Szegedy, Liu, Jia, Sermanet, Reed, Anguelov and Rabinovich2015). These neutral networks were evaluated for their ability to detect and classify several broadleaf weed species, including dollar weed (Hydrocotyle spp.), Florida pusley (Richardia scabra L.), and old world diamond-flower (Oldenlandia corymbosa L.), in actively growing bermudagrass turf. It was found that DetectNet achieved an excellent F1 score of 0.99, outperforming the other two neural networks. In a subsequent study, Yu et al. (Reference Yu, Schumann, Sharpe, Li and Boyd2020) documented that VGGNet achieved excellent performance, surpassing AlexNet and GoogLeNet in detecting dallisgrass (Paspalum dilatatum Poir.), doveweed [Murdannia nudiflora (L.) Brenan], smooth crabgrass [Digitaria ischaemum (Schreb.) Schreb. ex Muhl.], and tropical signalgrass [Urochloa adspersa (Trin.) R. Webster] in actively growing bermudagrass.
To develop a commercially viable smart sprayer employing a neural network model, the spray system must detect various weed species across different turfgrass regimes, irrespective of species, ecotypes, densities, growth stages, and geographic locations. However, detecting and differentiating weeds from turfgrass can be challenging, particularly when dealing with grass weeds that share similar morphological characteristics with turfgrass species. In contrast, broadleaf weeds often exhibit distinct features that facilitate their identification. Previous neural networks were typically designed to identify a single or a limited number of weed species in specific geographic areas (Jin et al. Reference Jin, Bagavathiannan, Maity, Chen and Yu2022a, Reference Jin, Bagavathiannan, McCullough, Chen and Yu2022b, Reference Jin, Liu, McCullough, Chen and Yu2023a). In addition, due to phenotypic plasticity, significant morphological variations may occur among the weed ecotypes from different turfgrass management regimes or geographic areas (Kerr et al. Reference Kerr, Zhebentyayeva, Saski and McCarty2019). For example, a dwarf ecotype of goosegrass [Eleusine indica (L.) Gaertn.], with an average internode length of only 0.2 cm, has been found in a golf course in Florida (Kerr et al. Reference Kerr, Zhebentyayeva, Saski and McCarty2019), in contrast to wild ecotypes with an average internode length of 7 cm (Saidi et al. Reference Saidi, Kadir and Hong2016). Consequently, these networks may struggle to detect different weed ecotypes, species, or those growing in mixed stands at varying growth stages and densities across diverse turf regimes and geographic regions. Moreover, bermudagrass is widely utilized in various turf sites, including home lawns, golf courses, school playgrounds, and sport fields.
Research has shown that training image size and quantity significantly influence the performance of neural networks in weed detection. Zhuang et al. (Reference Zhuang, Li, Bagavathiannan, Jin, Yang, Meng and Chen2022) evaluated multiple neural networks, including AlexNet and VGGNet, for the detection and classification of broadleaf weed seedlings in wheat (Triticum aestivum L.) and found that, for a small training dataset (5,500 negative and 5,500 positive images), increasing the size of the training images from 200 × 200 pixels to 300 × 300 or 400 × 400 pixels resulted in a decrease in the F1 scores of both networks. However, for larger training datasets (11,000 negative and 11,000 positive images), increasing the image size improved the performance of all studied networks, regardless of the image sizes. Therefore, the objectives of this research were (1) to assess the ability of image classification neural networks trained on datasets from limited geographic regions to generalize weed detection performance across diverse bermudagrass turf regimes and locations and (2) to examine how varying the size of training datasets impacts the performance of eight different neural network models.
Materials and Methods
Neural Network Models
This study evaluated eight neural network models for weed detection in turfgrass systems. These included AlexNet (Krizhevsky et al. Reference Krizhevsky, Sutskever and Hinton2012), a pioneering DCNN with five convolutional layers; GoogleNet (Szegedy et al. Reference Szegedy, Liu, Jia, Sermanet, Reed, Anguelov and Rabinovich2015), which employs an Inception architecture for efficient feature extraction; and VGGNet (Simonyan and Zisserman Reference Simonyan and Zisserman2014), known for its deeper structure with multiple 3 × 3 convolution kernels. Additionally, ResNet101 and ResNet152 (He et al. Reference He, Zhang, Ren and Sun2016), which utilize residual learning, were assessed to enhance deep network training. To improve multi-scale feature extraction, Res2Net and ResNeXt (Gao et al. Reference Gao, Cheng, Zhao, Zhang, Yang and Torr2019) were also included. Finally, PoolFormer, a transformer-based model with a simplified MetaFormer architecture (Yu et al. Reference Yu, Luo, Zhou, Si, Zhou, Wang and Yan2022), was tested for its ability to generalize weed detection across diverse conditions. A summary of each model’s architecture and advantages is provided in Table 1.
Table 1. Eight neural networks evaluated in the study.
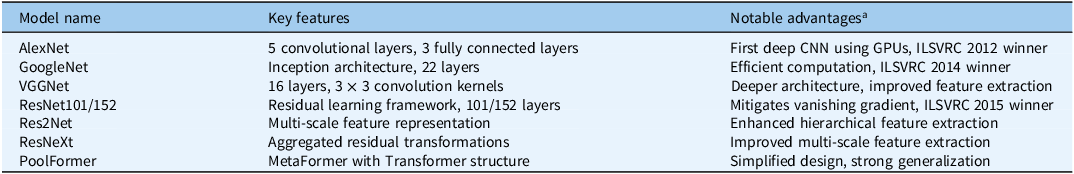
a Abbreviations: CNN, convolutional neural network; GPU, graphics processing unit; ILSVRC, ImageNet Large Scale Visual Recognition Challenge.
Image Acquisition
The training, validation, and testing dataset images were mainly captured in four cities in Florida and Georgia in the United States, covering various turf regimes infested with a variety of broadleaf, grass, and sedge weeds, as detailed in Table 2 and Figure 1.
Table 2. Details of training, validation, and testing dataset images. a
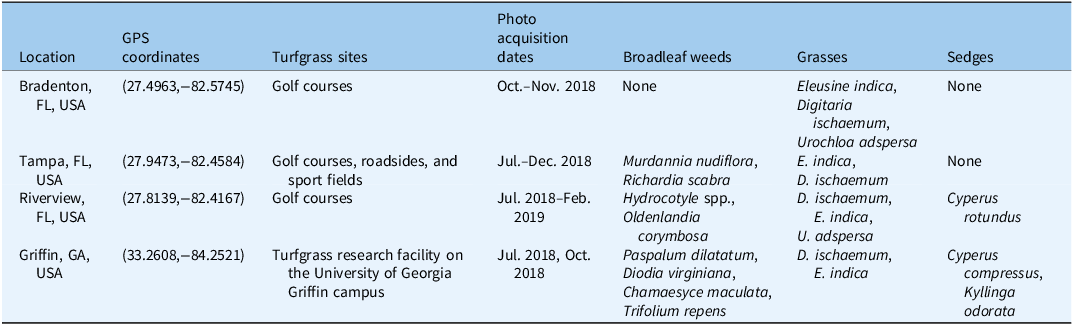
a Training, validation, and testing dataset images collected from four locations in Florida and Georgia, USA.
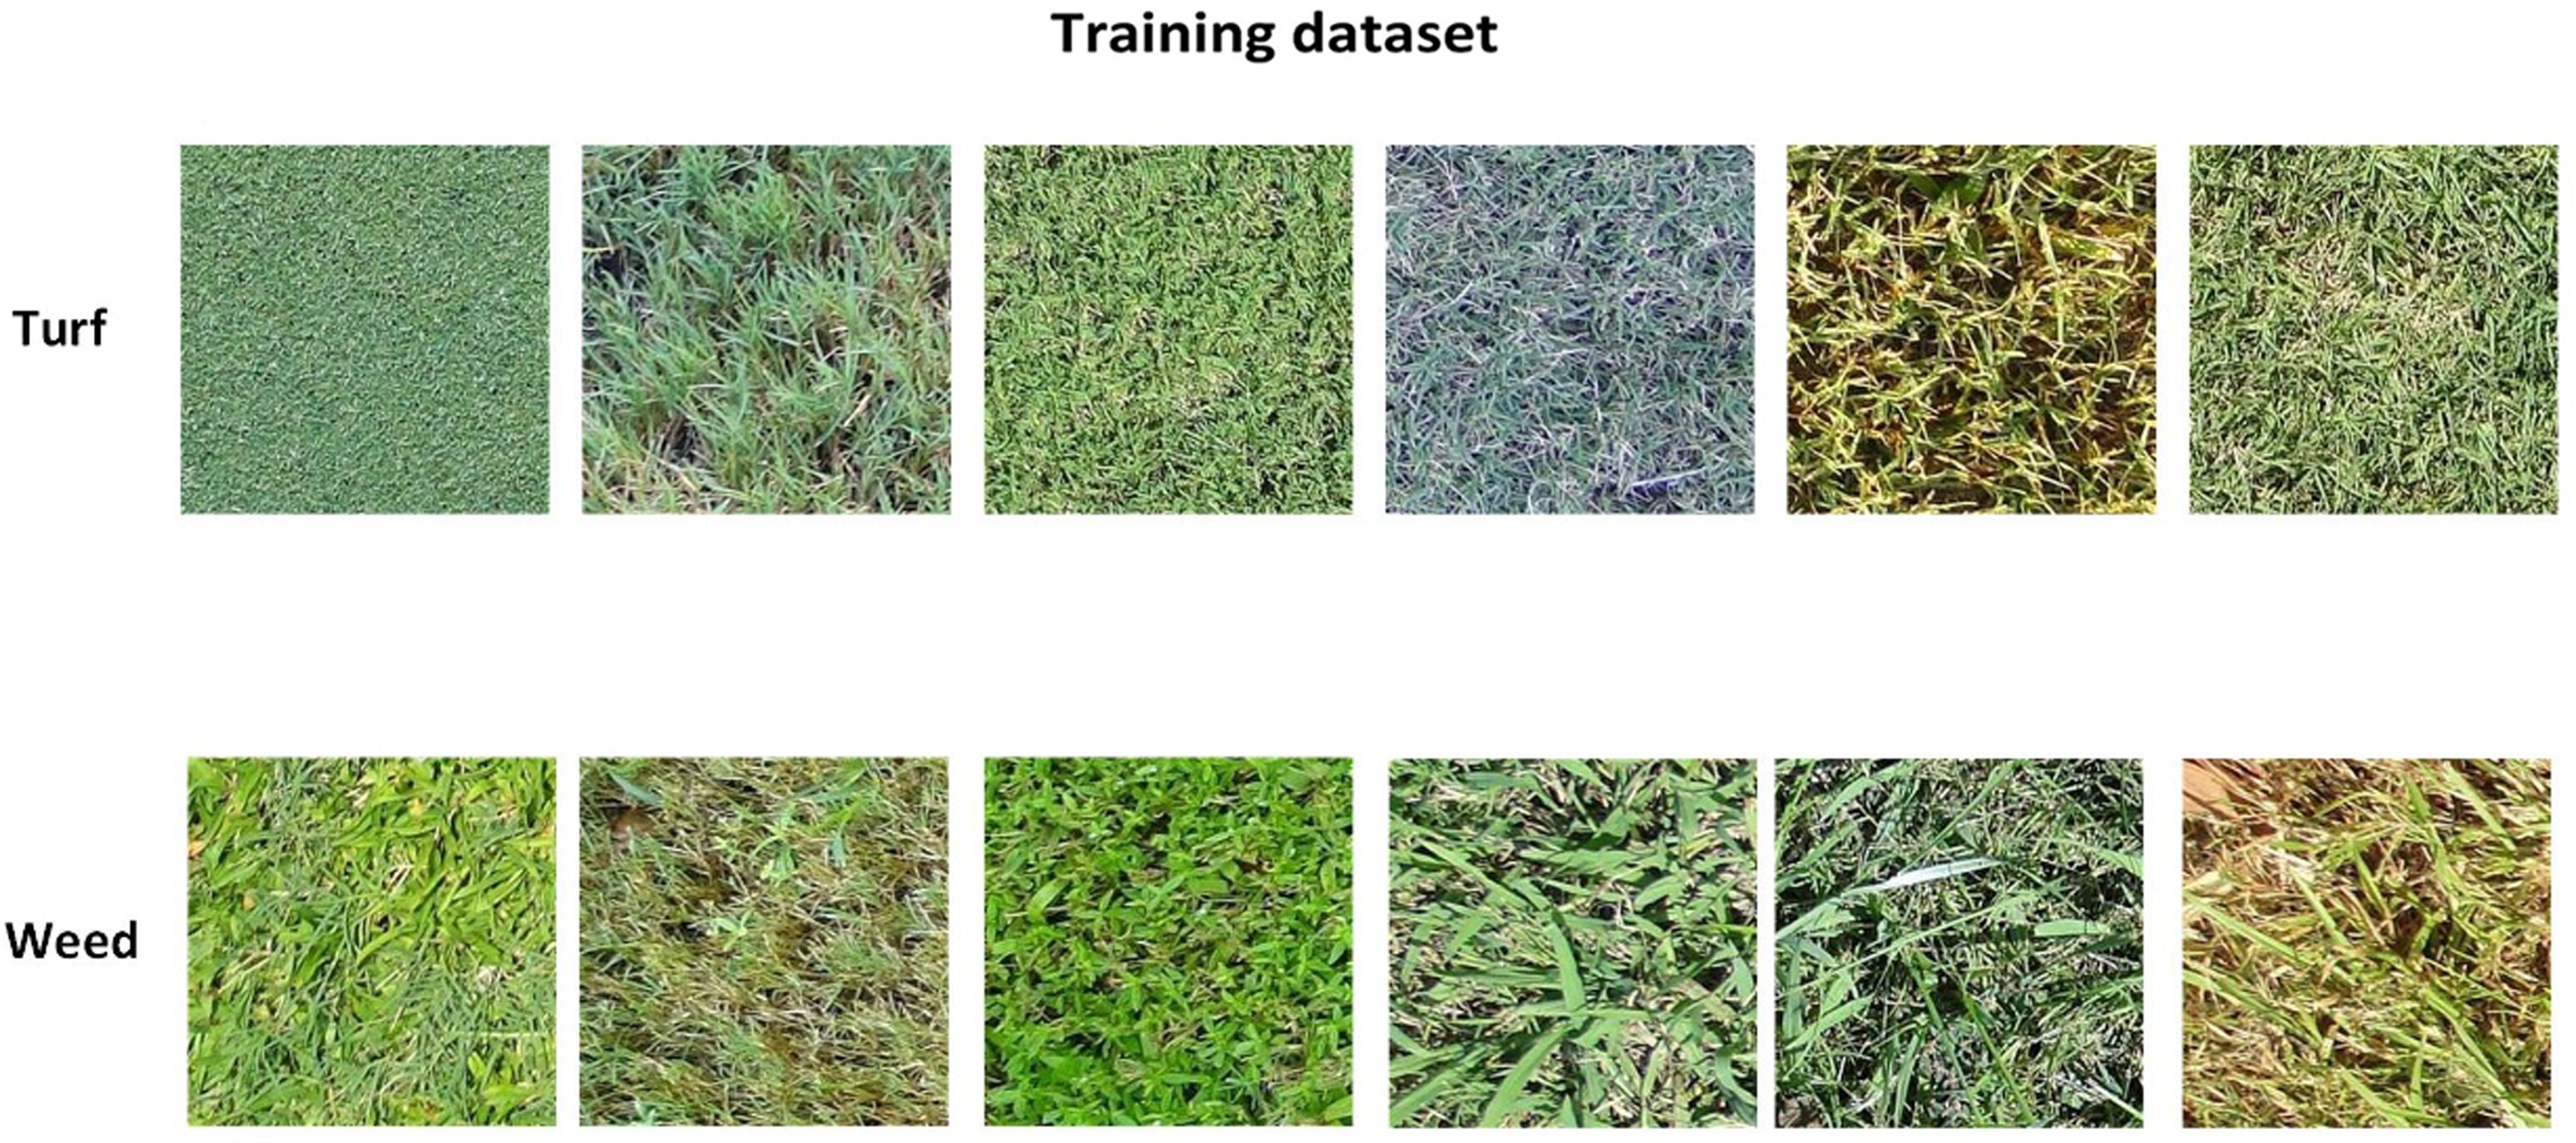
Figure 1. Image examples from the training dataset. The dataset includes Digitaria ischaemum and Paspalum dilatatum at the 3- to 5-tiller stage and Murdannia nudiflora and Oldenlandia corymbosa at full maturity before flowering.
In Bradenton, FL, USA (27.4963, -82.5745), images were captured multiple times at a golf course between October and November 2018, predominantly featuring annual grass weeds such as E. indica, D. ischaemum, and U. adspersa, with visually estimated turf cover exceeding 90% and bare soil cover below 10%.
In Tampa, FL, USA (27.9473, -82.4584), images were captured multiple times between July and December 2018 from golf courses, roadsides, and sports fields, primarily featuring M. nudiflora, R. scabra, E. indica, and D. ischaemum.
In Riverview, FL, USA (27.8139, −82.4167), images were collected from the rough of a golf course between July 2018 and February 2019. These images included broadleaf weeds such as Hydrocotyle spp. and O. corymbosa, along with grasses like E. indica, D. ischaemum, and U. adspersa. Additionally, low-density pre-flowering purple nutsedge (Cyperus rotundus L.) was present. Turfgrass cover ranged from 70% to 80%, while bare ground covered 20% to 30%.
In Georgia, USA, images were captured in July and October 2018 at the turfgrass research facility at the University of Georgia Griffin Campus (33.2608, -84.2521). These images featured low-density, pre-flowering annual sedges (Cyperus compressus L.) exhibiting a clump growth habit, as well as broadleaf weeds, grasses, and fragrant kyllinga (Kyllinga odorata Vahl). The broadleaf weeds included spotted spurge [Chamaesyce maculata (L.) Small; syn.: Chamaesyce maculata L.], Virginia buttonweed (Diodia virginiana L.), and white clover (Trifolium repens L.), while the grasses included P. dilatatum, E. indica, and D. ischaemum.
Regarding model robustness testing, this study constructed an additional robustness testing dataset. These data were collected from 24 different locations across the United States and China, as shown in Figures 2 and 3. Each test scenario in the dataset consists of 100 turfgrass images without weeds and 100 images containing weeds.
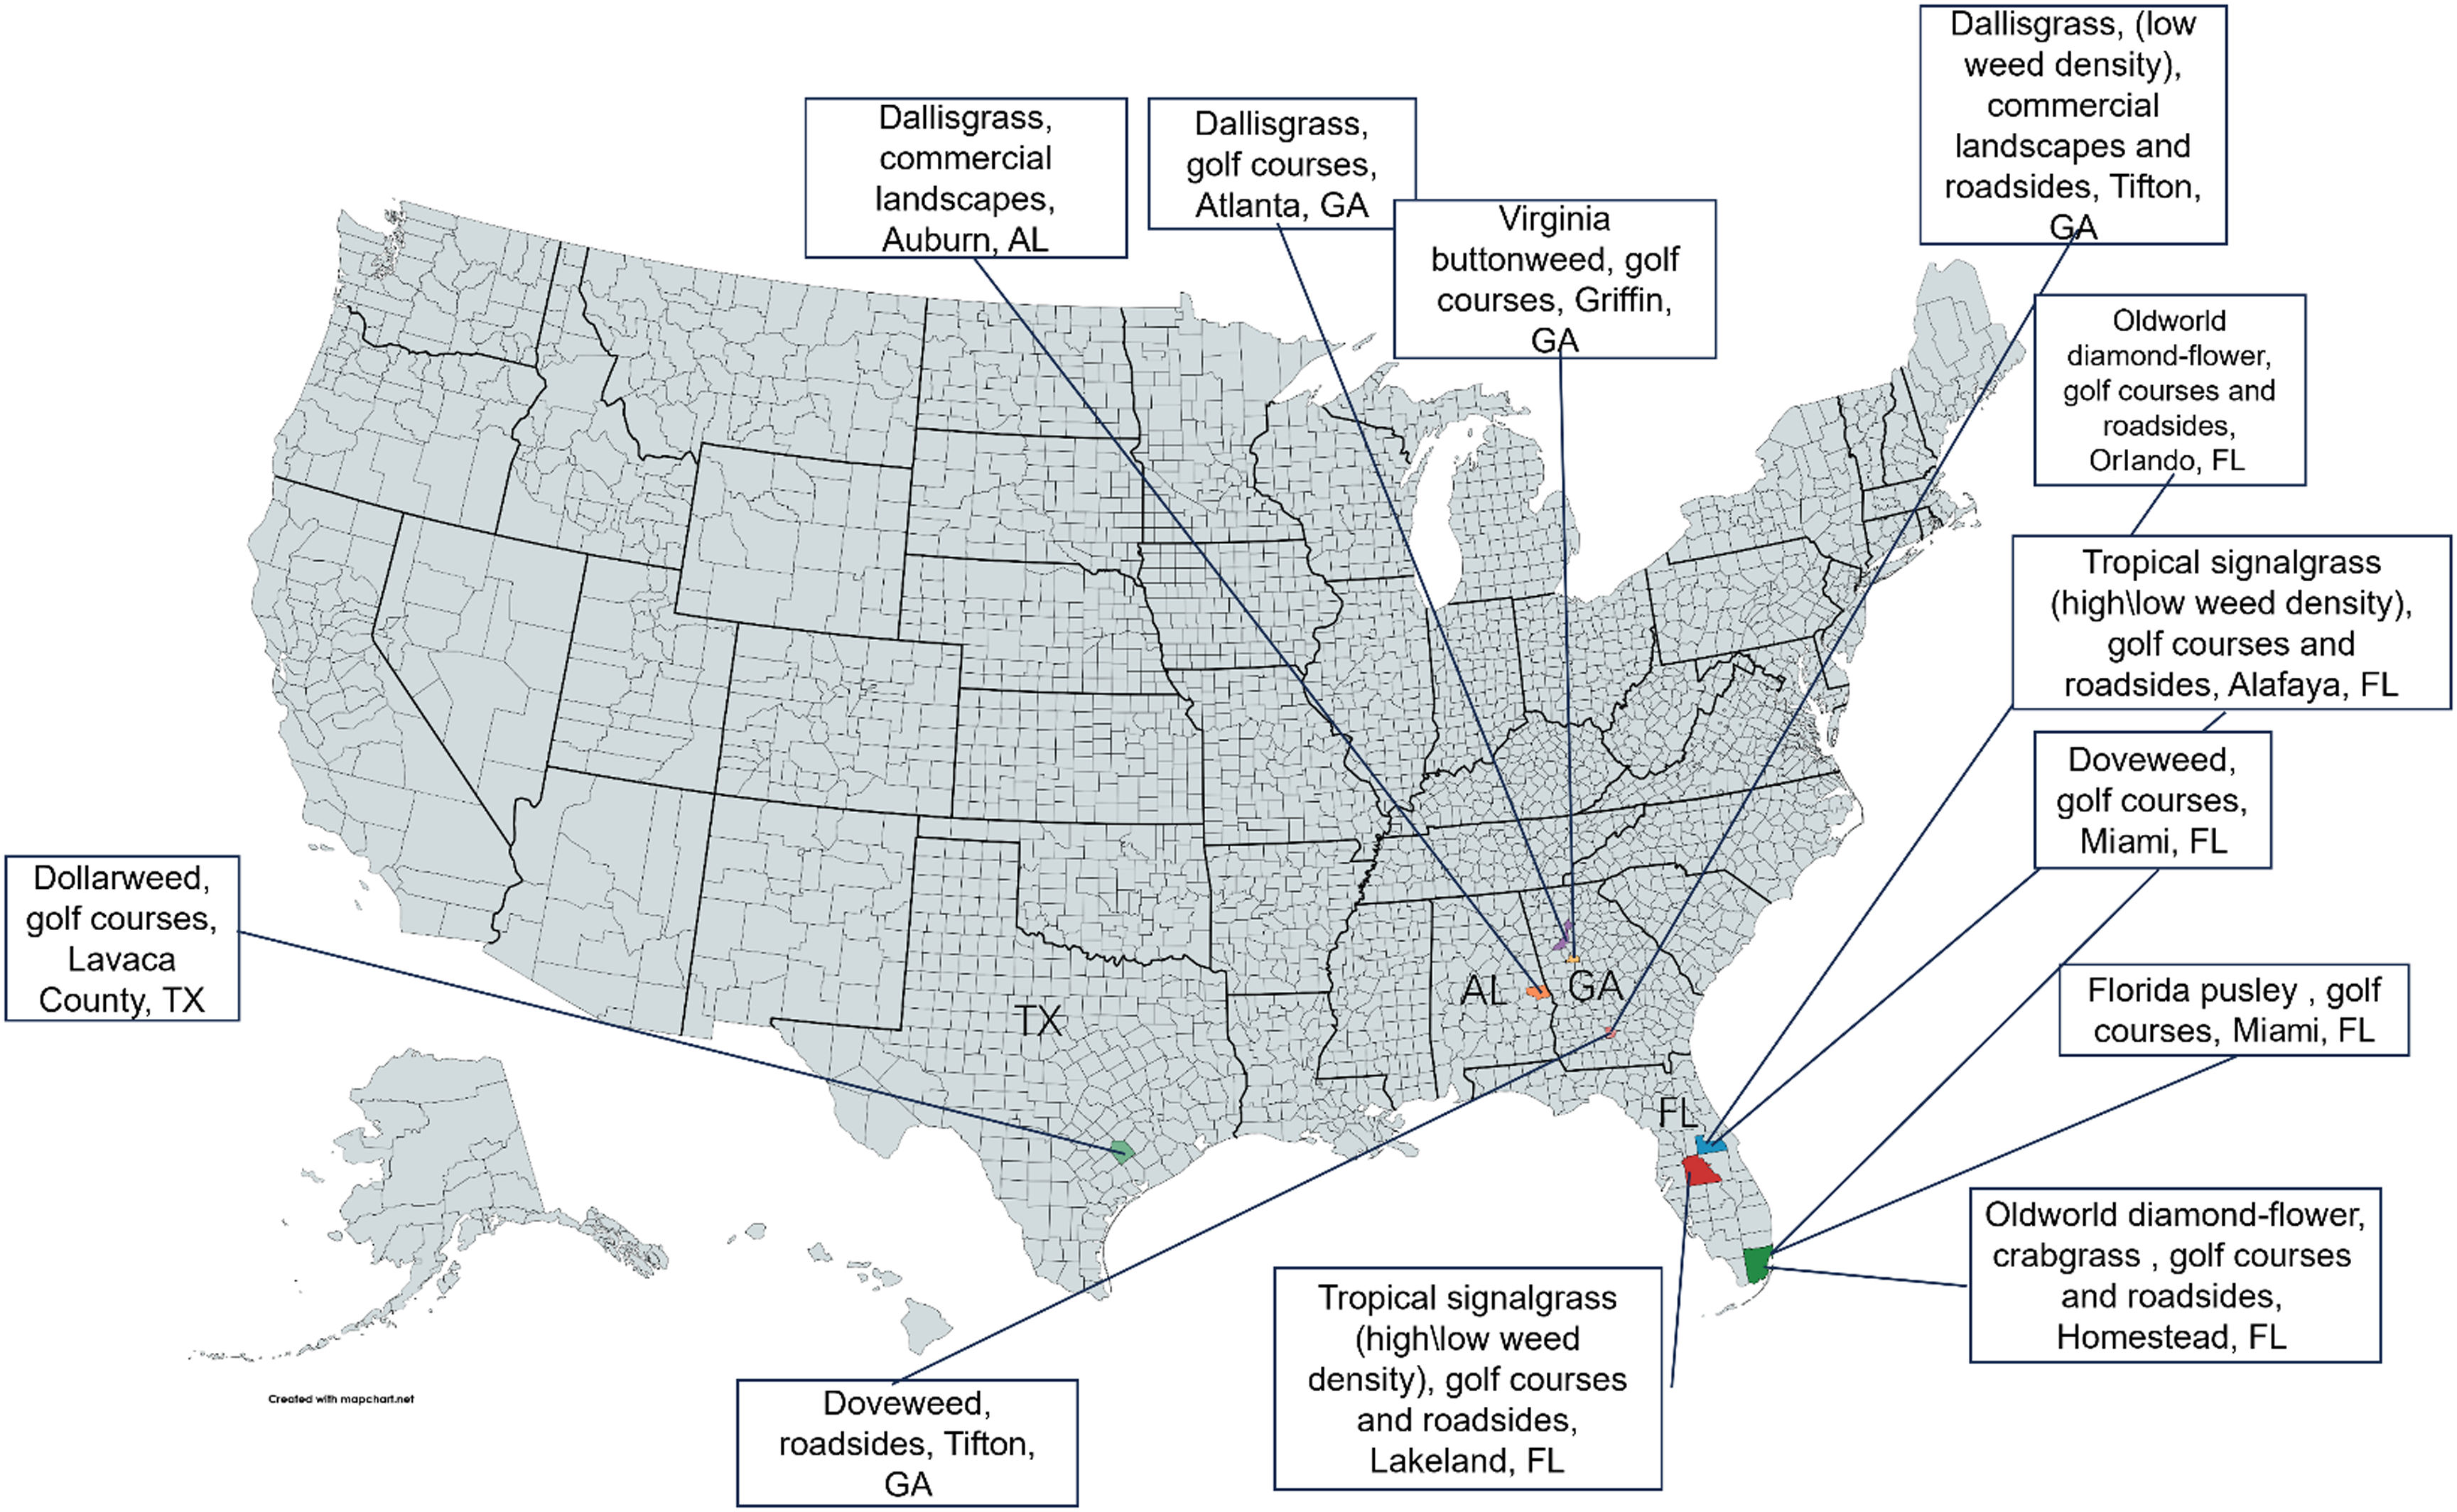
Figure 2. Images of weed species and their respective turf sites in the United States used for neural network robustness testing.
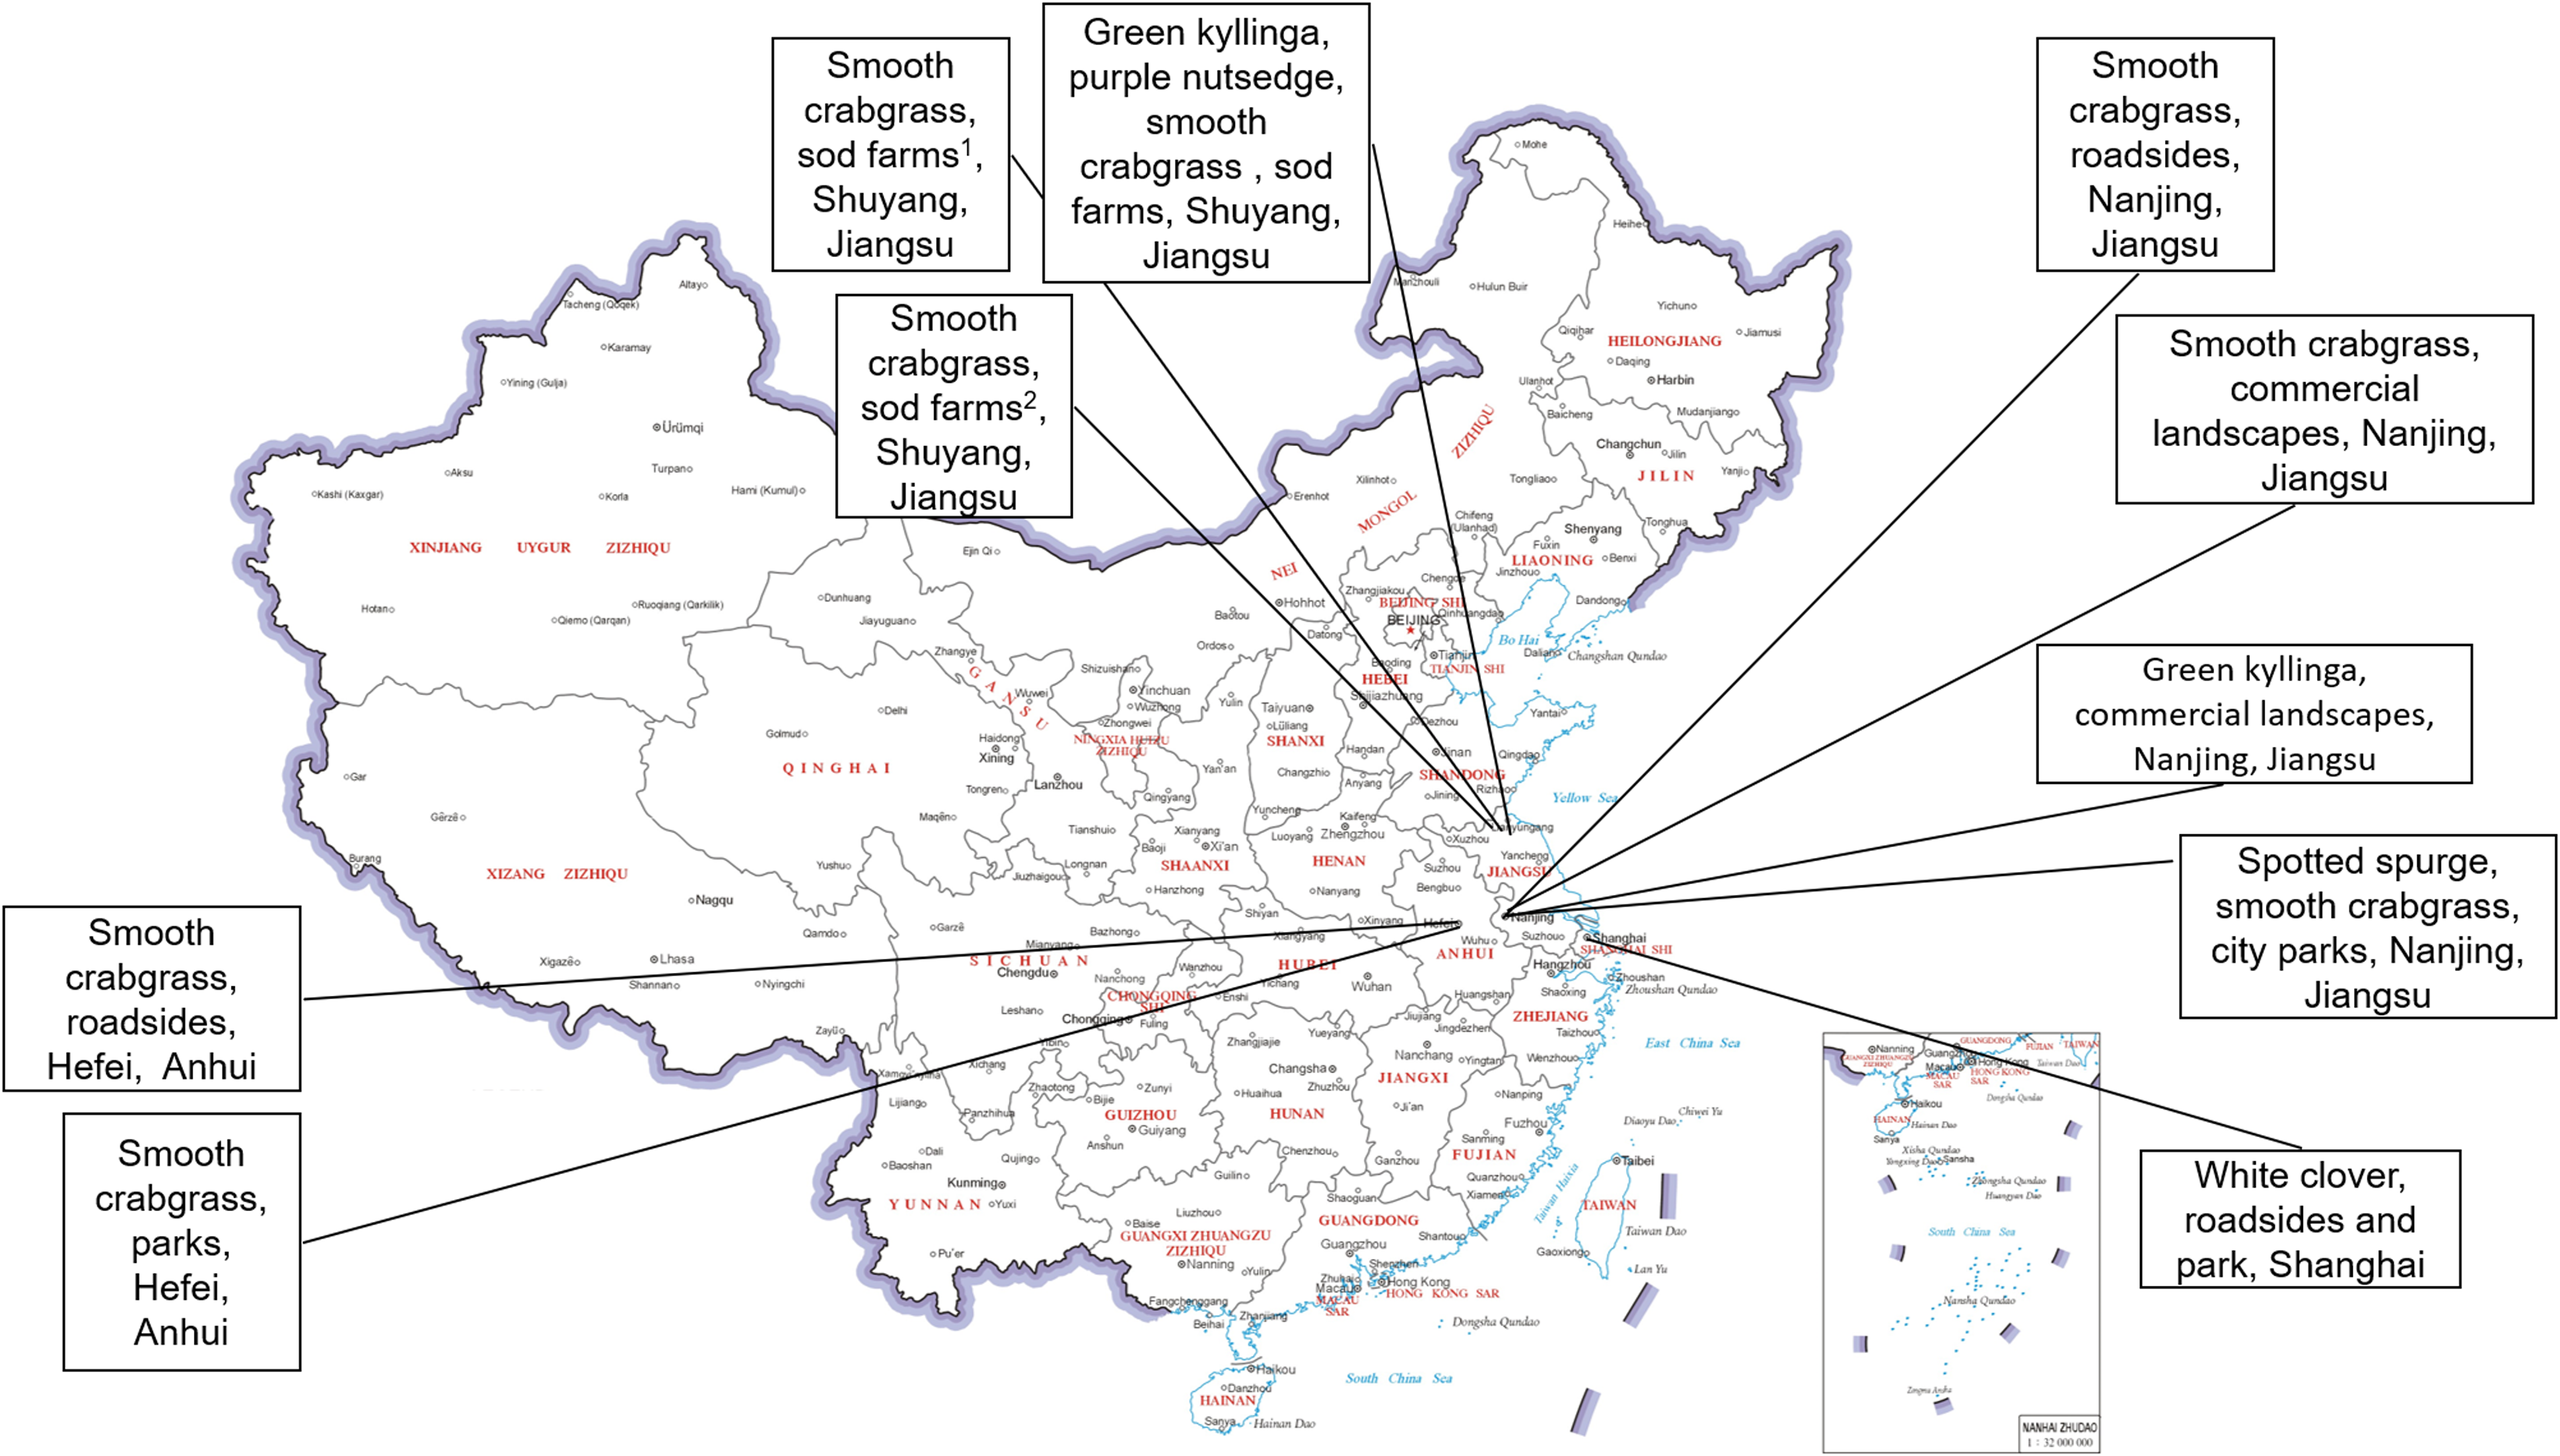
Figure 3. Images of weed species and their respective turf sites in China used for neural network robustness testing.
All images used in this study were captured using a Sony® Cyber-Shot camera (Sony, Minato, Tokyo, Japan) with a resolution of 1,920 × 1,080 pixels. They were captured between 0900 and 1700 hours under various weather and outdoor lighting conditions, including clear, cloudy, and partly cloudy conditions.
Training and Testing
To align with the input requirements and maintain compatibility across the deep learning model architectures evaluated in this study, the original images were resized to 480 × 480 pixels. These resized images were then divided into two datasets. The small training dataset contained 10,000 positive images (with weeds) and 10,000 negative images (without weeds). To construct the large training dataset, an additional 40,000 images were added—20,000 positive and 20,000 negative—resulting in 30,000 positive and 30,000 negative images. Both the validation and the testing datasets contained 1,000 positive and 1,000 negative images each.
In this study, eight DCNNs were trained on the small and large training datasets for 100 epochs each. After the optimal weights for each model were obtained, model performance was evaluated on the testing dataset. The best-performing model was then selected to undergo final robustness testing on the testing dataset. Jin et al. (Reference Jin, Bagavathiannan, McCullough, Chen and Yu2022b) employed a classification-based approach for weed detection, wherein images were segmented into grid cells and classified based on the presence of weeds. This method enables both detection and localization, with classification evaluation metrics effectively reflecting the model’s performance in weed detection.
A confusion matrix was employed to evaluate the performance of each model. This matrix compares the predicted results of a classifier with the true labels, categorizing them into four categories: true positives (TP), true negatives (TN), false positives (FP), and false negatives (FN).
In the confusion matrix:
-
TP represents the number of instances correctly predicted as positive.
-
FN represents the number of instances incorrectly predicted as negative when they are actually positive.
-
FP represents the number of instances incorrectly predicted as positive.
-
TN represents the number of instances correctly predicted as negative.
In the present research, TP represents the model correctly identified the target weed; TN represents the model correctly identified images without the target weed; FP represents the model incorrectly predicted the target weed; and FN refers to instances where the model failed to predict the presence of the actual target weed.
The confusion matrix was used to calculate various performance metrics of a classification algorithm. In this study, precision (Equation 1), recall (Equation 2), F1 score (Equation 3), and Matthews correlation coefficient (MCC) (Equation 4) were calculated using the results from the confusion matrix.
Precision measures the ability of the developed neural network to correctly identify the targets and was calculated using the following formula:
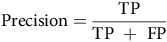 $${\rm{Precision}} = {{{{\rm{TP}}}} \over{{{\rm{TP\;}} + {\rm{\;FP}}}}}$$
Recall provides an estimation of the developed neural network’s ability to identify its targets and was calculated using the following formula:
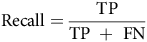 $${\rm{Recall}} = {{{{\rm{TP}}}} \over {{{\rm{TP\;}} + {\rm{\;FN}}}}}$$
The F1 score, defined as the harmonic mean of precision and recall, was calculated using the following formula:
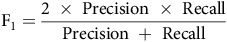 $${{\rm{F}}_1} = {{{2{\rm{\;}} \times {\rm{\;Precision\;}} \times {\rm{\;Recall}}}} \over {{{\rm{Precision\;}} + {\rm{\;Recall}}}}}$$
MCC is a universal evaluation metric used to assess the performance of classification models, measuring the correlation between predicted and actual labels. It applies to both binary and multiclass classification tasks. In this study, we applied MCC to evaluate the performance of binary classification models, specifically distinguishing between weed (presence) and non-weed (absence) in turfgrass images (Sokolova and Lapalme Reference Sokolova and Lapalme2009). It was calculated using the following equation:
 $${{\rm MCC} = {{{{\rm{TP}} \times {\rm{TN}} - {\rm{FP}} \times {\rm{FN}}}} \over {{\sqrt {\left( {{\rm{TP}} + {\rm{FP}}} \right) \times \left( {{\rm{TP}} + {\rm{FN}}} \right) \times \left( {{\rm{TN}} + {\rm{FP}}} \right) \times \left( {{\rm{TN}} + {\rm{FN}}} \right)} }}}}$$
Experimental Configuration
The experiments were conducted using the PyTorch (Meta) deep learning framework (v. 1.13.0) with CUDA 11.6 (NVIDIA). To ensure fairness of the experiments, none of the models were initialized with pretrained weights. All training and testing procedures were executed on a workstation equipped with an Intel® Core™ i9-10920X CPU @ 3.50 GHz, an NVIDIA RTX 3080 Ti GPU, and 128 GB of memory. The operating system used was Ubuntu 20.04.1.
The hyperparameter settings were as follows: the image size for the training process was set to 480 × 480 pixels, with stochastic gradient descent as the optimizer. The base learning rate was set to 0.1, and weight decay was applied with a value of 0.0001. The batch size was 16, and the learning rate policy was set to “step.” Momentum was set to 0.9, and the model was trained for 100 epochs. The output layer was configured with two nodes, corresponding to the binary classes (weed vs. non-weed), using a softmax activation function. This configuration ensured a controlled and consistent setup for evaluating the model’s performance.
Result and Discussion
Model Evaluation
Among the evaluated neural networks, VGGNet16, trained with 20,000 images, achieved the highest precision in the testing dataset, reaching 0.9990 (Table 3). It also exhibited the highest recall and F1 score and an MCC value exceeding 0.9960. Res2Net and ResNeXt152 also performed well, with accuracies of 0.9950 and 0.9970, respectively. Notably, ResNeXt152 had a recall of 0.9990, slightly surpassing VGGNet16, with similar F1 and MCC scores.
Table 3. Testing results of neural networks for classification of weeds while growing in turfgrasses.
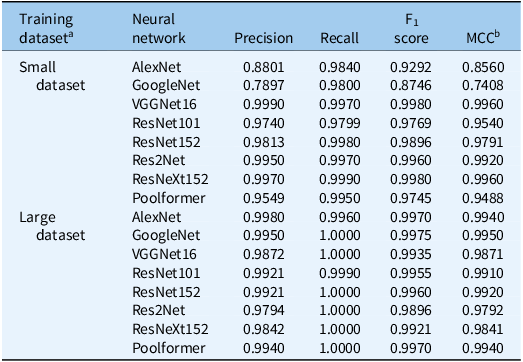
a The small training dataset contained 10,000 positive images (with weeds) and 10,000 negative images (without weeds), while the large training dataset contained 30,000 positive and 30,000 negative images.
b MCC, Matthews correlation coefficient.
Initially, AlexNet and GoogleNet showed lower performance, with precision of 0.8801 and 0.7897 and MCC values below 0.9. However, their performance improved significantly when trained with 60,000 images. AlexNet’s precision increased to 0.9980, surpassing VGGNet16, and its MCC reached 0.9940. GoogleNet achieved a perfect recall (1.0), a precision of 0.9950, and the highest MCC among all models.
ResNet152 and Poolformer achieved a recall of 1.0 with a precision of 0.9921 and 0.9940, respectively. While ResNet101 and ResNet152 showed further improvements, VGGNet16, Res2Net, and ResNeXt152 experienced overall performance declines, possibly due to their simpler architectures and limited learning capacities (Chollet Reference Chollet2021; Hastie et al. Reference Hastie, Tibshirani and Friedman2009). Models with complex structures excelled on smaller datasets but faced overfitting risks on larger datasets (Szegedy et al. Reference Szegedy, Liu, Jia, Sermanet, Reed, Anguelov and Rabinovich2015).
VGGNet16 and ResNeXt152 consistently demonstrated excellent performance across all metrics, with MCC values >0.98 and F1 scores >0.99. ResNeXt152 outperformed all models in recall and showed the best performance in confusion matrices (Figures 4 and 5). Therefore, this study selected the top two weights of ResNeXt152 for weed classification in various turfgrass regimes.
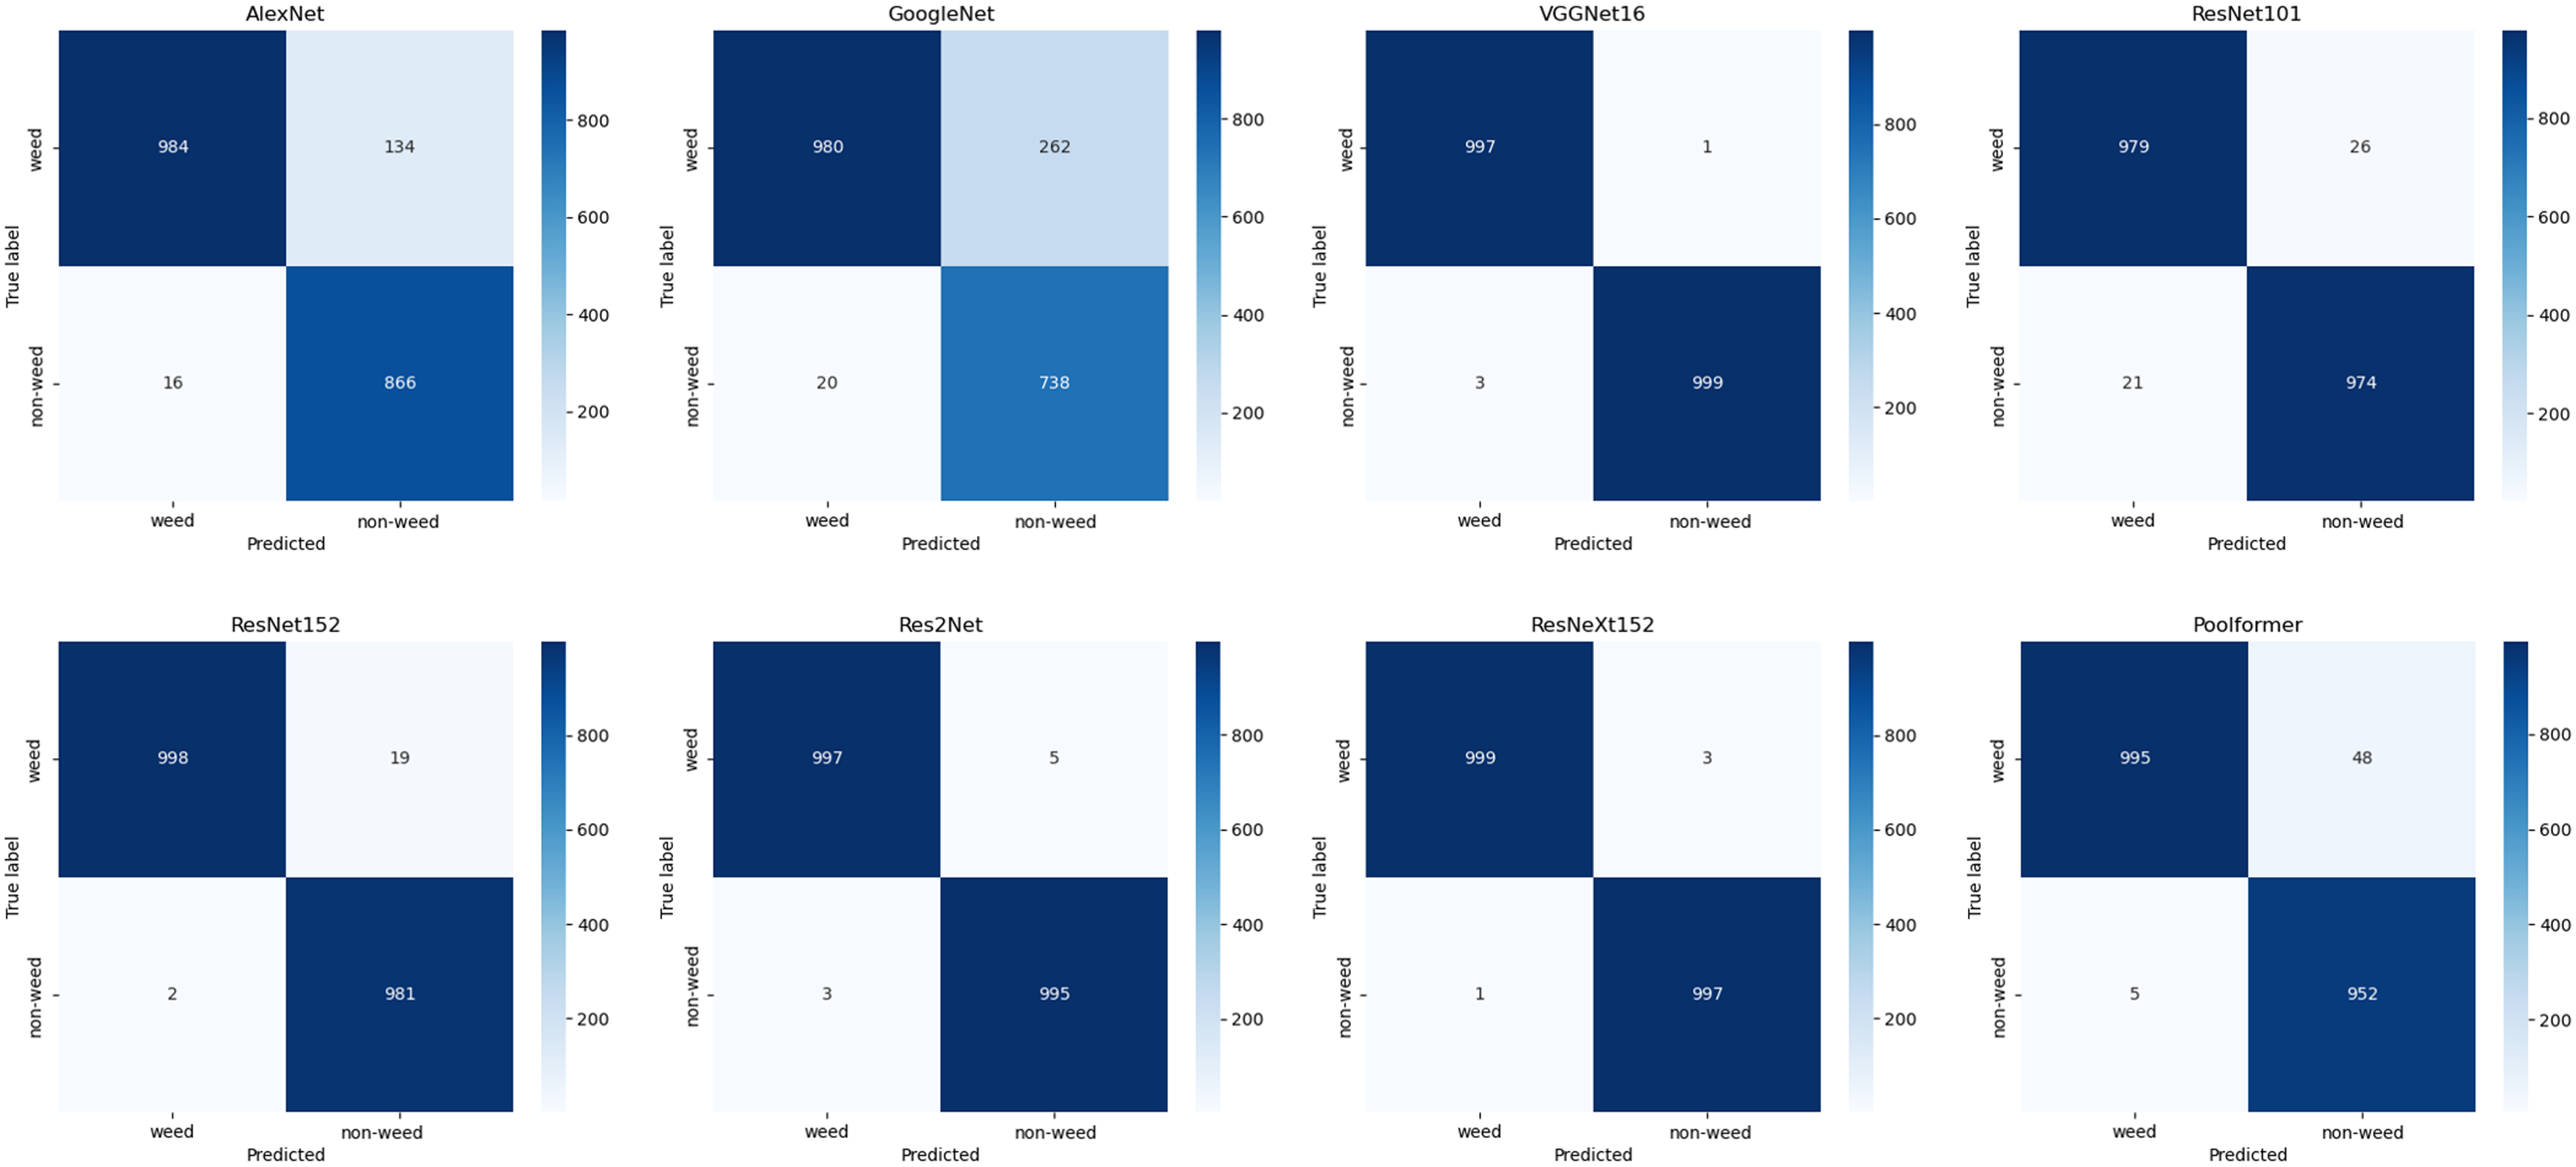
Figure 4. Confusion matrices of models trained on the small dataset and tested on the robustness testing dataset.
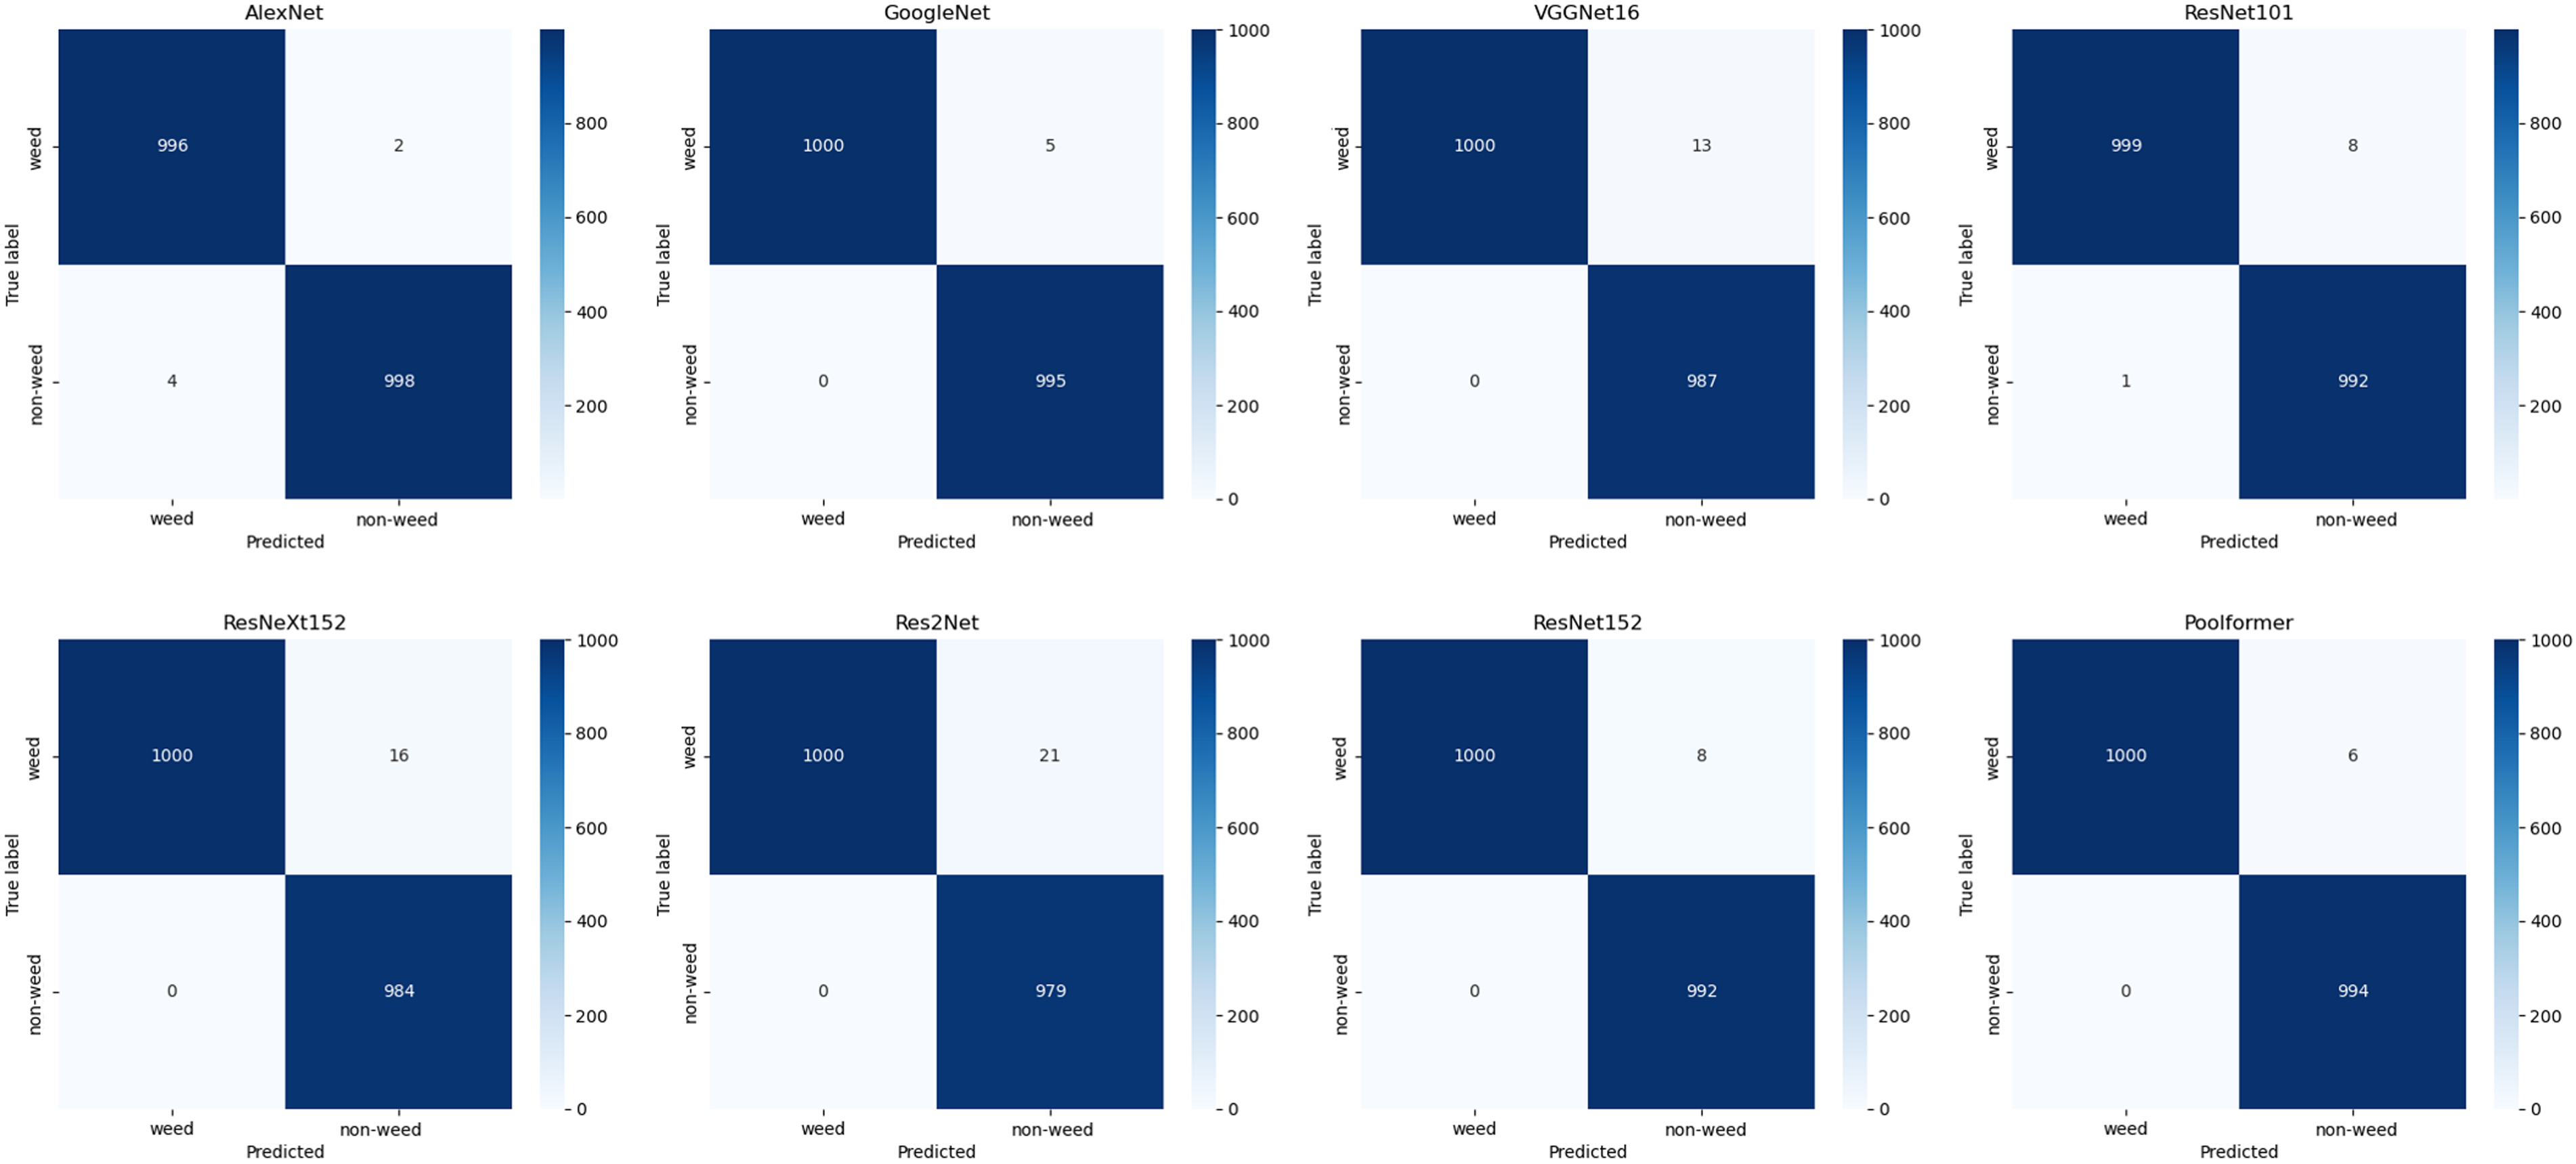
Figure 5. Confusion matrices of models trained on the large dataset and tested on the robustness testing dataset.
Single Weed Species Classification
Weed classification in turfgrass systems has been identified as a critical component of precision agriculture, with recent advancements in deep learning offering promising solutions for reducing herbicide use and improving management efficiency (Beckie et al. Reference Beckie, Ashworth and Flower2019; Bhakta et al. Reference Bhakta, Phadikar and Majumder2019). Previous studies have often been confined to collecting data from specific regions for training neural networks and subsequently evaluating them within the same geographic locations (Jin et al. Reference Jin, Liu, Chen and Yu2022c; Xie et al. Reference Xie, Girshick, Dollár, Tu and He2017; Yu et al. Reference Yu, Schumann, Cao, Sharpe and Boyd2019a, Reference Yu, Sharpe, Schumann and Boyd2019b). Although these studies have demonstrated effective weed detection, the testing datasets in these works were limited to specific turfgrass management regimes and geographic locations. In this study, we tested model performance across 24 diverse scenarios in China and the United States, encompassing various weed species, ecotypes, densities, and growth stages, as detailed in Table 4.
Table 4. Robustness testing results of ResNeXt152 for classification of weeds while growing in turfgrasses. a
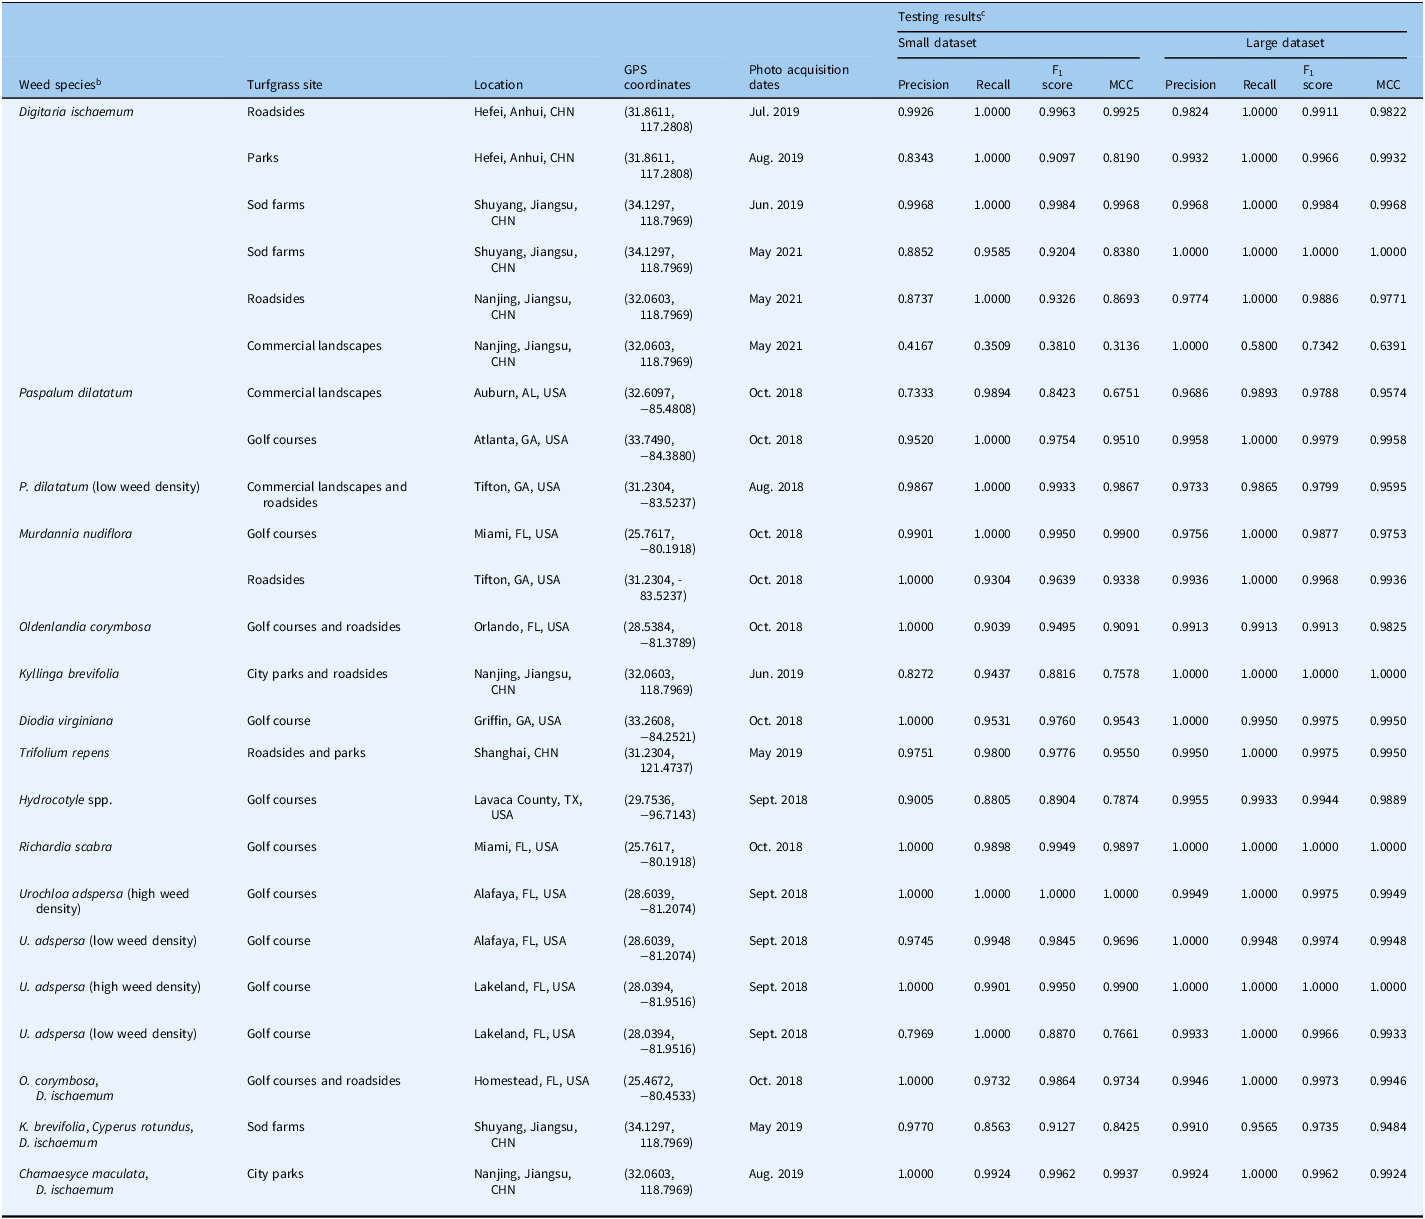
a Neural network was trained using small and large dataset.
b Low density indicates weed coverage in the images is visually less than 10% of the total image pixels; high density indicates the weed coverage in the images is visually more than 80% of the total image pixels.
c MCC, Matthews correlation coefficient.
The models trained with large datasets demonstrated consistent precision exceeding 0.97 across all classifications for D. ischaemum. They achieved F1 scores ranging from 0.988 to 0.998, with perfect recall of 1.0 for the first five scenarios. Even small datasets yielded strong performance, with MCC values above 0.81 across the same five scenarios. However, the classification of D. ischaemum in commercial landscapes was less effective, likely due to lower recall (below 0.58). These results confirm that ResNeXt152, when trained on large datasets, can accurately classify D. ischaemum at different growth stages in various turfgrass settings.
For P. dilatatum classification in Auburn, AL, USA, the model trained on a small dataset showed acceptable recall but lower precision (0.7333). In contrast, the model trained on the large dataset achieved a precision of 0.9686, emphasizing the importance of dataset size in minimizing false detections. Both models trained with large datasets performed well in other scenarios, with MCC exceeding 0.95, and the neural network maintained excellent performance even with low-density P. dilatatum, indicating that ResNeXt152 can accurately classify P. dilatatum in various turf conditions.
For M. nudiflora classification, tests were conducted at locations in Miami, FL, and Tifton, GA, USA. Both small and large datasets yielded robust results, with precision consistently above 0.97 and F1 scores not falling below 0.96. Recall rates were optimal in three out of four scenarios, further affirming the efficacy of ResNeXt152 in M. nudiflora classification.
Testing on single weed species at additional locations revealed that the model trained with a large dataset achieved near-perfect classification (precision and recall exceeding 0.99, MCC > 0.98) for species including Hydrocotyle spp., R. scabra, green kyllinga [Kyllinga brevifolia Rottb.], O. corymbosa, D. virginiana, and T. repens.
Finally, experiments with U. adspersa at two Florida golf courses demonstrated that the model trained on a small dataset performed well in low-density scenarios (precision: 0.9745, MCC: 0.9696), while the model trained on a large dataset achieved consistent excellence (all metrics > 0.99). These results highlight ResNeXt152’s ability to classify weeds across varying densities in bermudagrass regimes.
Mixed Weed Species Classification
After confirming the accuracy of ResNeXt152 in single weed species classification, the study extended its evaluation to complex scenarios involving the coexistence of multiple weed species. As previously reported, multiple classifier neural network models, including DenseNet, EfficientNetV2, ResNet, RegNet, and VGGNet, are capable of effective weed detection and classification (Jin et al. Reference Jin, Bagavathiannan, McCullough, Chen and Yu2022b). These models achieved high accuracy, with F1 scores of at least 0.946 on the test dataset. However, the training and test images used in this study were collected from geographically proximate areas, which may limit generalizability.
In the present study, the test locations for evaluating the model’s performance in classifying different weed species growing in turfgrass across multiple states in the United States and provinces in China were selected. The model performed exceptionally well in scenarios featuring multiple weed species. It achieved a precision and recall of 1.0000 and 0.9732 for D. ischaemum and O. corymbosa on a golf course and roadside when trained on the small dataset, and 0.9946 and 1.0000 when trained on the large dataset. In a sod farm with K. brevifolia, C. rotundus, and D. ischaemum, the large dataset model outperformed the smaller dataset model. In a city park with C. maculata and D. ischaemum, both models demonstrated outstanding performance, with evaluation metrics exceeding 0.99. In conclusion, ResNeXt152 proves effective in accurately classifying multiple weed species across turf management regimes. The experimental results demonstrate that data collected from a limited geographic area can be used to train a neural network capable of effectively classifying a wide variety of weed species in bermudagrass across different locations. While this study focused on bermudagrass, the methodology is potentially applicable to other cool- and warm-season turfgrass species. Future work will investigate its effectiveness for weed classification in these turfgrass types.
In summary, this study assessed the performance of eight classification neural networks trained with varying numbers of images. Through a comparative analysis, ResNeXt152 emerged as the most effective model among those evaluated. Additionally, this research highlights the practicality of utilizing a single neural network model for weed classification in turfgrass regimes with diverse uses across diverse geographic regions in both China and the United States. The study demonstrated that ResNeXt152 achieved robust classification performance across 24 different locations, covering 6 turf sites with distinct uses and 14 weed species with varying densities and growth stages—all using a single training session. Future research will focus on expanding testing and validation to additional global locations and integrating the developed neural models into the machine vision subsystem of a smart sprayer prototype.
Funding statement
This work was supported by the Key R&D Program of Shandong Province, China (grant no. 202211070163), the National Natural Science Foundation of China (grant no. 32072498), the Taishan Scholars Program, China, and the Weifang Science and Technology Development Plan Project (grant no. 2024ZJ1097).
Competing interests
The authors declare no conflicts of interest.


 Open access