INTRODUCTION
Upon the availability of a strain-specific vaccine for the second wave of the 2009 influenza H1N1 pandemic (H1N1pdm09) in the northern hemisphere, prioritization and roll-out strategies proved to be a challenging task for public health [Reference Brien, Kwong and Buckeridge1]. While Canada claimed one of the highest uptake rates of vaccination during H1N1pdm09, large discrepancies were encountered in vaccination policies across different jurisdictions. With disproportionate outcomes among populations at risk and specific ethnic groups during the first wave in Canada [Reference Kumar2, Reference Zarychanski3], immunization strategies largely deviated from normal practices of seasonal influenza epidemics [Reference Moghadas4, 5]. In the province of Manitoba, the focus of this study, the overall uptake rate of vaccination was about 37% of the total population. The programme initially identified groups at serious risk of infection and related complications for vaccination; however, vaccine quantities were below the expected supply for delivery, which affected the implementation of immunization for priority groups [6].
Several modifications to vaccination policies were made during the autumn wave of H1N1pdm09 in Manitoba. Vaccination roll-out initially targeted healthcare workers, essential service providers, and individuals at high risk for serious complications requiring hospitalization, including pregnant women. At the beginning of November 2009, priority groups were modified and included individuals with chronic medical conditions aged <55 years, immunocompromised individuals, children aged between 6 months and 5 years, residents of remote and isolated communities, individuals with Aboriginal ancestry (First Nations, Métis, Inuit), and homeless individuals. In the second week of November 2009, priority groups included individuals aged <18 years, and then expanded to all Manitobans in the following week. The challenges of vaccination programmes were largely attributed to inadequate vaccine supply, various modifications made to vaccination policies, lack of public knowledge on vaccine types with and without adjuvants, and evolving information on the number of vaccine doses required for adequate protection [6].
When modifying vaccination policies, two demographic variables, namely ethnicity and geographical location of residence, were used to define some priority groups in Manitoba. We sought to investigate the effect of these variables on the odds of H1N1pdm09 vaccination during the second wave for different age groups. For this study, we used epidemiological and vaccination data collected by Manitoba Health and the Manitoba Immunization Monitoring System (MIMS) to compare the odds of vaccination between First Nations (FN) and non-FN populations. We further compared the odds of vaccination between on-reserve and off-reserve FN populations. This study has a comparative advantage of using the surveillance databases created during H1N1pdm09 for the entire province of Manitoba, where about 11% of the population is registered with FN ethnicity [7].
METHODS AND MATERIALS
Population study
Manitoba is the easternmost prairie province of Canada (Fig. 1), with a population size of about 1.27 million. The Winnipeg Health Region is the largest urban centre of the province with a population size of 730 000. The second largest population setting in Manitoba is Brandon with a population size of 56 000. According to the 2011 census data, 60% of the FN population with registry status resides in an on-reserve area, which is specified by the Indian Act as a ‘tract of land’ [8]. Specifically, reserves are held by Her Majesty for the use and benefit of the respective bands for which they were set apart. This ethnic group refers to the Canadian Aboriginal peoples (with or without registry status) who are neither Inuit nor Métis [9].

Fig. 1. Map of Manitoba with boundaries of its 11 health regions used for epidemiological data collection, and locations of 63 on-reserve First Nation (FN) populations.
Data
We obtained MIMS vaccination data for the period of pandemic immunization between September 2009 and January 2010 for the province of Manitoba. MIMS is an electronic immunization (population-based) registry that was established in 1988, which maintains immunization records for all Manitobans registered with Manitoba Health [10]. The dataset was stratified by age group (5-year), ethnicity (FN identity), date of vaccination, and postal code of residence for each vaccinated individual. Data use was approved by the Human Research Ethics Board of the University of Manitoba, Canada, and the Health Information Privacy Committee of Manitoba. Using postal codes, we determined the association of each FN or non-FN vaccinated individual with an on-reserve or off-reserve residential area, and cross-validated this by linking the Aboriginal Affairs and Northern Development Canada database [11] to GeoPlanet Explorer [12]. During the period of the immunization programme, 465 419 individuals were recorded as recipients of the pandemic H1N1 vaccine, of which 744 were not residents of Manitoba (according to their residential postal code), and were therefore excluded from the database in our analysis. Vaccination rates of different age groups for on-reserve FN, off-reserve FN, and non-FN populations are presented in Figure 2 a. Weekly vaccination rates for these subpopulations are presented in Figure 2 b.
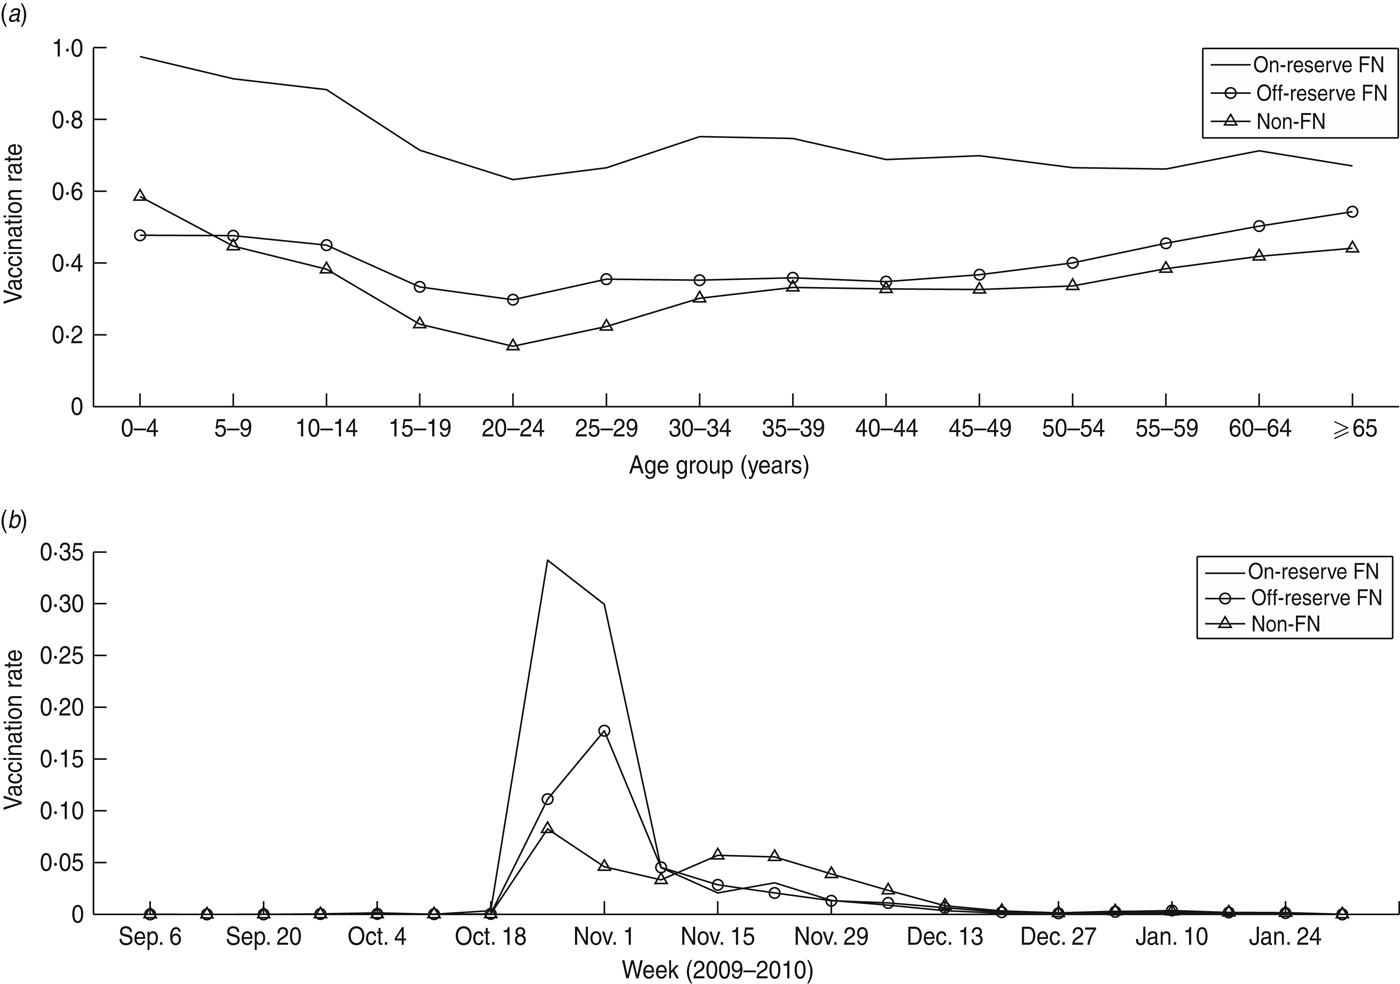
Fig. 2. Vaccination rates in Manitoba for non-First Nation (FN), on-reserve FN, and off-reserve FN populations in: (a) different age groups, (b) weeks of 2009–2010.
Relative vaccination ratios (RVRs)
Using Manitoba population demographics of different age groups in FN and non-FN populations, we calculated RVRs for FN and non-FN individuals in each age group, and used these ratios to compare the age distribution of vaccination. The RVR for the FN population was calculated as the proportion of vaccinated individuals in a given age group (
![]() $X_i $
) to the proportion of the population in the same age group (
$X_i $
) to the proportion of the population in the same age group (
![]() $Y_i $
):
$Y_i $
):
 $${\rm RVR}_i^{{\rm FN}} = \displaystyle{{\left( {{\displaystyle{{{\rm number\,of\,vaccinees\,in\,age\,group}\ i} \over {{\rm total\,number\,of\,vaccinees\,in\,all\,age\,groups}}}}} \right)} \over {\left( {{\displaystyle{{{\rm population\,size\,of\,age\,group}\ i} \over {{\rm total\,population\,size}}}}} \right)}} = \displaystyle{{X_i} \over {Y_i}}. $$
A similar expression was used to calculate the RVR for non-FN population age groups. A relative ratio >1 indicates that the corresponding age group was more likely to receive H1N1 vaccination compared to the population as a whole [Reference Mostaco-Guidolin13].
Statistical analyses
For each age group, we obtained the Binomial confidence intervals for both numerator (
![]() $X_i $
) and denominator (
$X_i $
) and denominator (
![]() $Y_i $
) in RVRs. In cases where the Normal approximation for the Binomial confidence interval did not apply, the Wilson score interval was calculated [Reference Wilson14]. From these confidence intervals for
$Y_i $
) in RVRs. In cases where the Normal approximation for the Binomial confidence interval did not apply, the Wilson score interval was calculated [Reference Wilson14]. From these confidence intervals for
![]() $X_i $
and
$X_i $
and
![]() $Y_i $
, we generated samples of size 100 following uniform distribution. We then used the delta method [Reference Oehlert15] to obtain the confidence intervals for RVRs using the following relationship between variance, expected values, and covariance of the variables:
$Y_i $
, we generated samples of size 100 following uniform distribution. We then used the delta method [Reference Oehlert15] to obtain the confidence intervals for RVRs using the following relationship between variance, expected values, and covariance of the variables:
For comparative analysis of age distribution between FN and non-FN populations, we performed non-parametric analyses of variance using the Mann–Whitney test [Reference Birnbaum and Neyman16] for the samples of RVR drawn from their associated Binomial distributions. We also performed non-parametric Kruskal–Wallis tests for comparative analyses of different age groups within each ethnic group [Reference Kruskal and Wallis17]. All tests were at a two-sided significance level of 0.05.
Regression analyses
We calculated the odds of vaccination for non-FN, on-reserve FN, and off-reserve FN populations. To determine the effect of FN ethnicity, we used logistic regression and included the variables of age and ethnicity. In this analysis, the 0–4 years age group and the non-FN population were considered as the baseline scenarios for their respective categories of age and ethnicity. To assess the effect of (on-reserve) residence on the odds of vaccination given FN ethnicity, we adjusted the model a priori for age and place of residence (i.e. on-reserve, off-reserve). In this model, we considered the 0–4 years age group and off-reserve residency as the baseline scenarios for their respective categories. The statistical significance of adding the interaction terms was assessed by using likelihood ratio tests.
RESULTS
Comparative analysis of age distribution
Overall, we observed a V-shaped pattern for the age distributions of RVR for both FN and non-FN populations, with mean RVR values >1 for groups aged <15 years, decreasing to values <1 for groups aged between 15 and 49 years of age (Fig. 3). RVR values for ⩾50 years age groups were equivalent to, or higher than, the population as a whole.
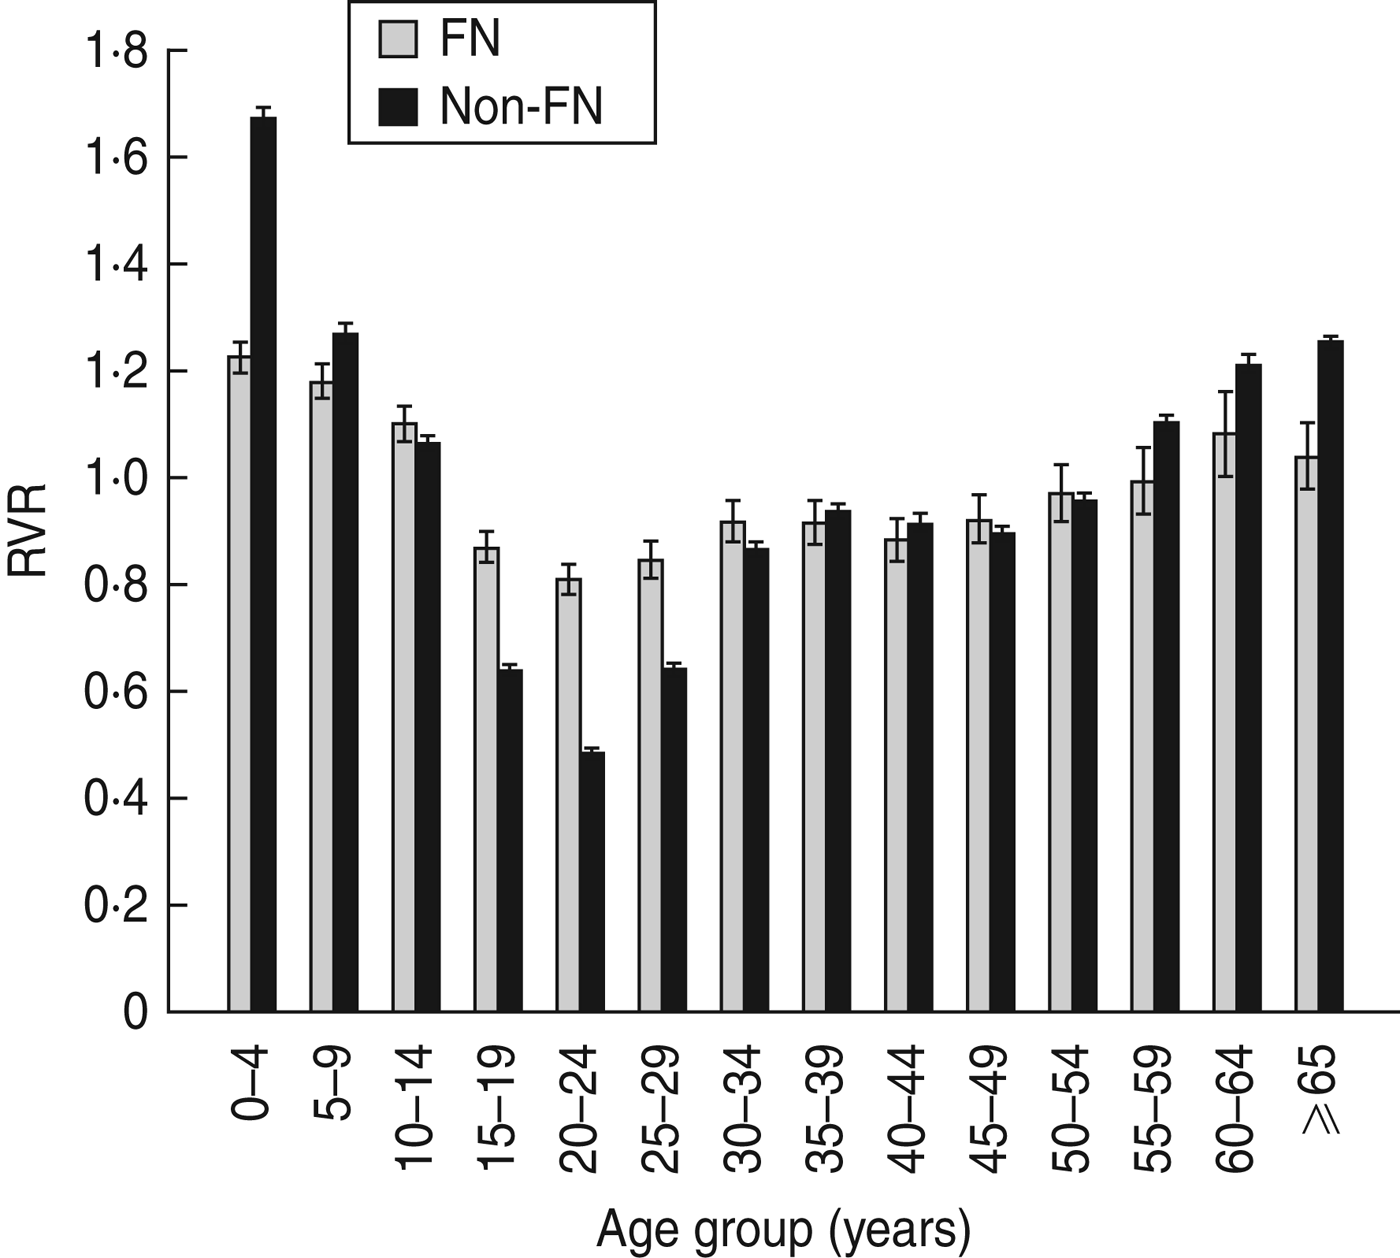
Fig. 3. Relative vaccination ratios (RVRs) for First Nation (FN) (![]() ) and non-FN (■) populations in different age groups, with 95% confidence intervals. These ratios were calculated as the proportion of vaccinees in each age group to the proportion of the population in the same age group.
) and non-FN (■) populations in different age groups, with 95% confidence intervals. These ratios were calculated as the proportion of vaccinees in each age group to the proportion of the population in the same age group.
When comparing different age groups in the FN population, we found a significant difference between the mean values of RVR for groups aged <15 years compared to those aged 15–49 years (with maximum P values of < 0.001 using Kruskal–Wallis test). The difference in the mean RVR corresponds to a >1.5-fold decline from 1.23 [95% confidence interval (CI) 1.20–1.26] for the 0–4 years age group to 0.81 (95% CI 0.78–0.84) for the 20–24 years age group. We observed a similar difference in RVR values for the non-FN population; however, the decline was >3.4-fold from 1.67 (95% CI 1.65–1.69) for the 0–4 years age group to 0.48 (95% CI 0.47–0.49) for the 20–24 years age group.
In order to assess the effect of modifications on vaccine prioritization, we compared the temporal patterns of RVR between the durations of vaccination from September to the end of October, and from beginning of November to January 2010 in both FN and non-FN populations. Figure 4(a, b) (light gray bars) shows that the age trend of RVR for the second period (November–January) generally follows a V-shaped pattern, similar to the RVR pattern for the entire vaccination period. We observed a significant increase in RVR (from <1 to ~1.4) in the 0–4 years age group of the FN population (Fig. 4 a), reflecting the modification to prioritization at the beginning of November to include children aged <5 years, individuals with Aboriginal ancestry, and remote and isolated communities. It is important to note that the Aboriginal population is significantly younger than non-Aboriginal population in Canada [18], with a median age of 25 years that is 15 years below the median age of non-Aboriginal populations. This may explain the lack of a significant change in RVR for the 0–4 years age group in the non-FN population. Furthermore, a large number of remote and isolated communities in Manitoba are Aboriginal populations, with about 30% of the population aged <14 years [18]. By contrast, we observed a significant increase in RVR (from <0.8 to ~1.4) for the ⩾65 years age group in the non-FN population (Fig. 4 b), when priorities were extended to include all Manitobans on 18 November. These observations suggest that the modifications in vaccination had the largest impact on RVRs for the youngest age group in the FN population and the oldest age group in the non-FN population.

Fig. 4. Relative vaccination ratios (RVRs) for (a) First Nation (FN) and (b) non-FN populations for the vaccination periods of September–October (■) and after October 2009 (![]() ), in different age groups, with 95% confidence intervals. These ratios were calculated as the proportion of vaccinees in each age group to the proportion of the population in the same age group.
), in different age groups, with 95% confidence intervals. These ratios were calculated as the proportion of vaccinees in each age group to the proportion of the population in the same age group.
Effect of ethnicity
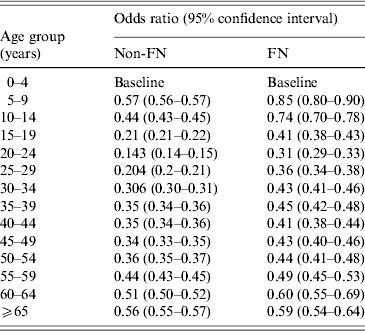
Compared to the non-FN population, the odds of vaccination was more than 2.8 times higher for the FN population with a mean value of 2.83 (95% CI 2.76–2.87). In all age groups, the odds of vaccination for the FN population were at least twofold higher (P < 0.001) than those of the non-FN population, and as high as 4.4-fold for the 20–24 years age group (odds ratio 4.47, 95% CI 4.26–4.69]. The hypothesis that the two models, including and excluding the interaction between age and ethnicity, have no significant difference (P values < 0.001) was rejected, indicating that the effect of ethnicity is significant, regardless of the variable age. Overall, all groups >5 years in both FN and non-FN populations had a lower odds of vaccination compared to their baseline age group of 0–4 years (Table 1).
Table 1. Odds ratios of vaccination for First Nation (FN) and non-FN populations in different age groups with 95% confidence intervals
Effect of geographical residence
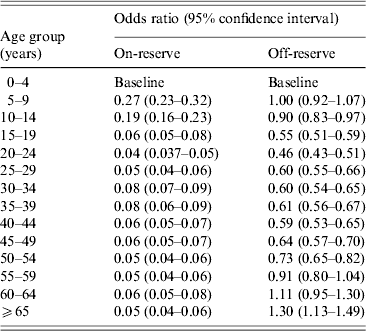
All age groups in on-reserve FN populations had higher odds of vaccination compared to the corresponding age groups in non-FN or off-reserve FN populations. We found that the age distribution of vaccination for on-reserve FN population was significantly different from that for off-reserve FN population (P < 0.001). Except for the ⩾65 years age group, odds of vaccination for on-reserve FN residents were equivalent to, or higher than, off-reserve FN residents in all other age groups. In the on-reserve FN population (Table 2), odds of vaccination for all age groups were significantly below the baseline age group of 0–4 years. In off-reserve FN population, only the ⩾65 years age group had higher odds of vaccination compared to the baseline age group of 0–4 years. Applying the likelihood ratio test, we found a significant difference between the two models with and without incorporating the variable of residence (P < 0.001), indicating that the geographical location of residence significantly influenced the odds of vaccination for the FN populations. Overall, the on-reserve FN population was 5.15 times (95% CI 5.00–5.30) more likely to receive vaccination compared to the off-reserve FN population.
Table 2. Odds ratios of vaccination for on-reserve and off-reserve First Nation (FN) populations in different age groups with 95% confidence intervals
Temporal odds of vaccination
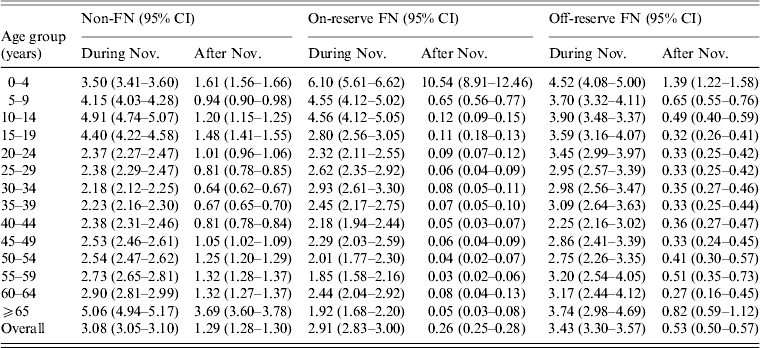
We compared the odds of vaccination during and after November 2009 with the odds of vaccination for the period of September–October as the baseline in each category of non-FN, on-reserve FN, and off-reserve FN populations. To calculate the odds ratios, the number of individuals vaccinated in each age group before November was discounted from the total population size of the same age group for vaccination periods during and after November. The results show that the odds of vaccination during November 2009 were increased in all age groups (Table 3). The highest odds ratios during November in the non-FN population was associated with the ⩾65 years age group. Except for the youngest age group, the odds of vaccination after November were reduced in all other age groups of the FN population. For the non-FN population, several age groups aged >4 years had odds ratios >1 for the vaccination period after November. However, odds ratios for all age groups aged >4 years reduced significantly to <1 after November for both on-reserve and off-reserve FN populations (Table 3).
Table 3. Odds ratios (OR) of vaccination for non-First Nation (FN), on-reserve, and off-reserve FN populations in different age groups with 95% confidence intervals (CI). Odds ratios correspond to the two vaccination periods: during the month of November, and after November 2009, compared with the vaccination period of September–October 2009 as baseline
DISCUSSION
Using vaccination data from MIMS for H1N1pdm09, we observed significant variations in the age distribution of vaccination between FN and non-FN populations. The RVRs for both FN and non-FN populations fell significantly for age groups between 15 and 30 years, compared to age groups aged <15 years (Fig. 3). A possible explicator for this sharp decline could be the time-lag between start of vaccination in September and expansion of priority groups in mid-November to include people aged >5 years and <19 years, and then to all Manitobans in late November. Given that the peak of H1N1pdm09 infection in the autumn wave occurred during the second week of November in Manitoba [Reference Mostaço-Guidolin19], the time-lag for prioritization may have been a factor in decisions to refuse vaccination by those who have not been considered as priority groups during the early stages of vaccination campaigns.
We also observed higher RVRs in age groups between 15 and 29 years in FN populations compared to non-FN populations (Fig. 3). Prioritization of remote and isolated communities, and those with Aboriginal ancestry well before the peak of the epidemic could have raised the rates of uptake vaccine in FN populations (Fig. 4), particularly in those with on-reserve residency. Other factors contributing to higher vaccine uptake rates could include the disproportionate rates of infection and hospitalization experienced by FN populations during the first wave [Reference Mostaco-Guidolin13], prevalence of chronic and comorbid conditions [Reference Kumar2–Reference Zarychanski3] that were considered as factors for vaccine prioritization, and limited access to critical care in many remote and isolated communities [Reference Kumar2], where prevention and vaccination may take precedence over control and treatment. When comparing the RVRs between September–October and after October 2009, the most conspicuous finding is the sharp increase in RVR (from <1 to ~1.4) for the 0–4 and ⩾65 years age groups in FN and non-FN populations, respectively (Fig. 4). Given that the average age of the FN population is significantly lower than that of the non-FN population, this increase reflects the modifications in vaccine prioritization.
Analysis of regression models indicates that ethnicity had a significant impact on odds of vaccination. Overall, individuals with FN identity were about three times more likely to receive pandemic vaccine compared to non-FN individuals. Our results show that the odds of vaccination in all age groups of the FN population were at least twofold higher than the corresponding age groups in the non-FN population. Further analysis of geographical location of residence for FN populations shows that on-reserve residency was associated with fivefold higher odds of vaccination compared with off-reserve residency.
Our study provides an analysis of the relationship between demographic and population variables of age, ethnicity, and place of residence in the context of vaccination against H1N1pdm09. Major strengths of this analysis include the use of a large dataset for the entire province with a large FN population, covered by a single healthcare system. The findings support the hypothesis that ethnicity and geographical location of residence significantly influenced the odds of vaccination. Decisions on prioritization may have been a contributing factor on the impact of these variables; however, acceptance of vaccination may also be affected by divergent perceptions about the risks of vaccine vs. the risks of infection, resulting in variable uptake rates in different population settings or age groups [Reference Dushoff20]. Other confounding factors may include the severity of disease outcomes, and the extent to which treatment of ill individuals is effectively implemented. Furthermore, transmission patterns, access to healthcare, and the composition of risk groups may vary widely between distinct population settings and ethnic groups, and between different remote and isolated communities (e.g. FN on-reserve and off-reserve). These factors could play a substantial role in determining the rates of vaccine acceptance and disease outcomes [Reference Weycker21–Reference Bowman22], and should be considered in the process of decision-making regarding prioritization and roll-out strategies for influenza vaccination policies.
Although the findings highlight the importance of population and demographic variables in pandemic vaccination, our study is still subject to some limitations. The focus here has been on vaccination during H1N1pdm09; however, a comparison with seasonal influenza may identify the magnitude and direction of the impact of ethnicity and geographical location of residence on odds of vaccination. While MIMS databases provide summary of seasonal influenza vaccination, we did not have access to detailed information on vaccine uptake rates for FN and non-FN populations that would include residence and age stratifications. Due to the lack of specific census data for the population profiles of non-FN individuals residing in an on-reserve area, our study precludes the comparison between FN and non-FN populations for this geographical location of residence. However, given that the proportion of on-reserve populations with non-FN identity is small compared to those with FN identity, such comparison may be subject to a large variance. Our study has further limitations in terms of distinction between ethnic groups in Aboriginal populations. The MIMS databases of H1N1pdm09 vaccination were stratified by FN and non-FN individuals for ethnicity, in which FN status was determined by merging demographic data with a copy of the Indian Registry obtained from Indian and Northern Affairs Canada. It is entirely possible that some individuals with FN ancestry but without registry were counted as non-FN. Nevertheless, we expect that our results remain robust, suggesting that vaccination policies and acceptability of vaccine could be influenced by demographic and geographical variables.
CONCLUSIONS
Ethnicity and place of residence are found to be significant confounding factors in determining the odds of vaccination against H1N1pdm09. Prioritization of target groups that involve these demographic and geographical variables can influence uptake rates of vaccine, especially in vulnerable populations (e.g. Aboriginal peoples) and remote and isolated communities in northern latitudes.
ACKNOWLEDGEMENTS
This work was supported in part by the Canadian Institutes of Health Research (grant no. 114932). The funder had no role in data collection, analysis, manuscript preparation or decision to publish. The authors thank the editor and reviewers for their insightful comments that have improved the quality of the paper.
DECLARATION OF INTEREST
None.


