


1. Introduction
Risks are often considered the “effect of uncertainty on objectives” (Aven Reference Aven2011; Oehmen et al. Reference Oehmen, Ben-Daya, Seering and Al-Salamah2011), and as such, the management of risk works at minimising the impact of risks both at the product level (e.g., keeping the product safe for the users) and at the process level (keeping the project budget and schedule according to the plan; Rhodes, Valerdi & Roedler Reference Rhodes, Valerdi and Roedler2009). While risk management is an established practice in the industry, it is becoming increasingly difficult. As products are becoming more complex and advanced, the number of indirect interactions among the system elements that cause complex propagation effects on both the products and the process (which are difficult to track and measure) keeps increasing. ‘Proximity’ effects – interactions between components without direct contact – are an example of these indirect interactions. A magnetic field is a typical example; however, fields may include other physical phenomena, such as vibrations and heat (Otto et al. Reference Otto, Hölttä-Otto, Sanaei and Wood2019).
Managing the risks caused by indirect interactions is a challenging task, as it involves a complex decision-making process where the probability and consequences of failures are traded against the cost and benefits of mitigation strategies (e.g., inserting protection mechanisms). The aim of this paper is to understand how indirect interactions among system elements impact the efficiency of the design process, as well as the designers’ ability to change the design so that product risks are mitigated effectively. To this end, this paper defines a novel experimental approach where designers are confronted with a design task that introduces indirect interactions. The approach defines a set of hypotheses for the efficiency of the design process, as well as the effectiveness of the risk treatment strategies chosen by the designers. The analysis of the use of different risk assessment tools allows to understand the influence of indirect interactions on product and design process objectives.
2. Literature review
To formulate hypotheses for the experimental approach, the generic framework for risk management suggested by ISO 31000:2018 is adopted (Figure 1).
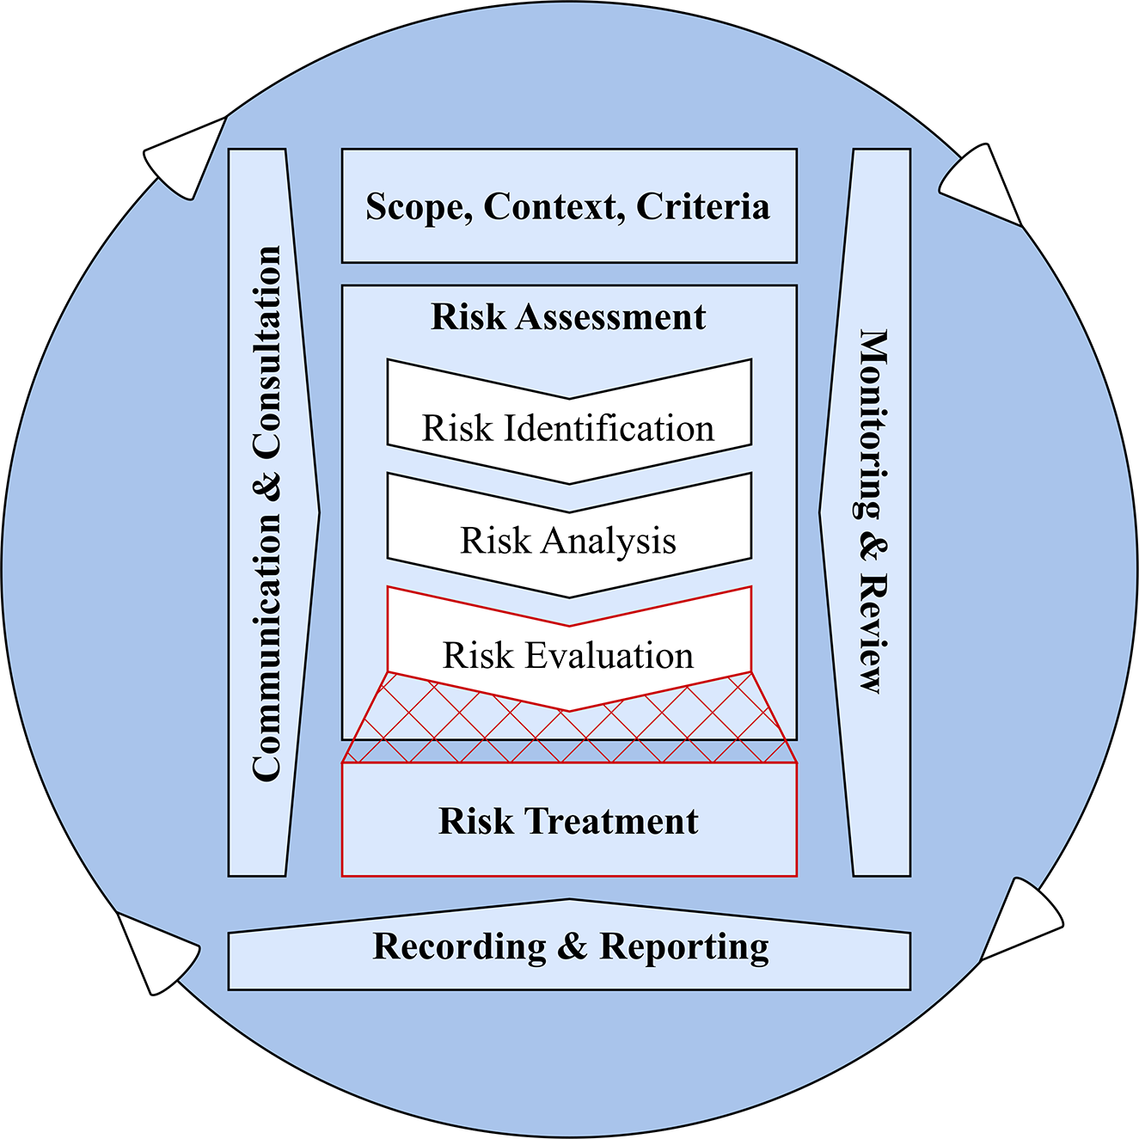
Figure 1. Risk management process, comprised of 8 steps (ISO 31000:2018). This paper focuses mainly on the boundary between the risk evaluation and the risk treatment steps.
The ISO 31000 risk management framework provides a universal approach applicable to various industries and problem scopes, and consists of seven main steps:
-
1. Communication and Consultation – Engaging stakeholders at all stages to share information and coordinate decisions.
-
2. Establishing the Context – Defining objectives, scope and criteria for risk management, considering both internal and external factors.
-
3. Risk Identification – Identifying sources of risk, potential impacts and significant events.
-
4. Risk Analysis – Assessing risks in depth to determine evaluation methods and necessary data.
-
5. Risk Evaluation – Prioritising risks based on analysis to decide which need treatment. (Steps 3–5 form the Risk Assessment process.)
-
6. Risk Treatment – Selecting and implementing strategies to address prioritised risks.
-
7. Monitoring and Review – Continuously tracking risks and refining the risk management process as needed.
-
8. Recording and Reporting – Documenting risk-related activities, decisions and outcomes to ensure transparency, accountability and continuous improvement.
In risk management, a distinction is often made between product-level risks – related to a system’s technical performance and reliability – and product development process-level risks, which pertain to schedule adherence, resource allocation and development uncertainties. This study focuses primarily on managing product risks arising from unintended interactions while recognising that process-level risks can also be affected by early risk evaluation and treatment strategies.
This paper is centred on the risk assessment (steps 3–5) and the risk treatment (step 6) steps from ISO 31000, since in these steps the design can be greatly influenced by different choices and decisions. Among these steps, the identification of sources of risk (e.g., incorrect or evolving requirements) is currently receiving research attention (Wied et al. Reference Wied, Oehmen, Welo and Pikas2021). Analogously, the risk analysis process is well-researched, with a plethora of methods and tools being investigated (Kunreuther Reference Kunreuther2002). Aven (Reference Aven2016) highlighted how technology can enhance risk analysis methods, while underscoring the need for longitudinal and comparative studies to address limitations in existing models. Less research has been conducted to study how designers prioritise risks based on the analysis and select mitigation strategies. Increasing this understanding is crucial as there seems to be a mismatch between the number of ‘issues’ that are prioritised by designers (with the aid of risk analysis methods) and the number of actual issues that are discovered in the process. As an example of this mismatch, Figure 2a illustrates the potential effect that the use of Failure Mode and Effects Analysis (FMEA), a popular risk assessment tool (Koark & Beul Reference Koark and Beul2017), has on the number of ‘issues’ that are identified and “front-loaded” by a development team.
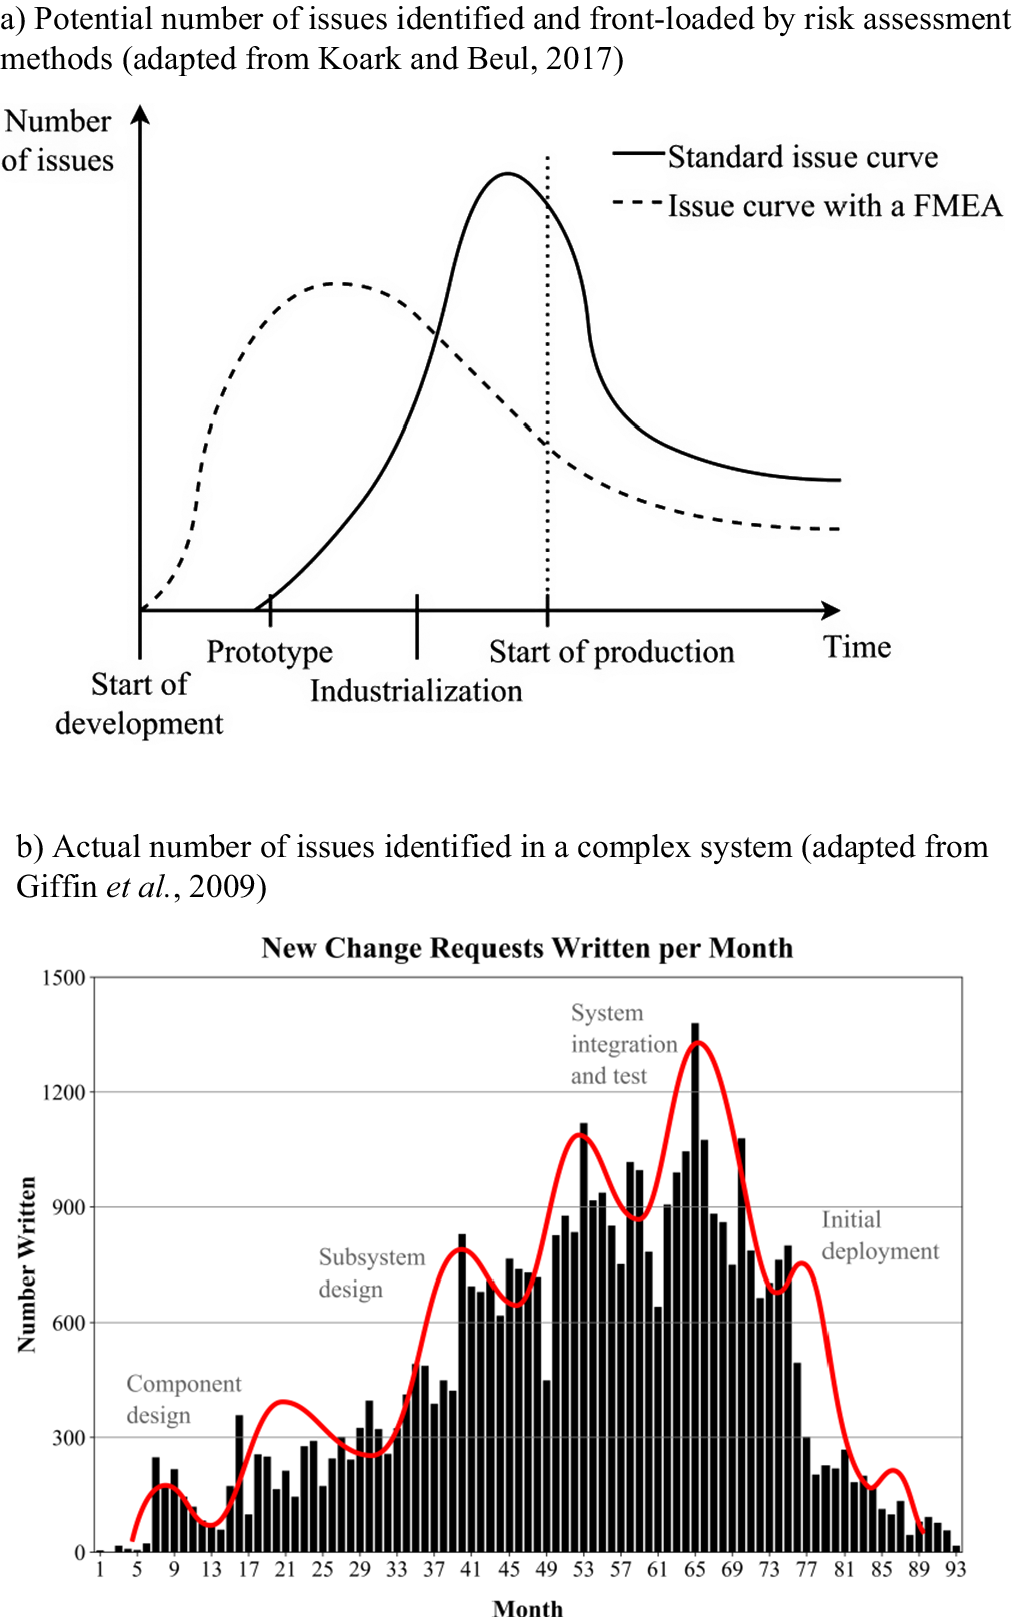
Figure 2. (a) Potential number of issues identified (based on risk assessment methods), adapted from (Koark & Beul Reference Koark and Beul2017), (b) Actual number of issues identified in a complex system, adapted from (Giffin et al. Reference Giffin, de Weck, Bounova, Keller, Eckert and Clarkson2009).
Potential product weaknesses are detected earlier, enabling more effective issue resolution and resulting in fewer unresolved issues at market launch. Figure 2b instead shows the actual number of issues identified and resolved during the development project of a complex sensor system Giffin et al. (Reference Giffin, de Weck, Bounova, Keller, Eckert and Clarkson2009), measured as the number of change requests per month written. Although not addressing risk especially, this research highlights how the number of issues identified in the early phases is still limited compared to the late phases.
Risk in complex systems arises from two fundamental aspects: (1) Sources of uncertainty, which introduce unpredictability into the design and development process, and (2) Impact categories of risk, which describe how these uncertainties affect key system objectives. Sources of uncertainty include factors such as technology immaturity, incomplete specifications and unintended interactions, while impact categories define the consequences, such as cost overruns, schedule delays or degraded performance. In this study, we focus on risks stemming from unintended technical interactions (a source of uncertainty) and analyse their cascading effects on product-level objectives (e.g., reliability and safety) and to a lesser extent development process-level constraints (e.g., cost and rework time). Recognising this distinction enables a structured approach to risk assessment, connecting process-level risks to broader system outcomes. These risks share important characteristics with what Renn et al. (Reference Renn, Laubichler, Lucas, Kröger, Schanze, Scholz and Schweizer2022) describe as systemic risks – particularly in their potential for cascading effects that extend beyond the immediate point of failure.
The fact that the system has many indirect interactions causes major propagation effects downstream or risks that may have low probability and impact on direct interactions. The complexity of the interactions in a system often causes practitioners to overestimate the risk of very low-probability events and underestimate that of high-probability events (Lomborg Reference Lomborg2003). For these reasons, the literature stresses the need to facilitate the communication of the ‘residual risk’ (Maiworm, Hammann & Schleich Reference Maiworm, Hammann and Schleich2023) that is not included in rational risk assessment procedures. Also, the choice of the appropriate risk treatment implies the determination of a risk tolerance (e.g., the willingness to accept a certain level of risk to achieve project goals), which is also critical in risk management. The probability and consequences of failure against potential benefits should be considered early and revisited throughout the design process (Bossuyt et al. Reference Bossuyt, Hoyle, Tumer and Dong2012). Despite their importance, the cyclic loops between the risk evaluation process and the risk treatment process in practice have not yet been studied in detail.
This paper explores further the connection between risk evaluation and the risk treatment process on the design process and product, focusing on these two high-level research questions:
-
1. What is the role of indirect interactions on (1) the efficiency of the design process and (2) the efficacy of the product?
-
2. How can the use of design supports improve (1) the efficiency of the design process and (2) the efficacy of the product?
These two high-level questions have been studied through the definition of an experimental approach.
3. Experimental approach
The experiment aims to replicate an industrial environment in which an engineering design team executes a complex design decision gate (Cooper Reference Cooper2008) at a fictitious truck manufacturer. We formed 14 teams with a total of 68 participants. Each team was tasked with describing a new design after analysing three design proposals for a truck.
-
- Seven teams (Teams 1–7) with a mix of 17 industrial experts representing industrial companies, including three automotive Original Equipment Manufacturers (OEMs) and 27 senior and junior researchers working within complex systems at 13 international universities.
-
- Two teams (Teams 8 and 9), with seven industrial experts from a Swedish Car OEM.
-
- Five teams (Teams 10–14), with 17 international students enrolled in Mechanical Engineering master’s programs. Some students had previous industrial experience.
Table 1 provides a summary of the teams and their industrial experience. The participants were assigned to the teams. The teams comprised three to six participants.
Table 1. Summary of teams involved in the study
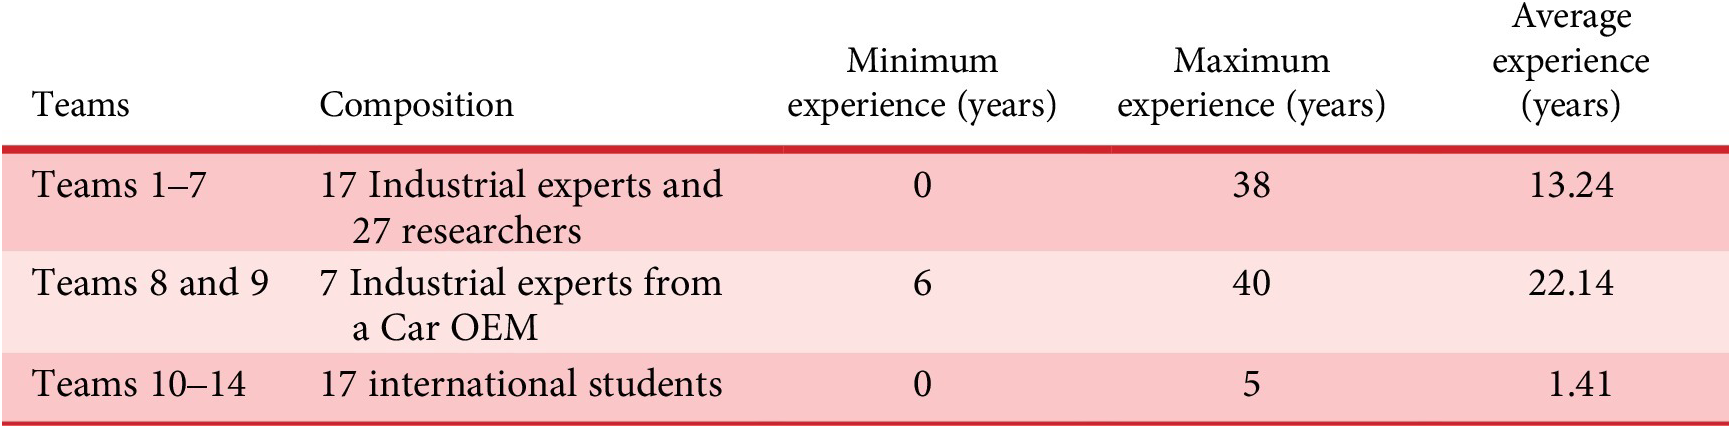
The members of Teams 1–7 mostly had research experience, whereas Teams 8 and 9 mostly had industrial experience. Additionally, the members of Teams 1–9 had heterogeneous experience levels, whereas those of Teams 10–14 were more homogeneous.
3.1. Data collection
To be able to measure the behaviour of the design teams on such a simulated complex decision gate, we decided to track the use of five design supports containing a different set of information. When participants logged into the web application, the interactions that occurred with the five different supports were automatically recorded in the database. The interactions recorded were the “transition clicks” that participants made in the application. Since the design supports were divided into different “tabs,” it was possible to record the time stamps when the participants transitioned from one support to the other. It must be noted that all participants had access to the web application through their laptops and phones. However, they were free to decide whether to look at the web application individually, divide the group into smaller groups, or look through the application from only one device.
Figure 3 shows a hypothetical distribution of the use of the different supports contained in the web application over the course of the design session (shown as a stacked area chart). The figure allows to visualise the generic design process followed by the design teams, as well as the independent variables (IV) and the dependent variables (DV) that were measured and that represent the key variables for the hypotheses made. It should be noted that these distributions are hypothetical and that the participants were free to move back and forth between the different tabs as they desired.
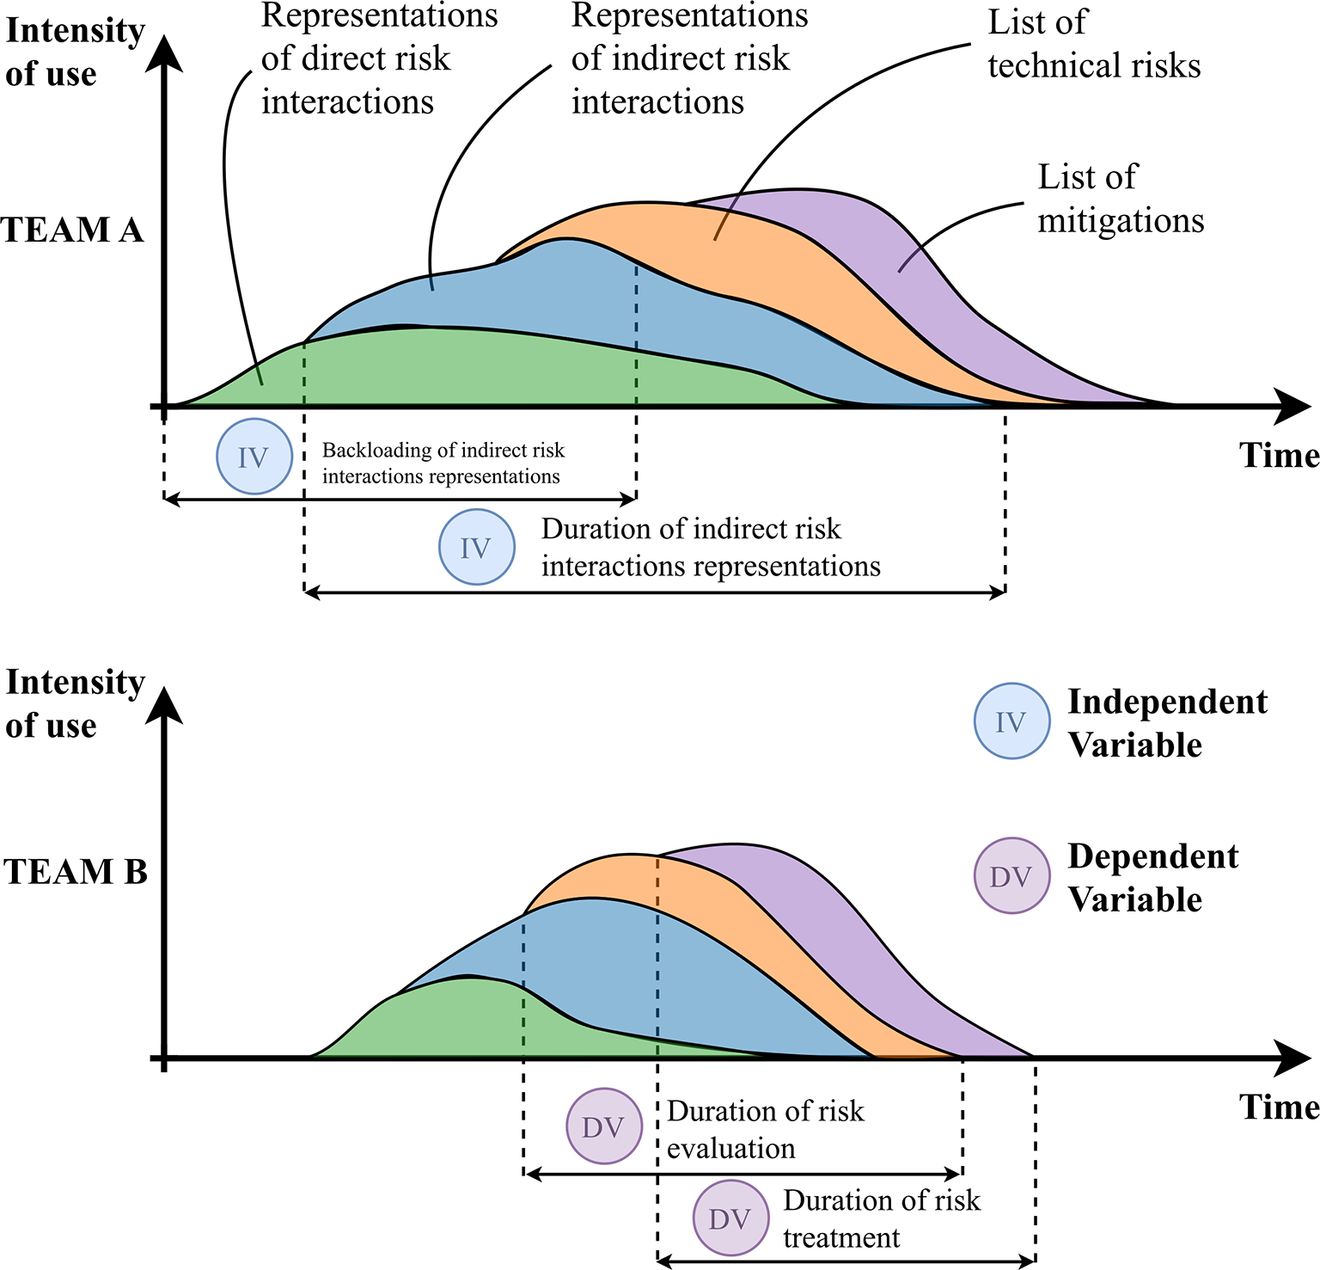
Figure 3. Hypothetical distribution of the use of design supports over the course of the design session, together with the independent variables (IV) and dependent variables (DV) relevant to the experiment.
The first design support was a “value model” that precomputed the company’s profit for the 3 systems onto 3 different applications. The value information was computed such that there was no univocal answer regarding the best system. The use of this support was mainly meant to allow the teams to become familiar with the design problem and trade-offs involved. Therefore, its use does not represent a critical variable for this experiment.
For the experiment, much stronger attention was given to the other four design supports, divided into:
-
- representations of direct risk interactions (green area in Figure 3): to this category belonged 1) a technical risk registry, which represented a ‘simplified FMEA’, where the risk of failure for each component was computed on a scale of 0–1 (0 = low risk, 1 = high risk) and 2) a Component-based Design Structure Matrix (b-DSM; Browning Reference Browning2016) visualising how components were in direct contact with each other (therefore, the interfaces were binary).
-
- representations of indirect risk interactions. (blue area in Figure 3): to this category belonged (1) a component-based DSM containing the spatial distances (in mm) between the components (d-DSM) and (2) Risk propagation matrices (r-DSM), where the direct risks contained in the technical registry were precomputed by combining the Change Propagation Method (CPM) by Clarkson, Simons, and Eckert (Reference Clarkson, Simons and Eckert2004) and the method by Alonso Fernández, Panarotto, and Isaksson (Reference Alonso Fernández, Panarotto and Isaksson2024). This method uses the same algorithm as in CPM but differs in terms of how the direct Likelihood (L) and Impact (I) values are calculated. The likelihood of propagation is estimated based on the spatial distances between the components (therefore, the distance values contained in the matrix).
While there are numerous risk assessment methods, such as Fault Tree Analysis (FTA) or Hazard and Operability Study (HAZOP) (ISO/IEC 31010 2019). The focus of this paper is to identify the extent to which designers manage the technical risks caused by indirect interactions. Therefore, we were interested in studying both direct risk representations (FMEA and b-DSM) and indirect risk representations (d-DSM and r-DSM). Given the time limit of the design sessions (between 3 and 6 hours), we have chosen the DSM format due to its compactness (Browning Reference Browning2016). Since each of the 3 systems contains 15 components on average (therefore with 15 × 15 = 225 possible interactions to be multiplied for 3 systems), showing large Fault Trees representing all these interactions would have made the design sessions complicated to perform. The risk would have been that the participants would focus only on the computation results of the direct interactions, rather than on the propagation of the indirect interactions (which was the main focus of the study). For these reasons, the DSM format was chosen so that the teams could focus on reading the indirect risk matrices in a more nuanced fashion and focus on the trade-off involved among the direct risks (from the technical registry) and their propagation through the system due to spatial “closeness.” For example, the hub was not in direct contact with the filter, with a relatively low direct risk (from the risk registry). However, their overall risk propagation was high, due to their physical closeness to other “risky” elements of the system. In contrast, the other two elements not in direct contact, the servo valve and the filter, are still not in direct contact and close to each other (500 mm) but still rather isolated spatially from the rest of the system. This resulted in a relatively low overall risk of propagation owing to the low risk in the risk registry and the distance of these components to more risky elements.
The tabs in the web application were placed in such a way that after reading this information, the teams were asked to select which components were the most critical from a risk perspective (orange area in Figure 3). This was assumed to represent the “risk evaluation phase” according to the definition of ISO 31000:2018 (Figure 1). After selecting the risks, the teams could engage with a list of mitigation elements (purple area in Figure 3). These interactions were assumed as a proxy for the engagement with the “risk treatment” stage of ISO 31000 (2018). This list contained 25 elements that the teams could use to mitigate the risk. Some of these elements were components that could be placed at specific interfaces (such as M01 – EMI filter) or “strategies” (such as M04 – regular inspection on hub alignment). The list provided each team with information about the cost incurred and the reliability gained by choosing a specific mitigation element. The choice of reliability gains and cost for each mitigation element was made ‘ad-hoc’ so that some elements were too expensive for the overall gain they provided (considering the distances and the propagation risk). Other elements were made cheap while providing a high-reliability gain, but only considering the overall propagation and distances. The cost and reliability gains were crucial in determining the overall “performance” of the design teams on the product results.
In selecting an appropriate performance metric to assess risk management effectiveness, we used the normalised risk of function degradation derived from the risk propagation matrix instead of direct risks from the technical risk registry. This choice was made because indirect interactions, captured by spatial distances and risk propagation effects, more accurately represent real-world scenarios in complex system design. Direct risks, assessed in isolation, often underestimate or overlook the cumulative impacts arising from proximity-induced propagation. Therefore, this propagation-informed metric better reflects actual engineering conditions, where risks interact and compound non-linearly across system interfaces, making it a more robust representation of the true risks faced by the design teams.
The experimental inputs were constructed to simulate plausible design data without embedding decision cues. For example, mitigation costs and effectiveness scores were calibrated to allow both under- and over-design, and no dominant solution was embedded. This setup ensured that any perceived value of a tool would emerge from the participants’ reasoning process, not from how ‘obvious’ the data made the answer.
Figure 4 visually consolidates the experimental setup and process flow described. The workflow illustrates the six sequential stages of the web-based design session (from introduction to risk treatment), the real-time data logging of participant interactions, and the iterative use of design support tools, including Design Structure Matrices (DSMs) for interfaces, distances and risk propagation.
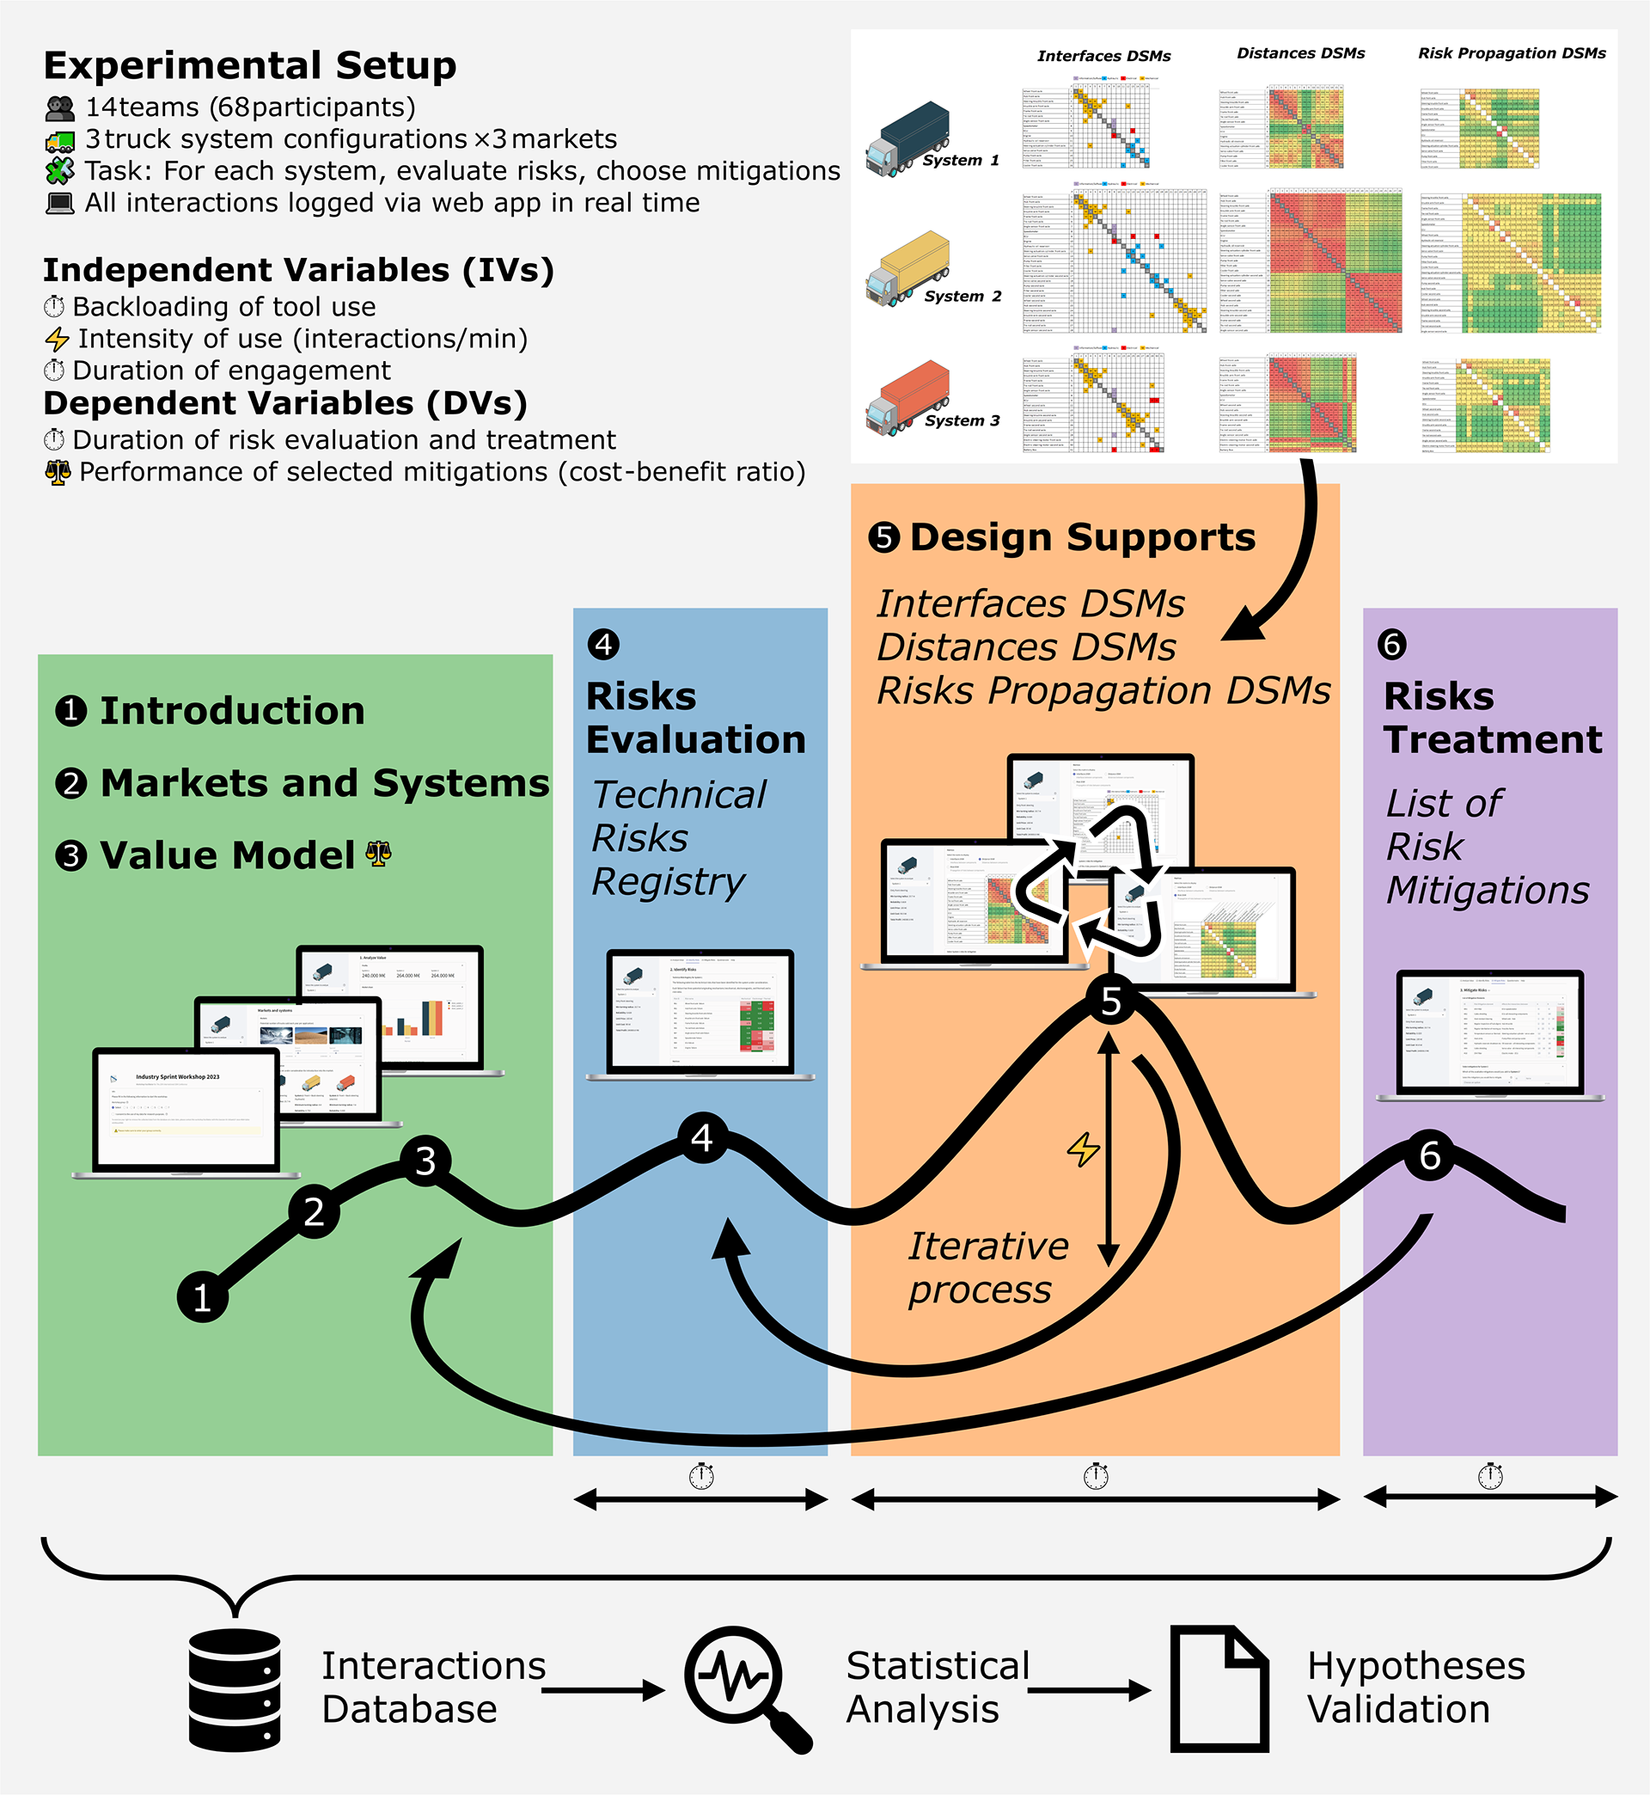
Figure 4. Overview of the experimental setup and process flow of the study.
3.2. Hypothesis development
As mentioned in the introduction, this paper aims to understand the influence of indirect interactions on product and design process objectives. We will first start describing the independent variables that were measured (IV) and how these impact dependent variables (DV) that relate to design process objectives. After, we will describe the dependent variables involving the product objectives.
For the independent variables, we considered the (1) back-loading of design support use, (2) intensity of design support use and (3) duration of design support use. Identifying the back-loading of design support use allows us to identify how quickly the team members started to intensively use the design supports. As an assumption, back-loading (or late engagement) was set at the timestamp when the team used the design supports for 50% of the total interactions. Although “front-loading” of design supports is a more commonly used term in the design community (Thomke & Fujimoto Reference Thomke and Fujimoto2000), we opted for the less frequent term “back-loading” (previously used in the study of design supports by Fixson & Marion Reference Fixson and Marion2012) because we formulated our hypothesis as a null hypothesis. Our objective is to falsify this null hypothesis (that back-loading does not have an effect), which will enable us to draw conclusions about the benefits or risks of exclusively front-loading the use of design supports. Identifying the intensity of design support use, or the average number of interactions per minute during the duration of design support use, allows us to better understand the role that design support plays throughout the risk treatment phase, not just in the identification of risk. However, counting the number of interactions may not provide a full picture of how the design supports have been used. There could be cases in which the teams did not transition among supports but spent more time looking at them without transitioning. Therefore, we considered the duration of design support use as the total time incurred between the initial and the last interaction with the design supports. In the example in Figure 3, Team A presents a longer duration of use compared to Team B, while it presents a similar intensity of use.
The primary dependent variables in this study are the duration of risk evaluation and the duration of risk treatment. The duration of risk evaluation is defined as the time interval between the first and last interactions related to the selection or deselection of risk elements from the registry, reflecting the team’s engagement with identifying critical system vulnerabilities. The duration of risk treatment corresponds to the time interval during which mitigation elements were selected or deselected, representing the team’s process of determining and implementing appropriate responses to the identified risks. These variables capture the efficiency of the risk management process, as they directly relate to how quickly and thoroughly teams complete the evaluation and treatment phases. By quantifying these durations, the study assesses how different patterns of interaction with the design supports – namely, back-loading, intensity and total duration – impact the temporal dynamics of risk handling in complex design tasks.
As there is no previous research that establishes any patterns between risk management and these interactions to design support, we have no basis on what to expect from the different interactional patterns that will lead to any reduction (or increase) in the length of the two risk management phases at the core of our study (risk evaluation and risk treatment). Thus, we posit the following null hypotheses:
H1a–b. Back-loading of design support use does not affect the duration of risk evaluation (H1a) and risk treatment (H1b).
H2a–b. The intensity of design support use does not affect the duration of risk evaluation (H2a) and risk treatment (H2b).
The durations of risk evaluation and risk treatment selection were evaluated by calculating the time between the time stamps of the selection (or deselection) of all the chosen risks and the mitigation elements. This was formulated as a null hypothesis to understand the interactional patterns that have been previously explored in project management research (Iorio & Taylor Reference Iorio and Taylor2014). Throughout this iterative process, teams had the flexibility to select or later deselect risks and mitigations as their understanding of the system and the problem evolved. These interactions were collectively considered for the sake of simplicity, as there was neither a hypothesis nor an effort to examine the potential effects of this selection and deselection cycle.
Because our research aims to explore the role of design support in system under- or over-design (e.g., Jones & Eckert Reference Jones and Eckert2023), we also formulated hypotheses that reflect our expectations about the role of design support in avoiding under- or over-design. Again, since no previous research has established any interaction patterns between the use of design supports and under- and over-design, we formulated the following null hypotheses:
H3. Back-loading of the design support use does not lead to the selection of under- or over-designed mitigation elements.
H4. Intensity of design support use does not lead to the selection of under- or over-designed mitigation elements.
H5. Duration of design support use does not lead to the selection of under- or over-designed mitigation elements.
To define under- and over-design, we recorded which of the 25 mitigation elements from the mitigation list the teams selected during the workshop. These results are shown in Figure 5.
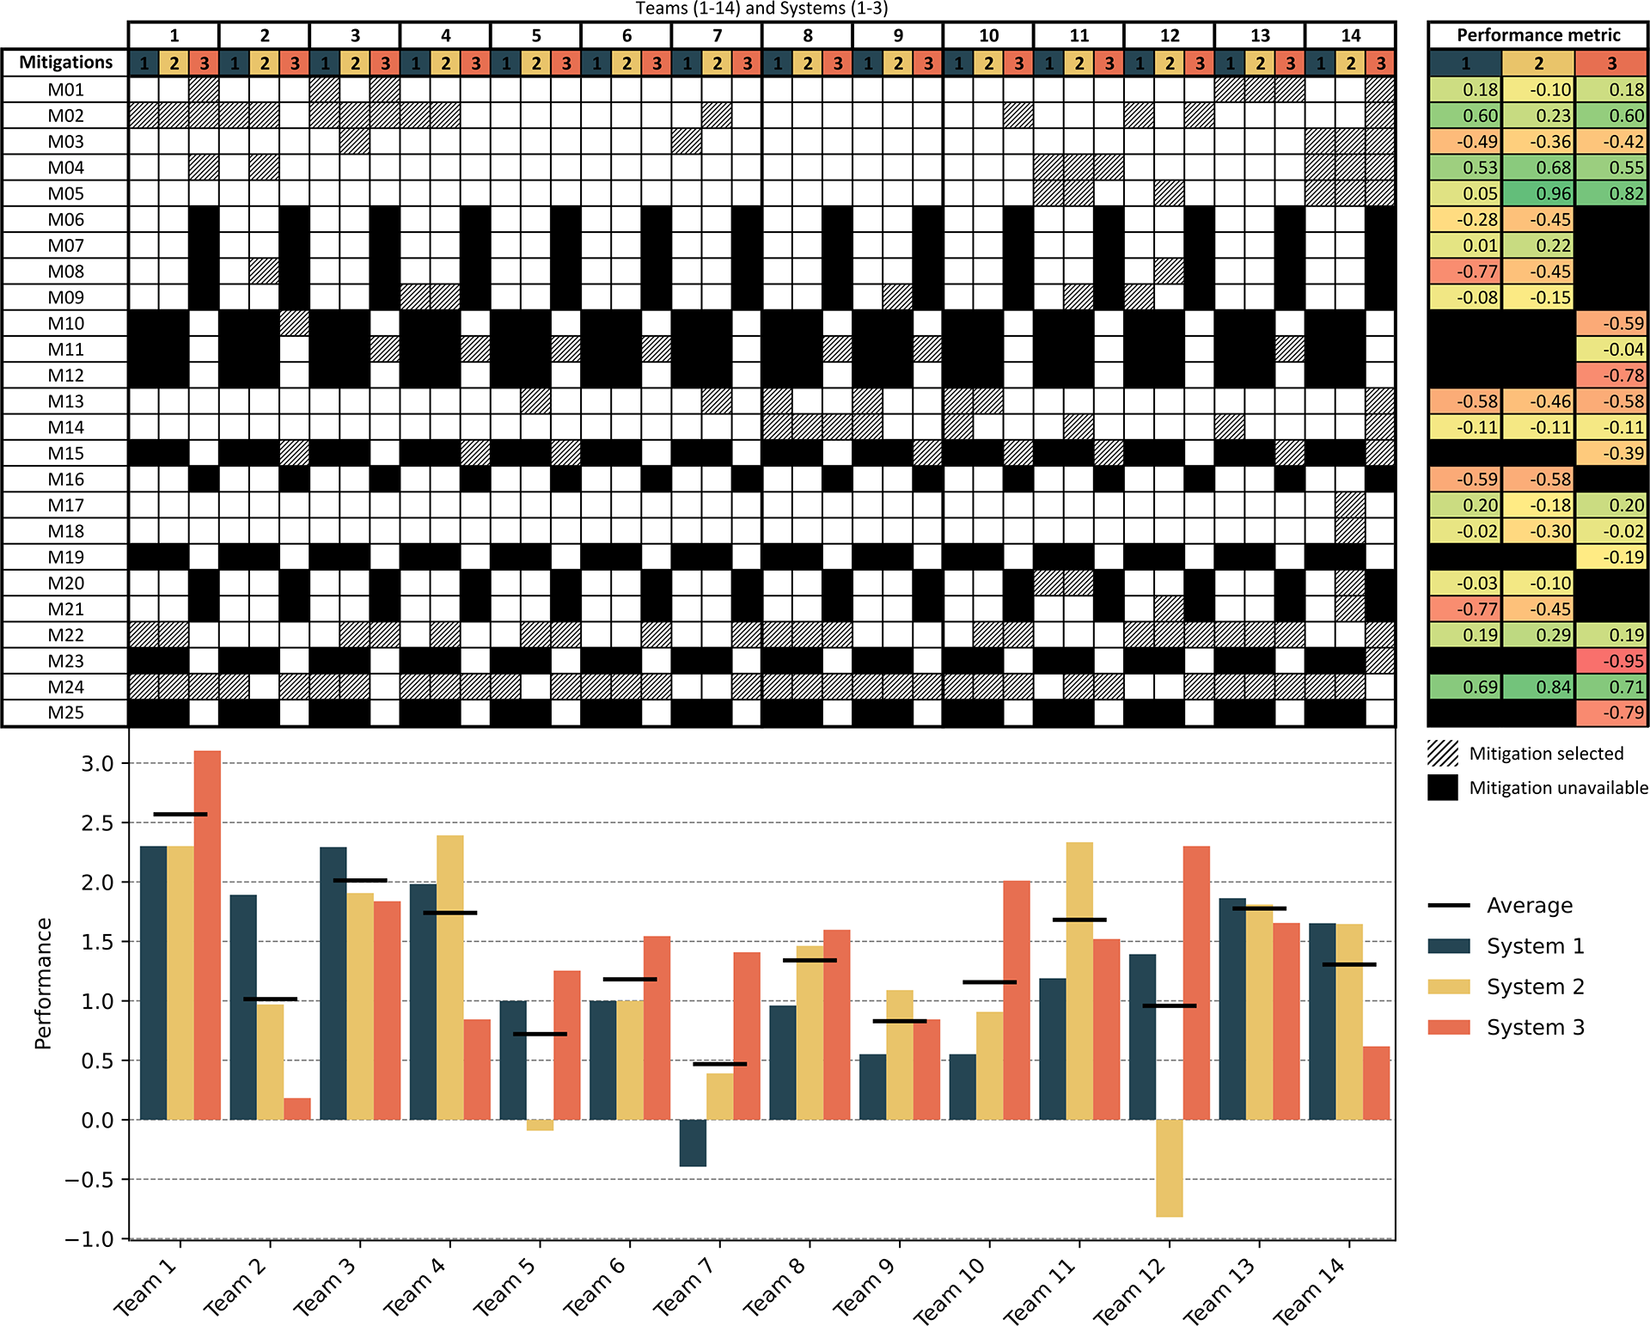
Figure 5. Selected mitigation elements and performance metrics (higher is better) for each team and system. High performance indicates a well-balanced selection of mitigation elements, providing effective risk reduction at a lower cost. Conversely, lower performance scores reflect either under-design (insufficient risk mitigation) or over-design (excessive cost relative to actual risk).
To effectively link design efficiency with the performance of the selected mitigations (i.e., their efficacy), it is essential to evaluate how well the teams balanced functionality and cost in their decisions, ensuring that the risk treatment strategies were neither under- nor over-designed. This relationship is assessed through a performance metric that integrates design efficiency considerations by evaluating the functional effectiveness of each mitigation against its cost, thereby providing insight into the overall efficiency of the design process. To estimate this performance metric, we considered a metric incorporating functions and costs, as traditionally applied in value engineering (Miles Reference Miles1972). Because the function of these elements is to mitigate risk, we defined a performance metric considering only the values contained in the risk propagation matrix. By using the normalised risk of function degradation minus the cost as a value metric, we achieved a more precise evaluation of the design process, considering the functionality and performance of the solution against the monetary cost incurred. This approach balances the direct costs with the potential impacts on system performance, emphasising the components that minimise functional degradation relative to their cost. This ensures that each element contributes effectively to risk treatment without unnecessary expenditure, thereby preventing both under- and over-design. We considered these values as a proxy for the “true” risks involved in the three systems, as the risks contained in the technical risk registry are either (1) amplified by propagation effects or (2) attenuated by the effects of physical distance (Alonso Fernández et al. Reference Alonso Fernández, Panarotto and Isaksson2024). While considering the values contained in the risk propagation matrices as “ground truth” may present some limitations (Peng & Gero Reference Peng, Gero and Gaber2010), we assumed it as a good proxy to determine the extent to which the teams considered the difference between the “first-order” risk values contained in the registry and the “higher-order” risks contained in the risk propagation matrices. Considering this difference was important, as the risk values were intentionally assigned so that two situations may have occurred:
-
1. The mitigation selected was under-designed; in this case, the teams selected mitigation elements to keep the cost of the system low while compromising on the risk of propagation.
-
2. The mitigation selected was over-designed; in this case, the teams selected expensive mitigation elements compared to the actual risk involved.
Therefore, this simple score allowed us to understand whether the teams applied more careful consideration of the actual risks involved in the three systems. Looking at the onset of Figure 5, it can be noticed that some elements presented high performance in terms of risk and cost (e.g., M05 for System 2 or M24 for all three systems). The teams that selected them were considered to have a ‘balanced’ approach to risk treatment. On the contrary, this approach was considered not followed if the teams selected elements with a low-performance metric (e.g., M08 or M23). Taking these scores as “ground truth” allowed us to understand whether this behaviour was dependent on a different interaction with the design supports (e.g., the risk registry or the risk propagation matrix that contained information that could lead or mislead the teams). Thus, efficacy was operationalised as a continuous performance metric derived from the trade-off between reliability gains and incurred costs of selected mitigation elements, following a value engineering approach. This metric, therefore, captures the extent to which teams avoided under- and over-design scenarios.
Our last three hypotheses aim to investigate the role of design support in assisting less experienced designers. Prior research suggests that experienced designers may be better at interpreting conflicting information (Kavakli & Gero Reference Kavakli and Gero2002) and extracting value from structured tools (Clarkson, Simons & Eckert Reference Clarkson, Simons and Eckert2001). Therefore, we investigate whether experience moderates the relationship between tool use patterns and risk management performance or duration. However, due to the exploratory nature of this interaction, we formulate the following as null hypotheses:
H6a–b. There is no interaction between years of experience and back-loading of design support use on the duration of risk evaluation (H6a) and risk treatment (H6b).
H7a, b. There is no interaction between years of experience and the intensity of design support use on the duration of risk evaluation (H7a) and risk treatment (H7b).
H8a–c. There is no interaction between years of experience and back-loading (H8a), intensity (H8b) or duration (H8c) of design support use on risk management performance.
With these hypotheses, our goal is to test whether the effects we observe with H1–H5 are reinforced when we consider participants’ years of experience.
As previously introduced, our study addresses two central research questions: (1) What is the role of indirect interactions in the efficiency of the design process and the efficacy of the product? and (2) How can the use of design supports improve the efficiency of the design process and the efficacy of the product? To operationalise these questions clearly, we formulated a set of targeted hypotheses (H1–H8). Specifically, hypotheses H1–H2 explore how different patterns of design support use affect the duration of the risk evaluation and risk treatment phases, directly addressing process efficiency (RQ2). Hypotheses H3–H5 examine how these interaction patterns influence the selection of mitigation strategies, thus targeting the efficacy of risk treatments in relation to indirect interactions (RQ1 and RQ2). Finally, hypotheses H6–H8 investigate whether designers’ experience moderates the effects of tool usage on both efficiency and efficacy, providing deeper insights into the role of design support under varied team conditions.
4. Data analysis
The final dataset used for our analysis comprised 4460 interactions. Of these, 59.10% (2636) involved the use of any of the five design supports, broken down into 18.27% (815) related to the selection of risks from the risk registry, 18.23% (813) related to the selection of mitigations from the list of mitigations, and 22.60% (1008) related to the use of the DSM matrices. The use of the matrices was distributed by 6.23% (278) for the Interfaces DSMs, 7.94% (354) for the Distance DSMs and 8.43% (376) for the Risks Propagation DSMs. The remaining interactions, 40.90% (1824), involved interactions with the value model (i.e., checking the impact of their decisions on the overall value). Some of these interactions are plotted in Figure 6 as the stacked kernel density estimates (KDE) of normalised activity over time for each intervention category. Each curve represents the smoothed distribution of event intensities within a team, grouped by intervention type and stacked to highlight relative contributions. Density estimates are weighted and computed over 5-minute intervals. The workshop duration was not homogeneous, reflecting a better fit to realistic working conditions of a large company developing a complex system (i.e., meetings and discussions are not always equally bounded).
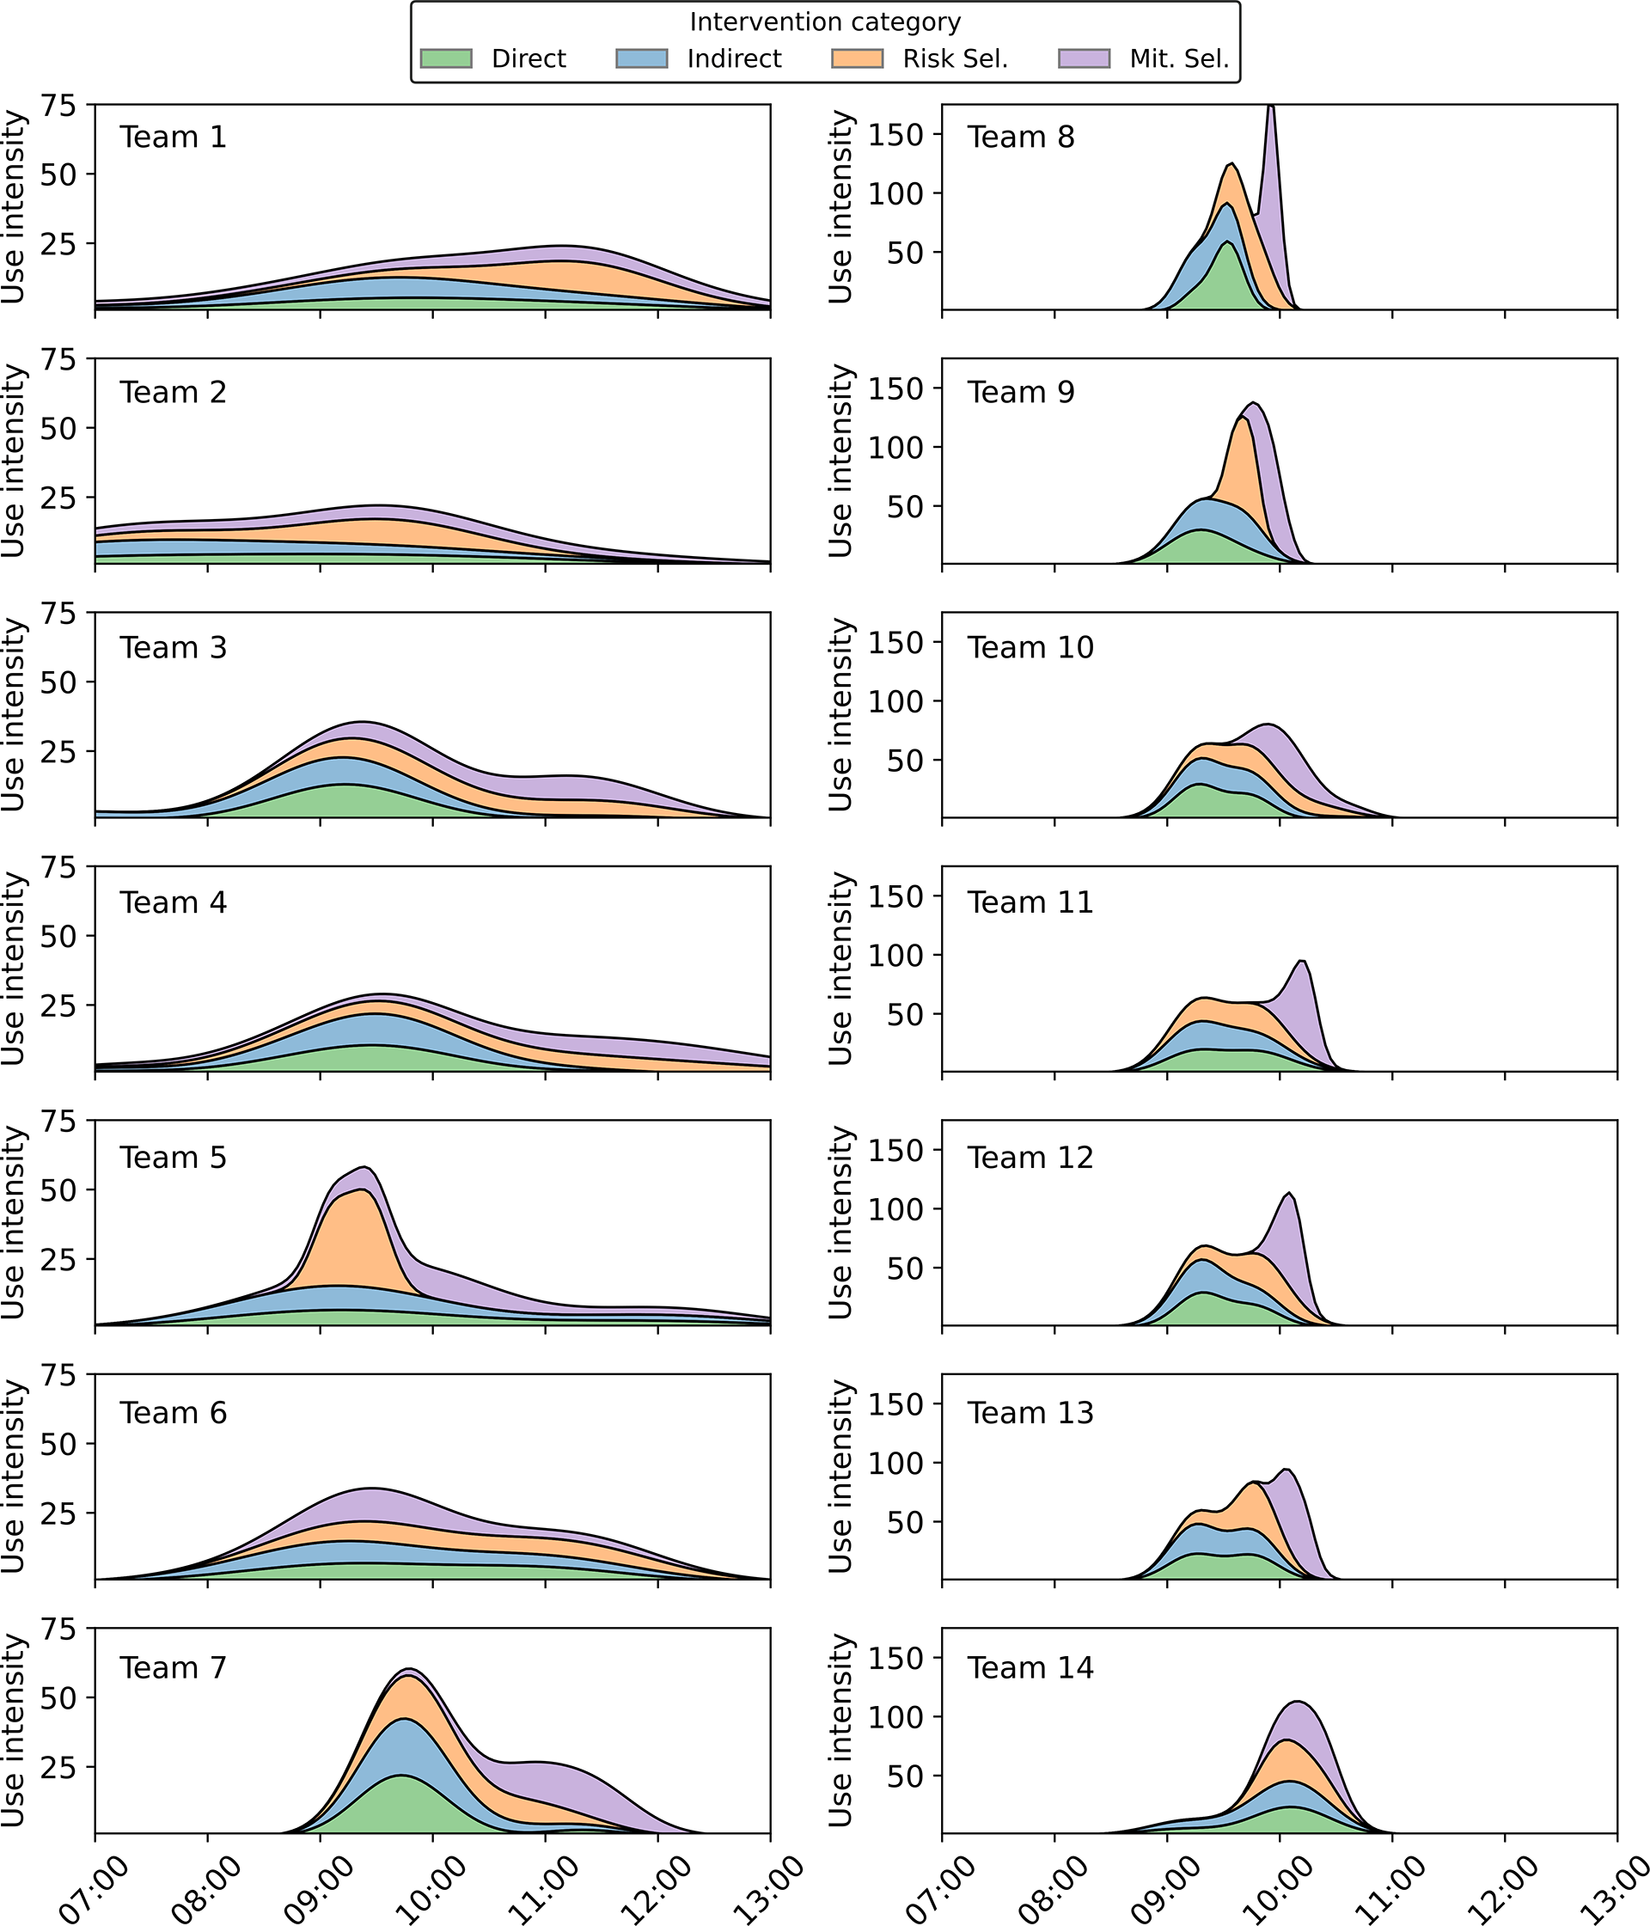
Figure 6. Stacked KDEs of normalised event intensity over time, grouped by intervention category. Curves are weighted and represent smoothed distributions per team.
Following Hinds and Mortensen (Reference Hinds and Mortensen2005), we employed multiple regression to assess the impact of the independent variables (back-loading of design support use, intensity of design support use and duration of design support) on the dependent variables (duration of risk evaluation and treatment, and under- and over-design). Additionally, we included an interaction term in our model to explore whether years of experience amplified or mitigated the effects of the independent variables on the dependent variables. Two-tailed t-tests were conducted to compare the teams regarding the frequency, timing and intensity of the design support used during risk evaluation and treatment.
To determine the robustness of our findings, we evaluated statistical significance levels at various thresholds: 0.05, 0.01 and 0.001. These thresholds indicate the probability that the observed results are due to chance, with lower p-values suggesting stronger evidence against the null hypothesis.
To complement the analysis of the data regarding the proposed hypotheses, Figure 7 presents the normalised transition matrices for each of the 14 design teams, capturing how frequently participants navigated between the five main design support tools: the interface DSM, the distance DSM, the risk propagation DSM, the risk identification registry and the risk treatment selection interface. These matrices provide a team-level behavioural profile of tool usage patterns during the design sessions. While some teams (e.g., Team 4) exhibit focused transitions from risk identification to treatment with limited movement across DSMs, others (e.g., Team 5) show higher transition frequencies among the DSM tools themselves, particularly between the indirect and direct representations. These variations illustrate distinct tool usage strategies adopted by teams under the same task constraints.
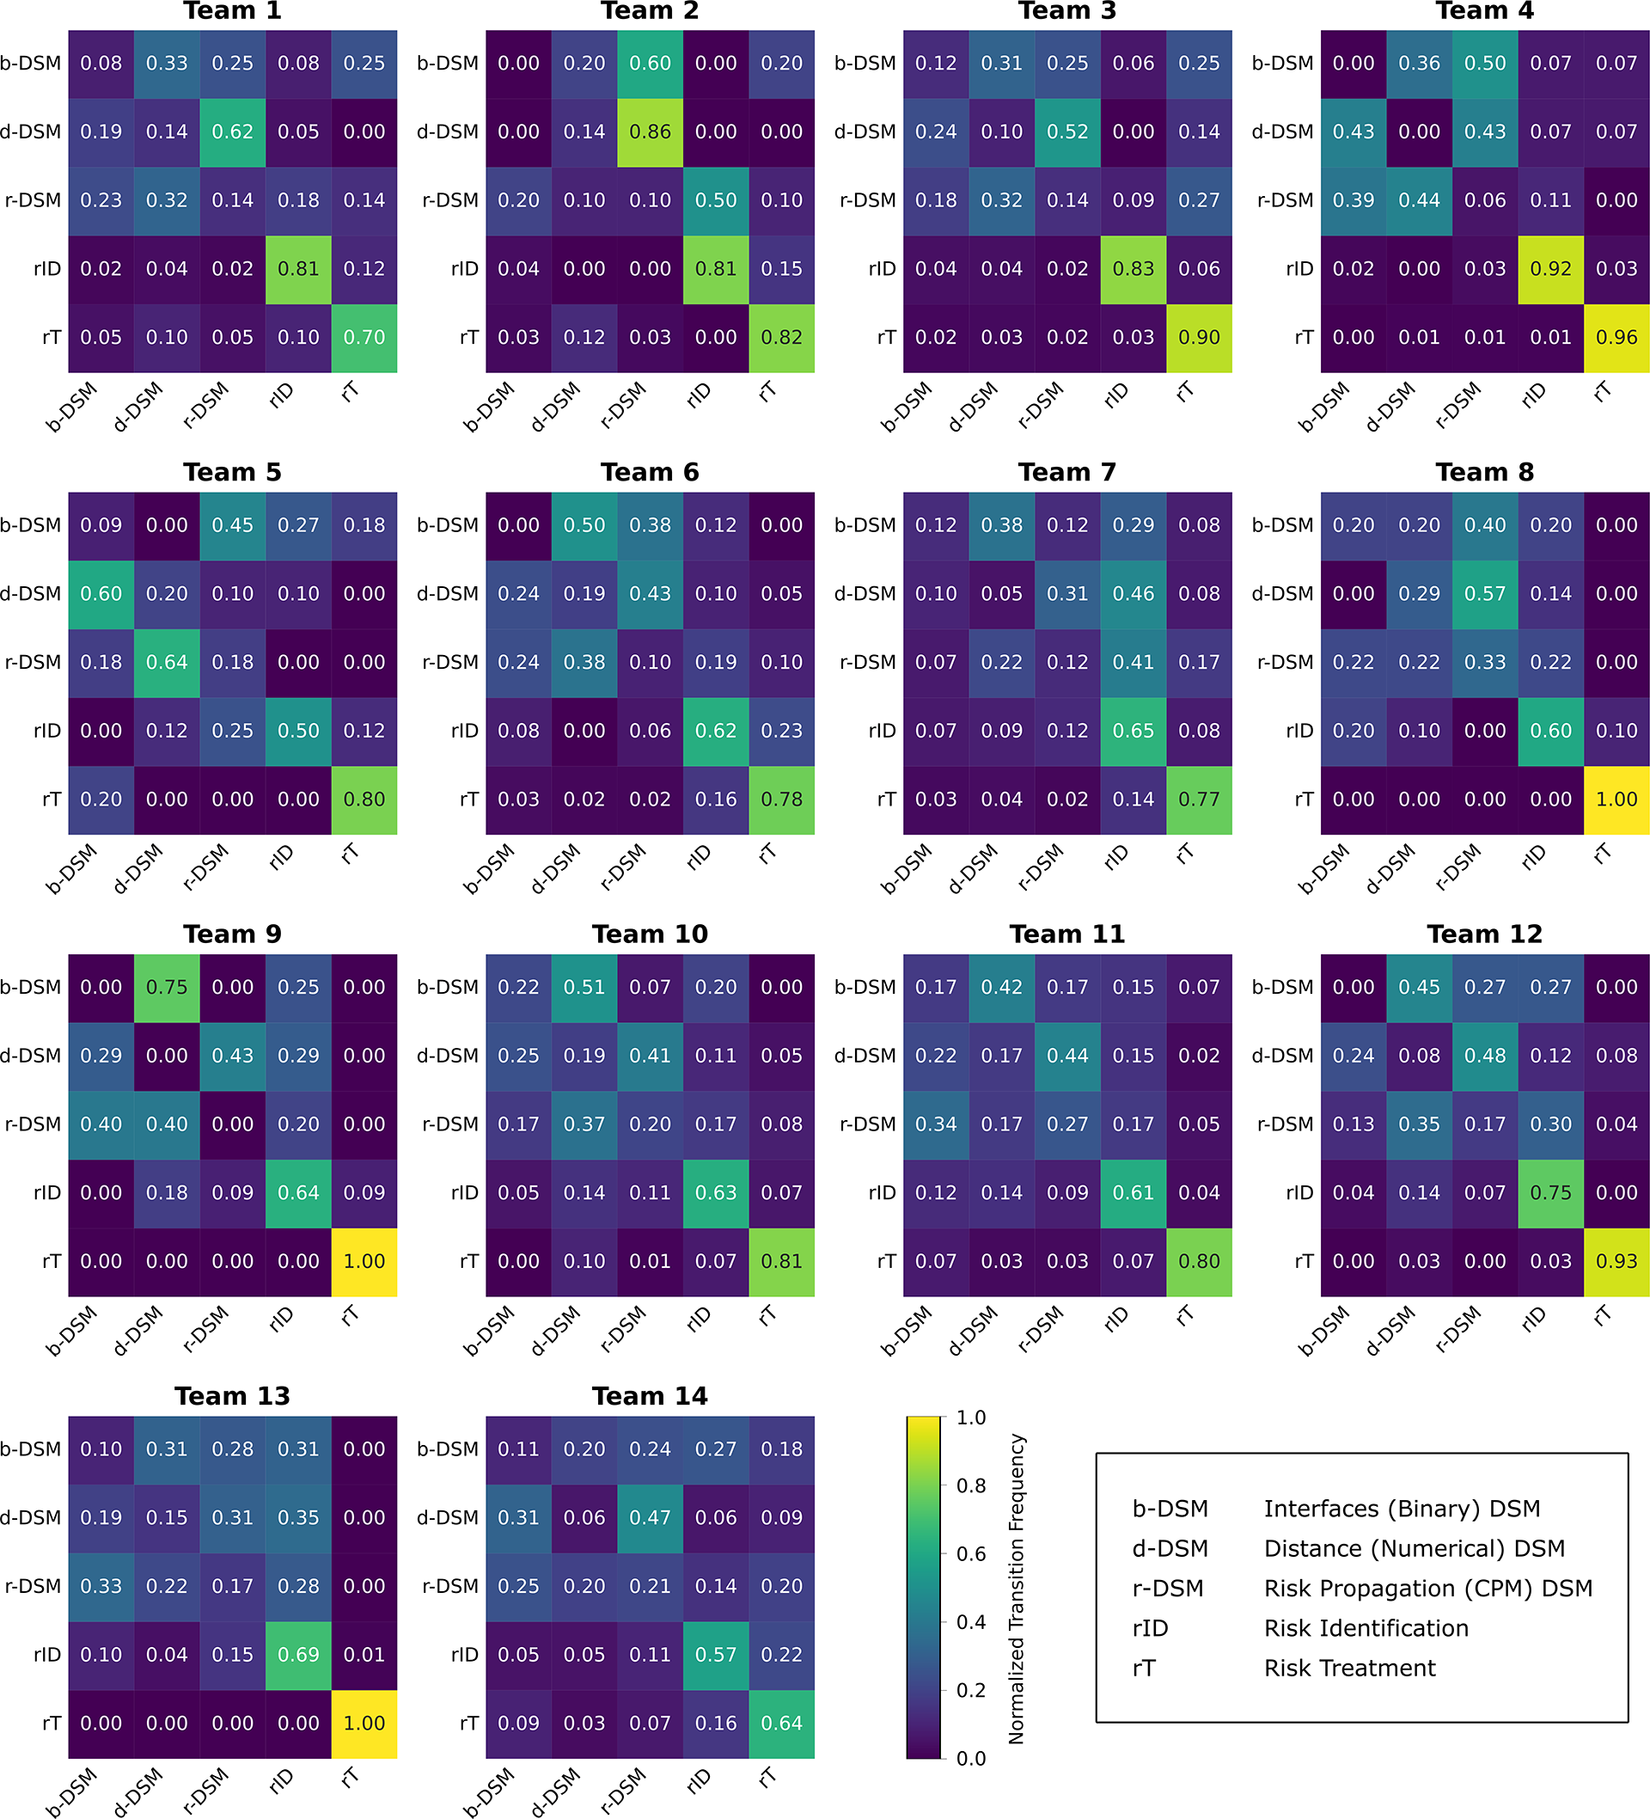
Figure 7. Normalised transition matrices for each team, showing the frequency of transitions from row (source) to column (target) between design support tools.
5. Results
Table 2 presents the descriptive statistics and correlation coefficients for the primary variables. The table includes the mean values, standard deviations and Pearson correlation coefficients for each variable pair.
Table 2. Descriptive statistics and correlations between variables
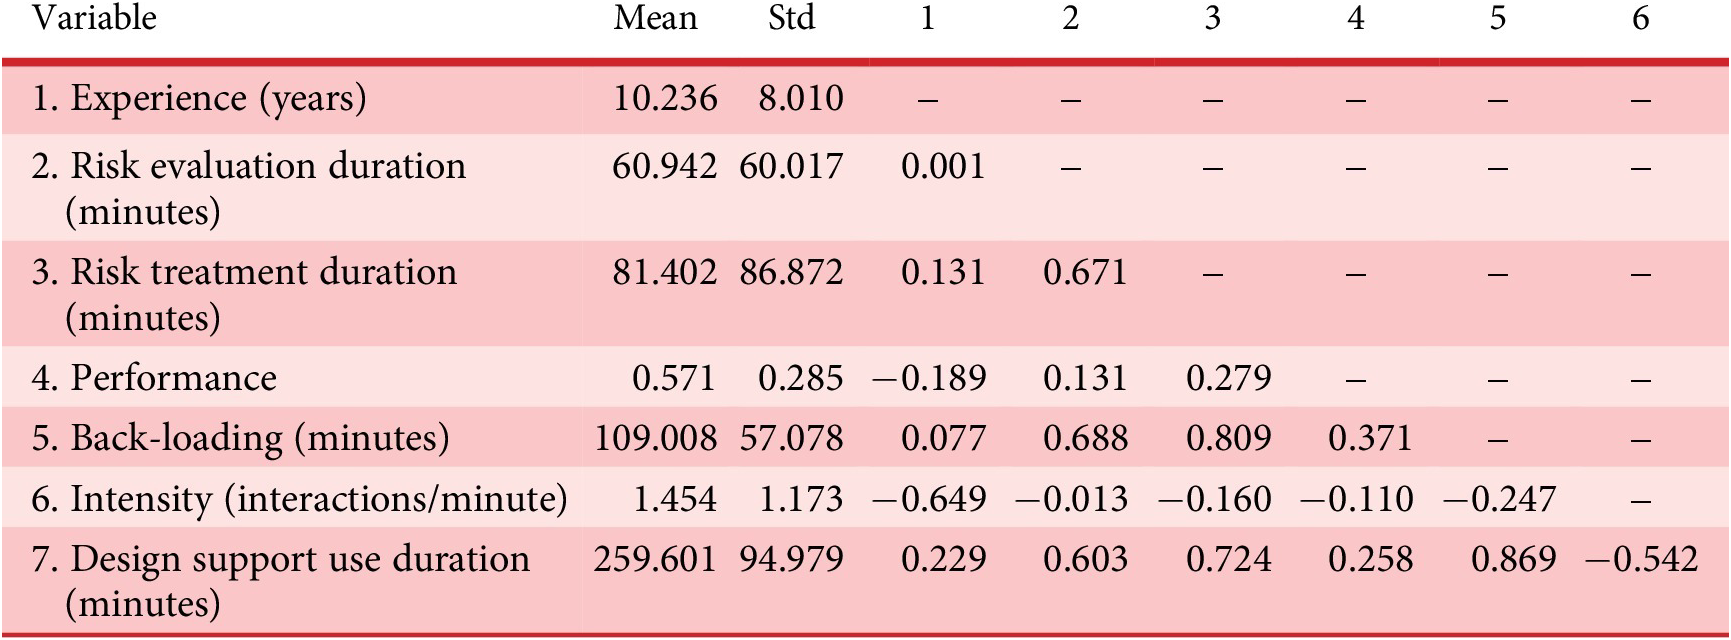
Table 3 presents the results of the Ordinary Least Squares (OLS) regression analyses examining the impact of different aspects of design support usage (back-loading, intensity and duration) and their interactions with the experience of the team on the duration of risk evaluation and treatment phases in the assignment.
Table 3. Summary of OLS regression results for design support usage on risk management
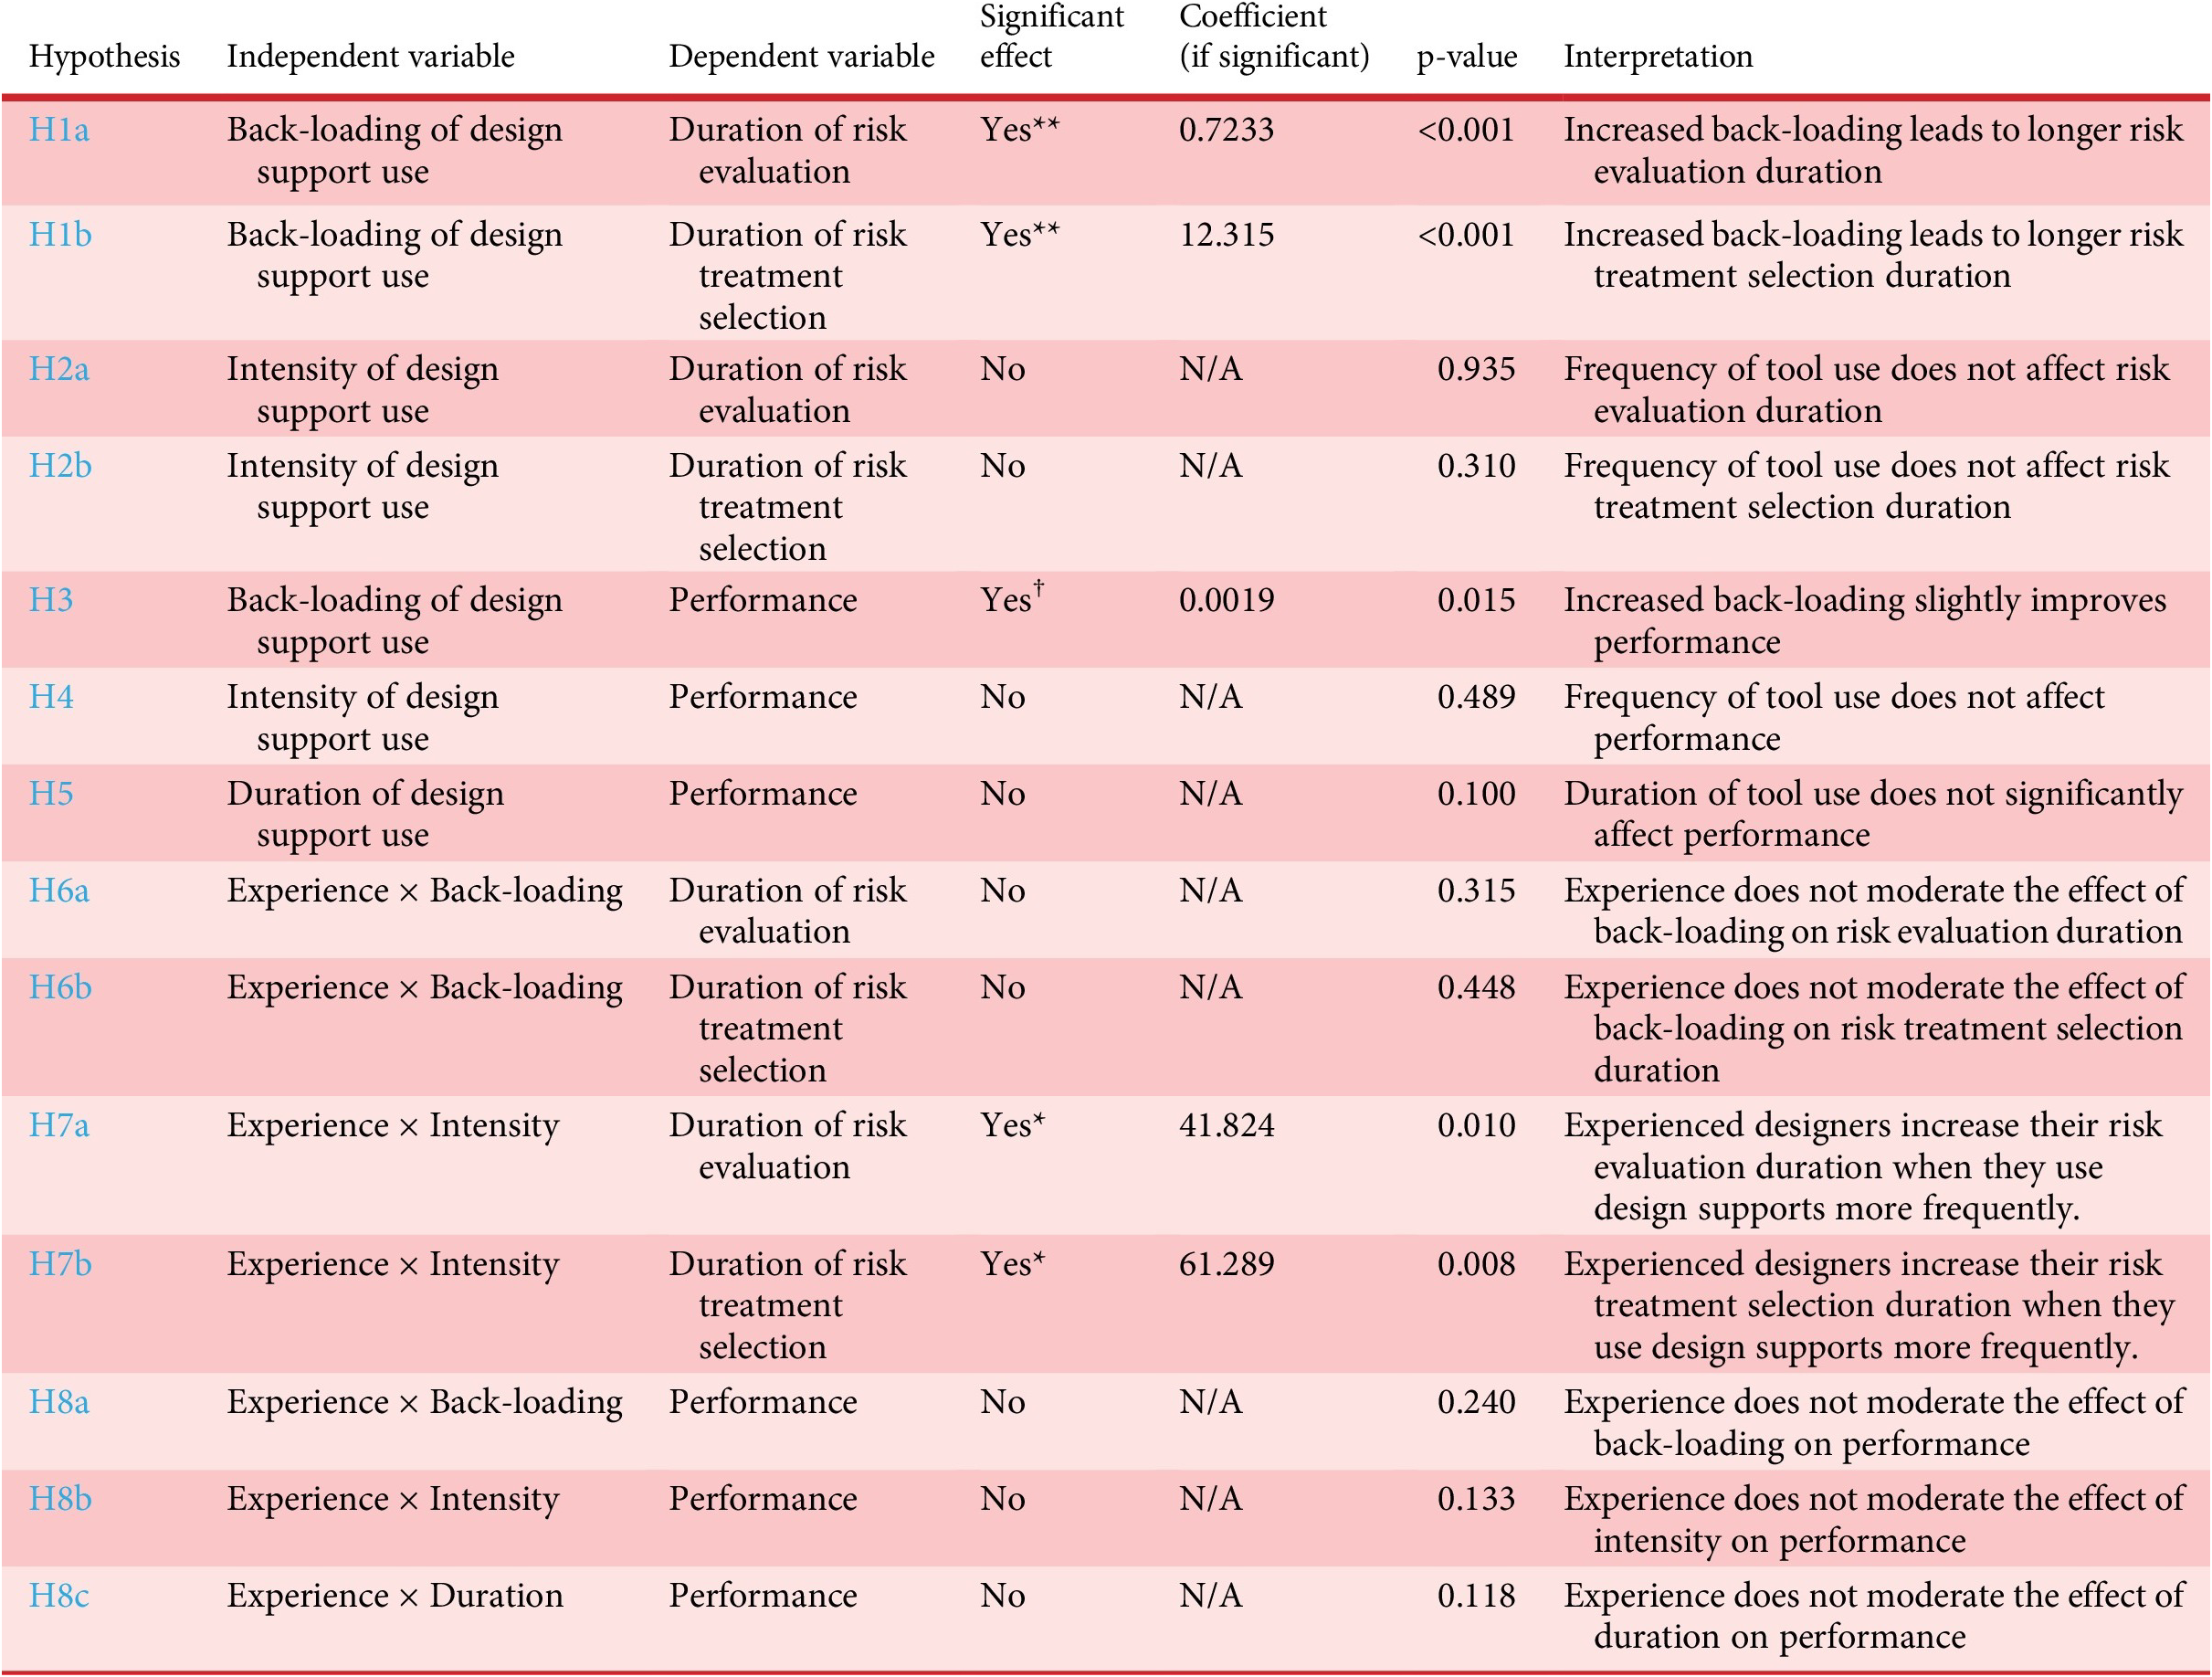
Significance levels: ** ≤ 0.001, * ≤ 0.01, † ≤ 0.05.
5.1. Direct effects on risk evaluation and treatment selection
The back-loading of design support use significantly affected both the duration of risk evaluation (p < 0.001) and risk treatment selection (p < 0.001), rejecting H1a and H1b. The positive coefficients (0.7233 for risk evaluation and 1.2315 for risk treatment) suggest that increased back-loading leads to longer durations for these activities.
The intensity of design support use did not significantly impact the duration of risk evaluation (p = 0.935) or risk treatment (p = 0.310), supporting H2a and H2b. This indicates that the frequency of design support use per minute does not influence the time spent on risk-related activities.
5.2. Direct effects on performance
The back-loading of design support use significantly affected performance (p = 0.015), rejecting H3. However, the intensity (p = 0.489) and duration (p = 0.100) of design support use did not significantly affect performance, supporting H4 and partially supporting H5.
5.3. Interaction effects with experience
The interaction between experience and back-loading of design support use did not significantly affect the duration of risk evaluation (p = 0.315) or risk treatment (p = 0.448), supporting H6a and H6b.
The interaction between experience and intensity of design support use significantly affected the duration of risk evaluation (p = 0.010) and risk treatment (p = 0.008), rejecting H7a and H7b. These interactions suggest that the impact of intensity on risk management duration is moderated by experience, with experienced teams potentially benefiting more from high-intensity use.
The interactions between experience and all forms of design support use (back-loading, intensity and duration) did not significantly affect performance (p-values ranging from 0.118 to 0.240), supporting H8a , H8b and H8c .
The results indicate that back-loading and duration of design support use are critical factors in influencing the duration of risk management activities. However, the intensity of use did not have a significant direct impact. Furthermore, experience moderates the relationship between the intensity of design support use and risk management duration, but it does not significantly interact with other forms of design support use to affect performance. These findings highlight the importance of strategic planning in the use of design support tools to optimise risk management processes and outcomes.
6. Discussion
Our research offers insights into the distinct ways design teams use risk management design supports in risk management processes, allowing us to assess their effectiveness as risk management mediators in complex system design. In this study, teams that engaged early with design support tended to start identifying risks more quickly (H1a). This is consistent with previous research indicating that risk management tools can help individuals (McMahon & Busby Reference McMahon, Busby, Clarkson and Eckert2005; Borgue et al., Reference Borgue, Christopher, Massimo, Ola, Tommaso and Nicole2021). Consequently, our research suggests that the effectiveness of risk management supports depends on their interactional patterns along the risk management process. Thus, to enhance design efficiency in terms of reduction of time and effort spent, the timing of the use of design support tools is critical. This is further supported by our finding that intense, repeated use of design support does not shorten the duration of risk evaluation and treatment (H2a and H2b). Therefore, simply “using frequently” a design support is not enough to streamline the risk management processes. Instead, the strategic use of design support is crucial for their effectiveness. In other words, different ways of interacting with design support are more or less effective in mediating various aspects of the risk management process. This is supported by our findings that connect later design support use with the performance of risk treatment (i.e., the selection of cost-effective elements to insert at critical interfaces, H3). While “front-loading” the use of design support could be beneficial to start to identify risks early (i.e., a larger “back-loading” would be detrimental), it seems better to delay the decision about which mitigation elements to select (H1b) by continuing to use the support tools, irrespective of the intensity of use (H4). This is because the main distinction between the risk evaluation and risk treatment phases is that the identification phase generally culminates in a single decision (acknowledging the existence of a risk), whereas the resolution phase entails a decision-making process, which the team devises strategies, suggests alternatives, evaluates their feasibility and decides on implementation actions (Sjögren et al. Reference Sjögren, Fagerström, Kurdve and Lechler2019). This was particularly relevant for the challenge given to the teams. There was a difference between the “first-order” risks contained in the technical risk registry and the “higher-order risks” contained in the distance and change propagation matrices (i.e., the risks contained in the technical risk registry were either attenuated by the long-distance or exacerbated by short distances and propagation effects). At the same time, there were different alternative mitigation elements that could potentially mitigate the same risk (although at different costs). The teams that performed better “back-loaded” the use of the tools, even during the treatment phase, and delayed their decisions about the elements to select. These results seem in line with set-based concurrent engineering (Sobek, Ward & Liker Reference Sobek, Ward and Liker1999; Toche, Pellerin & Fortin Reference Toche, Pellerin and Fortin2020) by suggesting delaying design decisions while exploring multiple alternatives simultaneously. As a general insight, it seems that there is a trade-off between front- or back-loading the use of risk management tools with (1) schedule pressure and (2) risk treatment performance. The front-loading of tool use should be pursued, but prolonged use should also be encouraged. A “long tail” of use is still beneficial to discuss the cost and benefit of mitigation alternatives as well as the “residual risk” (Maiworm et al. Reference Maiworm, Hammann and Schleich2023) that the individuals perceive from their own synthesis of the information contained in the tools. This risk perception ability is even more important as risk assessment methods such as FMEA contain a certain degree of rigidity and lack more flexible and human-like reasoning. The same was observed by Roy, Sarkar, and Mahanty (Reference Roy, Sarkar and Mahanty2016) and Borgue, Panarotto, and Isaksson (Reference Borgue, Panarotto and Isaksson2022), who applied fuzzy logic to enable a more nuanced and adaptable risk assessment. Compared to these studies, our results emphasise the human ability to perceive nuances during risk assessment, as opposed to a rigorous mathematical risk computation. Therefore, our results further explored the link between uncertainty perception and externally enacted information, which has already been established in previous research (Cash & Kreye Reference Cash and Kreye2017). Given this focus on perception, our study did not make a more granular analysis of which of the five tools was used more and how this had an impact. Instead, we examined the use of design support tools as an aggregated metric. Following Gericke et al. (Reference Gericke, Eckert, Campean, Clarkson, Flening, Isaksson and Kipouros2020), we assumed that all five tools interact as a ‘method eco-system’ and we focused on validating empirically how a dynamic use of these design support tools as a whole was able to enhance the ultimate metrics of effectiveness.
Since the designers’ experience can positively impact the outcome of a design activity (Kavakli & Gero Reference Kavakli and Gero2002), while the use of design support can compensate for the lack of experience (Clarkson et al. Reference Clarkson, Simons and Eckert2001), it was important to determine whether the designers’ experience reinforces the strategic use of design supports. In this regard, we did not find statistically significant differences, except for H7a and H7b, where we found that experience moderates the correlation between intensity and risk evaluation and treatment durations; thus, more experienced teams manage to offset some of the negative impacts of frequent tool use on those durations. This may suggest that more experienced teams used the tools more efficiently. However, considering ‘experience’ as a differentiating characteristic has been debated in literature (Cash et al. Reference Cash, Isaksson, Maier and Summers2022). For example, in our study, even teams with high experience may have had low familiarity with the tools presented, the truck design problem, mitigation elements and so forth In our study, we considered experience as an important parameter, mainly because it allowed us to create an experiment that fitted the realistic working conditions of a large company developing a complex system (which often presents a wide variety in terms of seniority). In addition, the design problem was complex but did not require the expertise of a specialist. The difference was related to the ability to navigate effectively among the information contained in the design support tools. Here is where experience may have played a role, as more experienced designers had more familiarity in reading “specialist” representations such as FMEA and DSMs that contained different (and in some cases contradicting) information. For example, the teams had to assess whether an interface with no direct connection (looking at the binary-DSM) presented high proximity with many neighbouring elements (looking at the distance-DSM), resulting in a high propagation effect (in the CPM Risk Matrix, r-DSM).
To further illustrate the influence of design support use patterns on risk management outcomes, we include a comparative analysis of the two extreme cases in our dataset: Team 1 (highest performance) and Team 7 (lowest performance), as shown in Figure 8. The density distributions of intervention types over time reveal a striking contrast in both temporal dynamics and tool engagement strategies. Team 1 displayed a gradual, sustained engagement across all categories – particularly with mitigation selection – corresponding with a more balanced and iterative risk treatment strategy. In contrast, Team 7 exhibited a sharp, early spike in activity dominated by direct and indirect risk representations, followed by a rapid tapering off, suggesting a compressed and potentially rushed decision-making process. This pattern aligns with our hypothesis that back-loaded and prolonged engagement, especially with indirect risk representations and mitigation tools, enables teams to uncover second-order risks and develop more cost-effective responses. These findings reinforce the interpretation that strategic tool use – not merely frequency or intensity – enables better risk propagation awareness and supports more robust decision-making in early design.
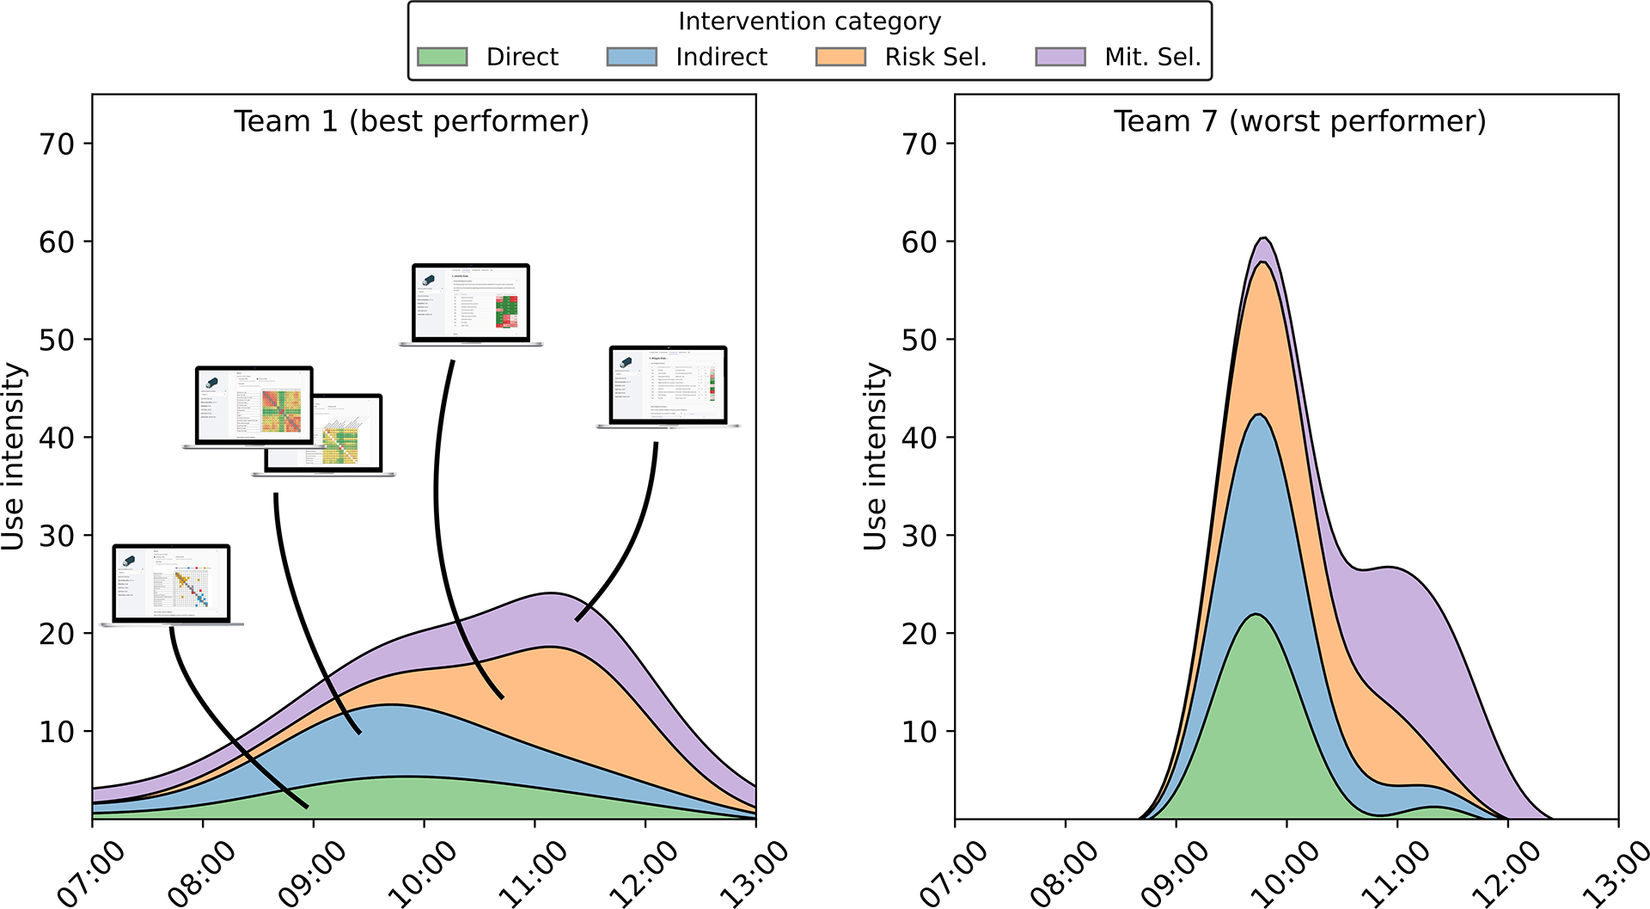
Figure 8. Use intensity over time for Team 1 (best performer) and Team 7 (worst performer), by intervention category. The contrasting patterns highlight how sustained, balanced engagement supports better risk management outcomes.
The findings of our experiment align with Giffin et al. (Reference Giffin, de Weck, Bounova, Keller, Eckert and Clarkson2009), who showed that early risk evaluation and understanding of change propagation paths can significantly reduce widespread late-stage changes. Their analysis of change propagation motifs highlights the importance of proactive risk management, which our study confirms as essential for maintaining design stability and efficiency. Additionally, Eckert, Clarkson, and Zanker (Reference Eckert, Clarkson and Zanker2004) provide important insights into managing changes in complex engineering domains, highlighting how effective risk management can reduce the need for extensive customisation and rework. Our findings support this, showing that the risk management strategies used in our experiment helped prevent unnecessary modifications, thereby enhancing overall design efficiency.
The transition matrices in Figure 7 reinforce our central argument that strategic patterns of tool use – not merely frequency or duration – underpin effective risk management. High-performing teams such as Team 1, which achieved the best cost-effectiveness score, exhibit transitions concentrated around indirect interaction representations (distance and propagation DSMs) and maintain engagement into the risk treatment phase. This suggests a deliberate, staged approach in which indirect risks are carefully considered before committing to mitigations. Conversely, Team 7, one of the lowest-performing teams, shows shallow engagement with indirect DSMs and a narrow transition profile focused on early risk identification, followed by a rapid move into treatment – indicative of a more rushed and linear strategy. Teams like Team 11 exemplify iterative and distributed usage patterns, with frequent transitions across all DSM types and between evaluation and treatment, suggesting a more exploratory mindset. These behavioural signatures align with our quantitative findings: sustained engagement with indirect risk tools, particularly when extended into the treatment phase, is associated with superior risk mitigation performance. Figure 7 thus provides qualitative, visual evidence for the claim that navigational strategy within the support tool ecosystem is a key driver of both efficiency and efficacy in early-stage risk management.
This study’s focus on tools designed for early-stage design processes, such as FMEA, inherently narrows the scope and may introduce biases in the conclusions. Other methods, such as FTA and HAZOP, were not included, as they are better suited for operational safety assessments or failure diagnostics rather than iterative design exploration. Future work could include these methods to assess their relative strengths and limitations in managing risks during complex system design. Incorporating risk tolerance into the design supports is outside of the scope of this study, but it would enable the prioritisation of risks and mitigation strategies in alignment with stakeholder goals. It would enhance the differentiation of acceptable risks from those requiring further action, addressing residual risks effectively (Kemp Reference Kemp1991; Bossuyt et al. Reference Bossuyt, Hoyle, Tumer and Dong2012).
The risks investigated in this study – arising from indirect physical interactions across system boundaries – align with what Pescaroli and Alexander (Reference Pescaroli and Alexander2018) define as ‘interconnected risks,’ where technical dependencies can initiate chains of unintended consequences. While our experimental scenarios are simplified, they reflect the real-world challenge of managing early-phase design risks that may propagate through interdependent architectures. Our findings support their argument that clearer distinctions between interacting, interconnected, and cascading risks are essential for designing decision supports that improve resilience at both the product and process levels.
This study takes a novel approach by structuring an empirical experiment where there is limited prior research. Unlike conventional case studies, our hypothesis-driven method allows for controlled observation of design team behaviours under structured conditions. This approach demonstrates the value of structured experimentation in risk management research and highlights the importance of quantitative validation in understanding decision-making processes.
Based on our experimental results, it is evident that effective risk management significantly enhances design efficiency by enabling teams to pre-emptively address potential issues before they escalate into more substantial problems. The data show that teams who systematically identified and mitigated risks during the conceptual design phase were able to optimise resource use, reduce the need for rework, and achieve more robust and reliable outcomes. The structured use of tools like Design Structure Matrices (DSMs) and Risk Propagation Matrices facilitated this process by helping teams manage complex interdependencies and make more informed decisions. This proactive approach not only minimised inefficiencies but also contributed to a smoother, more streamlined design process, ultimately leading to higher-quality products. These findings underscore the importance of integrating risk management into the early stages of design, as it not only improves the efficiency of the process but also enhances the overall efficacy, reliability and ultimately success of the final product.
Despite careful design, this study has limitations. First, the controlled experimental setup does not fully replicate industrial conditions, where external pressures, organisational constraints and iterative decision-making cycles influence risk management. Second, while participant diversity was ensured, differences in prior exposure to the selected tools may have impacted engagement levels. Third, the usefulness of the tools may have been influenced by how they were configured and the data pre-loaded into them. Although values such as propagation scores and mitigation costs were constructed to be internally consistent and balanced, their artificial nature may still have shaped participant perceptions. The data were not designed to suggest a single “correct” outcome, but rather to support reasoning around trade-offs, i.e., reflecting typical engineering situations where decisions are made using structured but imperfect inputs. Finally, learning effects within teams could have influenced decision patterns, as participants adapted to the available tools over time. Future studies should explore these factors in longitudinal settings.
7. Conclusion
We have shown that strategically using design support that provides more granular information about the criticality of interfaces can effectively facilitate risk evaluation and treatment in complex systems. Using these support tools early with lower intensity and picking up the pace later in the process, design teams can reduce the time required to identify risks and thus enhance their design process efficiency. Furthermore, delaying the use of design supports makes the teams select risk mitigation elements that possess a better cost–benefit ratio. Teams with low industrial experience did not experience longer risk management durations than teams with high experience, which we attribute partly to their increased use of design support. Therefore, our research establishes a new theoretical connection between design support and risk evaluation and treatment in companies developing complex systems with many interfaces.
Acknowledgements
The authors would like to thank all participants in the experimental workshops for their engagement and valuable contributions. We are especially grateful to the industrial partners (Volvo Cars and Volvo Trucks Technology), as well as the organisers of the 25th International DSM Conference (DSM 2023) and Industry Sprint Workshop (ISW) participants.
Financial support
This work was supported by VINNOVA, the Swedish Innovation Agency, under Grant [2018–02692].


 Open access